Key Insights
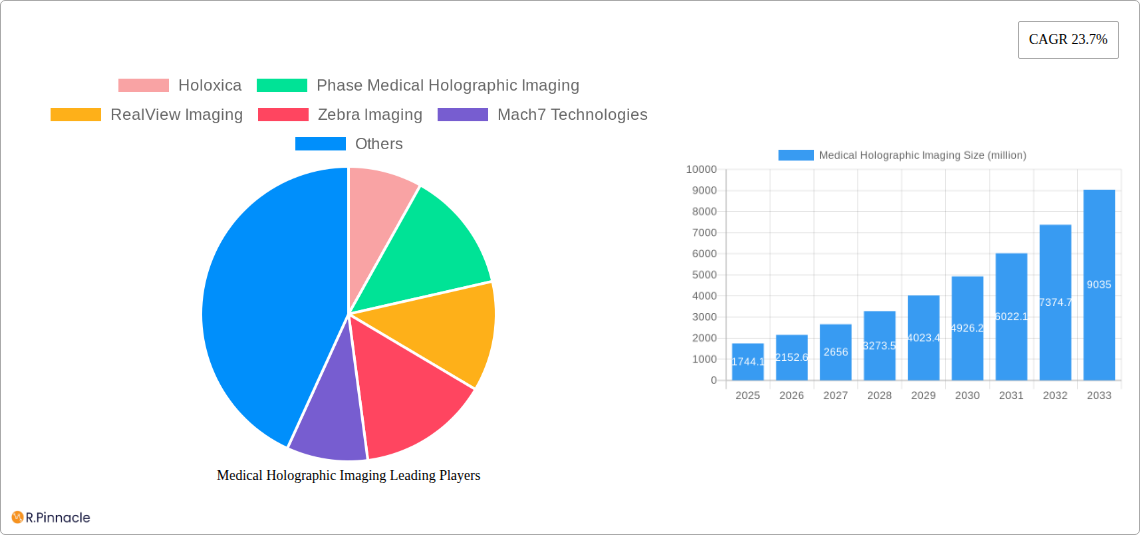
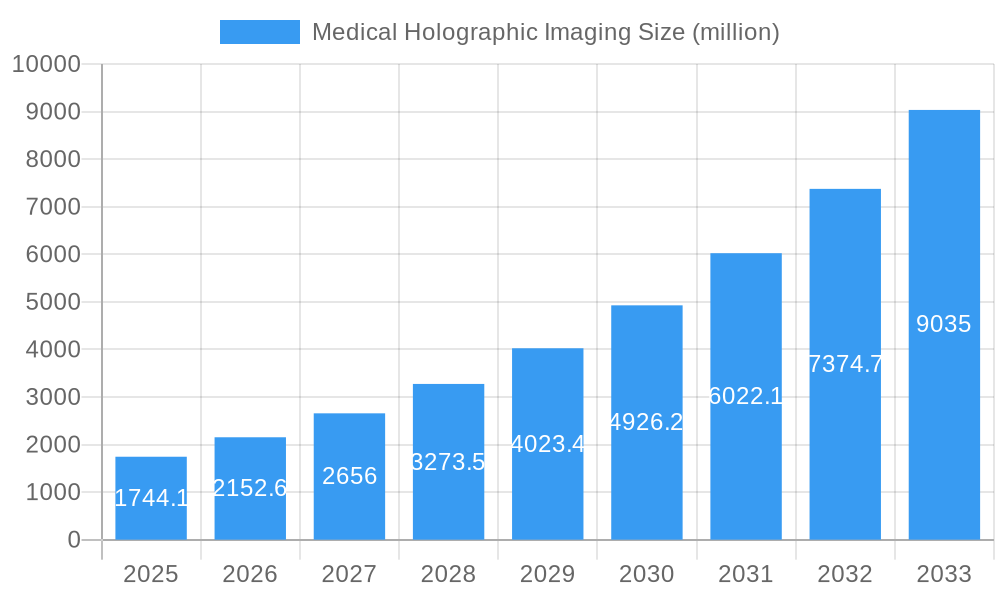
The medical holographic imaging market is experiencing explosive growth, projected to reach $1744.1 million in 2025 and exhibiting a remarkable Compound Annual Growth Rate (CAGR) of 23.7% from 2019 to 2033. This surge is driven primarily by the increasing demand for minimally invasive procedures, the rising adoption of advanced imaging technologies in healthcare, and the growing need for precise and detailed anatomical visualizations for improved diagnosis and treatment planning. Advancements in holographic display technology, coupled with decreasing costs and improved image resolution, are further fueling market expansion. Key applications include surgical planning, medical education, and real-time visualization during minimally invasive surgeries. The market is witnessing the emergence of innovative solutions that offer superior image quality and increased functionality compared to traditional 2D imaging techniques. Competition is relatively high, with both established medical device companies and specialized holographic imaging firms vying for market share. However, the high cost of equipment and the need for specialized expertise remain challenges to broader adoption.
Medical Holographic Imaging Market Size (In Billion)
The forecast period (2025-2033) promises continued robust growth, particularly driven by the expanding geriatric population requiring more complex procedures and the increasing integration of artificial intelligence (AI) and machine learning (ML) into holographic imaging systems for enhanced diagnostic accuracy and personalized treatment. Regional variations are expected, with North America and Europe likely maintaining a significant market share due to early adoption and robust healthcare infrastructure. However, rapidly developing economies in Asia-Pacific are anticipated to witness substantial growth fueled by rising healthcare spending and technological advancements. Furthermore, ongoing research and development efforts focused on improving image quality, resolution, and integration with other medical imaging modalities will continue to shape the market trajectory in the coming years.
Medical Holographic Imaging Company Market Share
Medical Holographic Imaging Market Report: 2019-2033
This comprehensive report provides an in-depth analysis of the global medical holographic imaging market, projecting a robust growth trajectory driven by technological advancements and increasing demand for minimally invasive procedures. The study period covers 2019-2033, with a base year of 2025 and a forecast period of 2025-2033. This report is essential for industry professionals, investors, and researchers seeking to understand the market dynamics, competitive landscape, and future potential of this transformative technology. The report includes detailed analysis of market size (projected to reach xx million by 2033), CAGR, market share, and key growth drivers.
Medical Holographic Imaging Market Structure & Innovation Trends
The medical holographic imaging market is characterized by a moderate level of concentration, with several key players vying for market share. Holoxica, Phase Medical Holographic Imaging, RealView Imaging, and others are driving innovation through the development of advanced 3D imaging solutions. The market is witnessing significant M&A activity, with deal values exceeding xx million in the past five years. Regulatory frameworks, while still evolving, are generally supportive of the adoption of innovative medical imaging technologies. The main product substitutes are traditional 2D imaging modalities, but holographic imaging offers superior visualization capabilities, driving market penetration. End-user demographics are expanding to include hospitals, clinics, and research institutions.
- Market Concentration: Moderately concentrated, with a few dominant players.
- Innovation Drivers: Advancements in holographic display technology, improved image processing algorithms, and growing demand for minimally invasive procedures.
- Regulatory Framework: Supportive, with ongoing development of specific guidelines.
- M&A Activity: xx million in deal value over the past five years, indicating market consolidation.
- Market Share (2025): Holoxica (xx%), Phase Medical (xx%), RealView Imaging (xx%), Others (xx%).
Medical Holographic Imaging Market Dynamics & Trends
The global medical holographic imaging market is experiencing significant growth, driven by several key factors. The rising prevalence of chronic diseases, increasing demand for minimally invasive surgical procedures, and the technological advancements leading to improved image quality and resolution are major contributors. The market is witnessing technological disruptions through the integration of AI and machine learning, leading to enhanced diagnostic capabilities and improved treatment outcomes. Consumer preferences are shifting towards non-invasive and accurate diagnostic tools, further driving the demand for holographic imaging solutions. Competitive dynamics are shaping the market with established players and new entrants vying for market share through product differentiation and strategic partnerships. The CAGR for the forecast period (2025-2033) is estimated at xx%, with market penetration expected to reach xx% by 2033.
Dominant Regions & Segments in Medical Holographic Imaging
North America currently holds the leading position in the medical holographic imaging market due to robust healthcare infrastructure, high adoption rates of advanced medical technologies, and favorable regulatory environments. Europe and Asia-Pacific are also experiencing significant growth, fueled by increasing healthcare spending and rising awareness of advanced imaging techniques.
Key Drivers for North American Dominance:
- Advanced Healthcare Infrastructure: Well-established hospitals and clinics readily adopting new technologies.
- High Healthcare Expenditure: Ample funding for research and development of new medical devices.
- Favorable Regulatory Environment: Supportive regulatory frameworks accelerating the adoption of innovative technologies.
Medical Holographic Imaging Product Innovations
Recent product innovations include advancements in holographic display technology, enabling higher resolution and more realistic 3D imaging. New applications are emerging in minimally invasive surgery, diagnostics, and medical education. These innovations offer significant competitive advantages, including enhanced visualization, improved precision, and reduced invasiveness. The market is witnessing a trend towards integration with AI and machine learning for automated analysis and improved diagnostic accuracy.
Report Scope & Segmentation Analysis
This report segments the market by product type (e.g., holographic endoscopes, microscopes), application (e.g., surgery, diagnostics), and end-user (e.g., hospitals, clinics). Each segment exhibits unique growth trajectories and competitive dynamics. The market size for each segment is projected to grow significantly over the forecast period, driven by specific factors within each segment.
Key Drivers of Medical Holographic Imaging Growth
Technological advancements such as higher resolution displays and improved image processing algorithms are key drivers. Economic factors, including increased healthcare spending and government initiatives to promote medical innovation, are also significant. Favorable regulatory environments further accelerate market adoption. The increasing demand for minimally invasive procedures further fuels market growth.
Challenges in the Medical Holographic Imaging Sector
High initial investment costs for equipment can limit adoption, especially in resource-constrained settings. Supply chain disruptions can impact production and availability. Intense competition among established players and emerging entrants poses a challenge. Regulatory hurdles and approval processes can delay market entry for new products. These factors collectively impact market growth, although the overall outlook remains positive.
Emerging Opportunities in Medical Holographic Imaging
The integration of AI and machine learning for automated image analysis presents significant opportunities. Expansion into new therapeutic areas, such as oncology and cardiology, offers untapped potential. Growing demand in developing economies presents significant opportunities for market expansion. Development of portable and cost-effective devices can further increase accessibility.
Leading Players in the Medical Holographic Imaging Market
- Holoxica
- Phase Medical Holographic Imaging
- RealView Imaging
- Zebra Imaging
- Mach7 Technologies
- Ovizio Imaging Systems
- Nanolive
- Eon Reality
- zSpace
- EchoPixel
- Lyncée Tec
- Holografika Kft
- Shenzhen Mindray
- Shenzhen Holographic Medical
- Beijing Chuhuan
Key Developments in Medical Holographic Imaging Industry
- 2022 Q4: Holoxica launched a new holographic microscopy system.
- 2023 Q1: Phase Medical announced a strategic partnership for distribution in Asia.
- 2023 Q2: RealView Imaging secured xx million in Series B funding. (Further details for other years are needed for completion)
Future Outlook for Medical Holographic Imaging Market
The medical holographic imaging market is poised for significant growth over the next decade. Continued technological innovation, expanding applications, and increasing adoption in diverse healthcare settings will drive market expansion. Strategic partnerships, mergers and acquisitions, and focused research and development will shape the competitive landscape and accelerate market penetration. The market offers substantial opportunities for companies involved in developing, manufacturing, and distributing holographic imaging technologies.
Medical Holographic Imaging Segmentation
-
1. Application
- 1.1. Hospitals and Clinics
- 1.2. Pharmaceutical Company
- 1.3. Research Institutions
- 1.4. Others
-
2. Types
- 2.1. 270 Degree Holographic
- 2.2. 360 Degree Holographic
- 2.3. Others
Medical Holographic Imaging Segmentation By Geography
-
1. North America
- 1.1. United States
- 1.2. Canada
- 1.3. Mexico
-
2. South America
- 2.1. Brazil
- 2.2. Argentina
- 2.3. Rest of South America
-
3. Europe
- 3.1. United Kingdom
- 3.2. Germany
- 3.3. France
- 3.4. Italy
- 3.5. Spain
- 3.6. Russia
- 3.7. Benelux
- 3.8. Nordics
- 3.9. Rest of Europe
-
4. Middle East & Africa
- 4.1. Turkey
- 4.2. Israel
- 4.3. GCC
- 4.4. North Africa
- 4.5. South Africa
- 4.6. Rest of Middle East & Africa
-
5. Asia Pacific
- 5.1. China
- 5.2. India
- 5.3. Japan
- 5.4. South Korea
- 5.5. ASEAN
- 5.6. Oceania
- 5.7. Rest of Asia Pacific
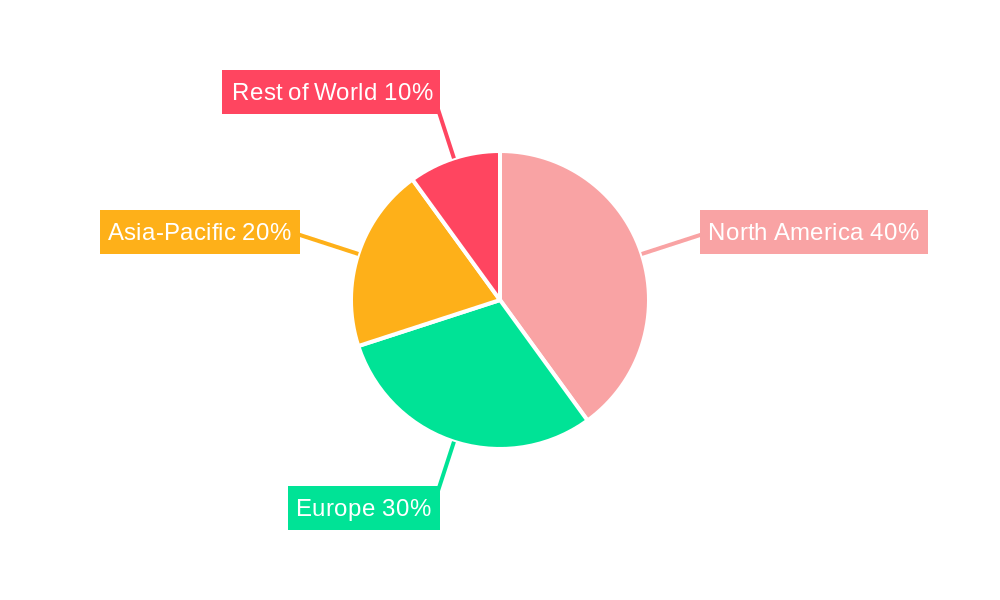
Medical Holographic Imaging Regional Market Share
Geographic Coverage of Medical Holographic Imaging
Medical Holographic Imaging REPORT HIGHLIGHTS
| Aspects | Details |
|---|---|
| Study Period | 2020-2034 |
| Base Year | 2025 |
| Estimated Year | 2026 |
| Forecast Period | 2026-2034 |
| Historical Period | 2020-2025 |
| Growth Rate | CAGR of 12.13% from 2020-2034 |
| Segmentation |
|
Table of Contents
- 1. Introduction
- 1.1. Research Scope
- 1.2. Market Segmentation
- 1.3. Research Objective
- 1.4. Definitions and Assumptions
- 2. Executive Summary
- 2.1. Market Snapshot
- 3. Market Dynamics
- 3.1. Market Drivers
- 3.2. Market Restrains
- 3.3. Market Trends
- 3.4. Market Opportunities
- 4. Market Factor Analysis
- 4.1. Porters Five Forces
- 4.1.1. Bargaining Power of Suppliers
- 4.1.2. Bargaining Power of Buyers
- 4.1.3. Threat of New Entrants
- 4.1.4. Threat of Substitutes
- 4.1.5. Competitive Rivalry
- 4.2. PESTEL analysis
- 4.3. BCG Analysis
- 4.3.1. Stars (High Growth, High Market Share)
- 4.3.2. Cash Cows (Low Growth, High Market Share)
- 4.3.3. Question Mark (High Growth, Low Market Share)
- 4.3.4. Dogs (Low Growth, Low Market Share)
- 4.4. Ansoff Matrix Analysis
- 4.5. Supply Chain Analysis
- 4.6. Regulatory Landscape
- 4.7. Current Market Potential and Opportunity Assessment (TAM–SAM–SOM Framework)
- 4.8. PRI Analyst Note
- 4.1. Porters Five Forces
- 5. Market Analysis, Insights and Forecast 2021-2033
- 5.1. Market Analysis, Insights and Forecast - by Application
- 5.1.1. Hospitals and Clinics
- 5.1.2. Pharmaceutical Company
- 5.1.3. Research Institutions
- 5.1.4. Others
- 5.2. Market Analysis, Insights and Forecast - by Types
- 5.2.1. 270 Degree Holographic
- 5.2.2. 360 Degree Holographic
- 5.2.3. Others
- 5.3. Market Analysis, Insights and Forecast - by Region
- 5.3.1. North America
- 5.3.2. South America
- 5.3.3. Europe
- 5.3.4. Middle East & Africa
- 5.3.5. Asia Pacific
- 5.1. Market Analysis, Insights and Forecast - by Application
- 6. Global Medical Holographic Imaging Analysis, Insights and Forecast, 2021-2033
- 6.1. Market Analysis, Insights and Forecast - by Application
- 6.1.1. Hospitals and Clinics
- 6.1.2. Pharmaceutical Company
- 6.1.3. Research Institutions
- 6.1.4. Others
- 6.2. Market Analysis, Insights and Forecast - by Types
- 6.2.1. 270 Degree Holographic
- 6.2.2. 360 Degree Holographic
- 6.2.3. Others
- 6.1. Market Analysis, Insights and Forecast - by Application
- 7. North America Medical Holographic Imaging Analysis, Insights and Forecast, 2020-2032
- 7.1. Market Analysis, Insights and Forecast - by Application
- 7.1.1. Hospitals and Clinics
- 7.1.2. Pharmaceutical Company
- 7.1.3. Research Institutions
- 7.1.4. Others
- 7.2. Market Analysis, Insights and Forecast - by Types
- 7.2.1. 270 Degree Holographic
- 7.2.2. 360 Degree Holographic
- 7.2.3. Others
- 7.1. Market Analysis, Insights and Forecast - by Application
- 8. South America Medical Holographic Imaging Analysis, Insights and Forecast, 2020-2032
- 8.1. Market Analysis, Insights and Forecast - by Application
- 8.1.1. Hospitals and Clinics
- 8.1.2. Pharmaceutical Company
- 8.1.3. Research Institutions
- 8.1.4. Others
- 8.2. Market Analysis, Insights and Forecast - by Types
- 8.2.1. 270 Degree Holographic
- 8.2.2. 360 Degree Holographic
- 8.2.3. Others
- 8.1. Market Analysis, Insights and Forecast - by Application
- 9. Europe Medical Holographic Imaging Analysis, Insights and Forecast, 2020-2032
- 9.1. Market Analysis, Insights and Forecast - by Application
- 9.1.1. Hospitals and Clinics
- 9.1.2. Pharmaceutical Company
- 9.1.3. Research Institutions
- 9.1.4. Others
- 9.2. Market Analysis, Insights and Forecast - by Types
- 9.2.1. 270 Degree Holographic
- 9.2.2. 360 Degree Holographic
- 9.2.3. Others
- 9.1. Market Analysis, Insights and Forecast - by Application
- 10. Middle East & Africa Medical Holographic Imaging Analysis, Insights and Forecast, 2020-2032
- 10.1. Market Analysis, Insights and Forecast - by Application
- 10.1.1. Hospitals and Clinics
- 10.1.2. Pharmaceutical Company
- 10.1.3. Research Institutions
- 10.1.4. Others
- 10.2. Market Analysis, Insights and Forecast - by Types
- 10.2.1. 270 Degree Holographic
- 10.2.2. 360 Degree Holographic
- 10.2.3. Others
- 10.1. Market Analysis, Insights and Forecast - by Application
- 11. Asia Pacific Medical Holographic Imaging Analysis, Insights and Forecast, 2020-2032
- 11.1. Market Analysis, Insights and Forecast - by Application
- 11.1.1. Hospitals and Clinics
- 11.1.2. Pharmaceutical Company
- 11.1.3. Research Institutions
- 11.1.4. Others
- 11.2. Market Analysis, Insights and Forecast - by Types
- 11.2.1. 270 Degree Holographic
- 11.2.2. 360 Degree Holographic
- 11.2.3. Others
- 11.1. Market Analysis, Insights and Forecast - by Application
- 12. Competitive Analysis
- 12.1. Company Profiles
- 12.1.1 Holoxica
- 12.1.1.1. Company Overview
- 12.1.1.2. Products
- 12.1.1.3. Company Financials
- 12.1.1.4. SWOT Analysis
- 12.1.2 Phase Medical Holographic Imaging
- 12.1.2.1. Company Overview
- 12.1.2.2. Products
- 12.1.2.3. Company Financials
- 12.1.2.4. SWOT Analysis
- 12.1.3 RealView Imaging
- 12.1.3.1. Company Overview
- 12.1.3.2. Products
- 12.1.3.3. Company Financials
- 12.1.3.4. SWOT Analysis
- 12.1.4 Zebra lmaging
- 12.1.4.1. Company Overview
- 12.1.4.2. Products
- 12.1.4.3. Company Financials
- 12.1.4.4. SWOT Analysis
- 12.1.5 Mach7 Technologies
- 12.1.5.1. Company Overview
- 12.1.5.2. Products
- 12.1.5.3. Company Financials
- 12.1.5.4. SWOT Analysis
- 12.1.6 Ovizio Imaging Systems
- 12.1.6.1. Company Overview
- 12.1.6.2. Products
- 12.1.6.3. Company Financials
- 12.1.6.4. SWOT Analysis
- 12.1.7 Nanolive
- 12.1.7.1. Company Overview
- 12.1.7.2. Products
- 12.1.7.3. Company Financials
- 12.1.7.4. SWOT Analysis
- 12.1.8 Eon Reality
- 12.1.8.1. Company Overview
- 12.1.8.2. Products
- 12.1.8.3. Company Financials
- 12.1.8.4. SWOT Analysis
- 12.1.9 zSpace
- 12.1.9.1. Company Overview
- 12.1.9.2. Products
- 12.1.9.3. Company Financials
- 12.1.9.4. SWOT Analysis
- 12.1.10 EchoPixel
- 12.1.10.1. Company Overview
- 12.1.10.2. Products
- 12.1.10.3. Company Financials
- 12.1.10.4. SWOT Analysis
- 12.1.11 Lyncée Tec
- 12.1.11.1. Company Overview
- 12.1.11.2. Products
- 12.1.11.3. Company Financials
- 12.1.11.4. SWOT Analysis
- 12.1.12 Holografika Kft
- 12.1.12.1. Company Overview
- 12.1.12.2. Products
- 12.1.12.3. Company Financials
- 12.1.12.4. SWOT Analysis
- 12.1.13 Shenzhen Mindray
- 12.1.13.1. Company Overview
- 12.1.13.2. Products
- 12.1.13.3. Company Financials
- 12.1.13.4. SWOT Analysis
- 12.1.14 Shenzhen Holographic Medical
- 12.1.14.1. Company Overview
- 12.1.14.2. Products
- 12.1.14.3. Company Financials
- 12.1.14.4. SWOT Analysis
- 12.1.15 Beijing Chuhuan
- 12.1.15.1. Company Overview
- 12.1.15.2. Products
- 12.1.15.3. Company Financials
- 12.1.15.4. SWOT Analysis
- 12.1.1 Holoxica
- 12.2. Market Entropy
- 12.2.1 Company's Key Areas Served
- 12.2.2 Recent Developments
- 12.3. Company Market Share Analysis 2025
- 12.3.1 Top 5 Companies Market Share Analysis
- 12.3.2 Top 3 Companies Market Share Analysis
- 12.4. List of Potential Customers
- 13. Research Methodology
List of Figures
- Figure 1: Global Medical Holographic Imaging Revenue Breakdown (undefined, %) by Region 2025 & 2033
- Figure 2: North America Medical Holographic Imaging Revenue (undefined), by Application 2025 & 2033
- Figure 3: North America Medical Holographic Imaging Revenue Share (%), by Application 2025 & 2033
- Figure 4: North America Medical Holographic Imaging Revenue (undefined), by Types 2025 & 2033
- Figure 5: North America Medical Holographic Imaging Revenue Share (%), by Types 2025 & 2033
- Figure 6: North America Medical Holographic Imaging Revenue (undefined), by Country 2025 & 2033
- Figure 7: North America Medical Holographic Imaging Revenue Share (%), by Country 2025 & 2033
- Figure 8: South America Medical Holographic Imaging Revenue (undefined), by Application 2025 & 2033
- Figure 9: South America Medical Holographic Imaging Revenue Share (%), by Application 2025 & 2033
- Figure 10: South America Medical Holographic Imaging Revenue (undefined), by Types 2025 & 2033
- Figure 11: South America Medical Holographic Imaging Revenue Share (%), by Types 2025 & 2033
- Figure 12: South America Medical Holographic Imaging Revenue (undefined), by Country 2025 & 2033
- Figure 13: South America Medical Holographic Imaging Revenue Share (%), by Country 2025 & 2033
- Figure 14: Europe Medical Holographic Imaging Revenue (undefined), by Application 2025 & 2033
- Figure 15: Europe Medical Holographic Imaging Revenue Share (%), by Application 2025 & 2033
- Figure 16: Europe Medical Holographic Imaging Revenue (undefined), by Types 2025 & 2033
- Figure 17: Europe Medical Holographic Imaging Revenue Share (%), by Types 2025 & 2033
- Figure 18: Europe Medical Holographic Imaging Revenue (undefined), by Country 2025 & 2033
- Figure 19: Europe Medical Holographic Imaging Revenue Share (%), by Country 2025 & 2033
- Figure 20: Middle East & Africa Medical Holographic Imaging Revenue (undefined), by Application 2025 & 2033
- Figure 21: Middle East & Africa Medical Holographic Imaging Revenue Share (%), by Application 2025 & 2033
- Figure 22: Middle East & Africa Medical Holographic Imaging Revenue (undefined), by Types 2025 & 2033
- Figure 23: Middle East & Africa Medical Holographic Imaging Revenue Share (%), by Types 2025 & 2033
- Figure 24: Middle East & Africa Medical Holographic Imaging Revenue (undefined), by Country 2025 & 2033
- Figure 25: Middle East & Africa Medical Holographic Imaging Revenue Share (%), by Country 2025 & 2033
- Figure 26: Asia Pacific Medical Holographic Imaging Revenue (undefined), by Application 2025 & 2033
- Figure 27: Asia Pacific Medical Holographic Imaging Revenue Share (%), by Application 2025 & 2033
- Figure 28: Asia Pacific Medical Holographic Imaging Revenue (undefined), by Types 2025 & 2033
- Figure 29: Asia Pacific Medical Holographic Imaging Revenue Share (%), by Types 2025 & 2033
- Figure 30: Asia Pacific Medical Holographic Imaging Revenue (undefined), by Country 2025 & 2033
- Figure 31: Asia Pacific Medical Holographic Imaging Revenue Share (%), by Country 2025 & 2033
List of Tables
- Table 1: Global Medical Holographic Imaging Revenue undefined Forecast, by Application 2020 & 2033
- Table 2: Global Medical Holographic Imaging Revenue undefined Forecast, by Types 2020 & 2033
- Table 3: Global Medical Holographic Imaging Revenue undefined Forecast, by Region 2020 & 2033
- Table 4: Global Medical Holographic Imaging Revenue undefined Forecast, by Application 2020 & 2033
- Table 5: Global Medical Holographic Imaging Revenue undefined Forecast, by Types 2020 & 2033
- Table 6: Global Medical Holographic Imaging Revenue undefined Forecast, by Country 2020 & 2033
- Table 7: United States Medical Holographic Imaging Revenue (undefined) Forecast, by Application 2020 & 2033
- Table 8: Canada Medical Holographic Imaging Revenue (undefined) Forecast, by Application 2020 & 2033
- Table 9: Mexico Medical Holographic Imaging Revenue (undefined) Forecast, by Application 2020 & 2033
- Table 10: Global Medical Holographic Imaging Revenue undefined Forecast, by Application 2020 & 2033
- Table 11: Global Medical Holographic Imaging Revenue undefined Forecast, by Types 2020 & 2033
- Table 12: Global Medical Holographic Imaging Revenue undefined Forecast, by Country 2020 & 2033
- Table 13: Brazil Medical Holographic Imaging Revenue (undefined) Forecast, by Application 2020 & 2033
- Table 14: Argentina Medical Holographic Imaging Revenue (undefined) Forecast, by Application 2020 & 2033
- Table 15: Rest of South America Medical Holographic Imaging Revenue (undefined) Forecast, by Application 2020 & 2033
- Table 16: Global Medical Holographic Imaging Revenue undefined Forecast, by Application 2020 & 2033
- Table 17: Global Medical Holographic Imaging Revenue undefined Forecast, by Types 2020 & 2033
- Table 18: Global Medical Holographic Imaging Revenue undefined Forecast, by Country 2020 & 2033
- Table 19: United Kingdom Medical Holographic Imaging Revenue (undefined) Forecast, by Application 2020 & 2033
- Table 20: Germany Medical Holographic Imaging Revenue (undefined) Forecast, by Application 2020 & 2033
- Table 21: France Medical Holographic Imaging Revenue (undefined) Forecast, by Application 2020 & 2033
- Table 22: Italy Medical Holographic Imaging Revenue (undefined) Forecast, by Application 2020 & 2033
- Table 23: Spain Medical Holographic Imaging Revenue (undefined) Forecast, by Application 2020 & 2033
- Table 24: Russia Medical Holographic Imaging Revenue (undefined) Forecast, by Application 2020 & 2033
- Table 25: Benelux Medical Holographic Imaging Revenue (undefined) Forecast, by Application 2020 & 2033
- Table 26: Nordics Medical Holographic Imaging Revenue (undefined) Forecast, by Application 2020 & 2033
- Table 27: Rest of Europe Medical Holographic Imaging Revenue (undefined) Forecast, by Application 2020 & 2033
- Table 28: Global Medical Holographic Imaging Revenue undefined Forecast, by Application 2020 & 2033
- Table 29: Global Medical Holographic Imaging Revenue undefined Forecast, by Types 2020 & 2033
- Table 30: Global Medical Holographic Imaging Revenue undefined Forecast, by Country 2020 & 2033
- Table 31: Turkey Medical Holographic Imaging Revenue (undefined) Forecast, by Application 2020 & 2033
- Table 32: Israel Medical Holographic Imaging Revenue (undefined) Forecast, by Application 2020 & 2033
- Table 33: GCC Medical Holographic Imaging Revenue (undefined) Forecast, by Application 2020 & 2033
- Table 34: North Africa Medical Holographic Imaging Revenue (undefined) Forecast, by Application 2020 & 2033
- Table 35: South Africa Medical Holographic Imaging Revenue (undefined) Forecast, by Application 2020 & 2033
- Table 36: Rest of Middle East & Africa Medical Holographic Imaging Revenue (undefined) Forecast, by Application 2020 & 2033
- Table 37: Global Medical Holographic Imaging Revenue undefined Forecast, by Application 2020 & 2033
- Table 38: Global Medical Holographic Imaging Revenue undefined Forecast, by Types 2020 & 2033
- Table 39: Global Medical Holographic Imaging Revenue undefined Forecast, by Country 2020 & 2033
- Table 40: China Medical Holographic Imaging Revenue (undefined) Forecast, by Application 2020 & 2033
- Table 41: India Medical Holographic Imaging Revenue (undefined) Forecast, by Application 2020 & 2033
- Table 42: Japan Medical Holographic Imaging Revenue (undefined) Forecast, by Application 2020 & 2033
- Table 43: South Korea Medical Holographic Imaging Revenue (undefined) Forecast, by Application 2020 & 2033
- Table 44: ASEAN Medical Holographic Imaging Revenue (undefined) Forecast, by Application 2020 & 2033
- Table 45: Oceania Medical Holographic Imaging Revenue (undefined) Forecast, by Application 2020 & 2033
- Table 46: Rest of Asia Pacific Medical Holographic Imaging Revenue (undefined) Forecast, by Application 2020 & 2033
Frequently Asked Questions
1. What is the projected Compound Annual Growth Rate (CAGR) of the Medical Holographic Imaging?
The projected CAGR is approximately 12.13%.
2. Which companies are prominent players in the Medical Holographic Imaging?
Key companies in the market include Holoxica, Phase Medical Holographic Imaging, RealView Imaging, Zebra lmaging, Mach7 Technologies, Ovizio Imaging Systems, Nanolive, Eon Reality, zSpace, EchoPixel, Lyncée Tec, Holografika Kft, Shenzhen Mindray, Shenzhen Holographic Medical, Beijing Chuhuan.
3. What are the main segments of the Medical Holographic Imaging?
The market segments include Application, Types.
4. Can you provide details about the market size?
The market size is estimated to be USD XXX N/A as of 2022.
5. What are some drivers contributing to market growth?
N/A
6. What are the notable trends driving market growth?
N/A
7. Are there any restraints impacting market growth?
N/A
8. Can you provide examples of recent developments in the market?
N/A
9. What pricing options are available for accessing the report?
Pricing options include single-user, multi-user, and enterprise licenses priced at USD 3950.00, USD 5925.00, and USD 7900.00 respectively.
10. Is the market size provided in terms of value or volume?
The market size is provided in terms of value, measured in N/A.
11. Are there any specific market keywords associated with the report?
Yes, the market keyword associated with the report is "Medical Holographic Imaging," which aids in identifying and referencing the specific market segment covered.
12. How do I determine which pricing option suits my needs best?
The pricing options vary based on user requirements and access needs. Individual users may opt for single-user licenses, while businesses requiring broader access may choose multi-user or enterprise licenses for cost-effective access to the report.
13. Are there any additional resources or data provided in the Medical Holographic Imaging report?
While the report offers comprehensive insights, it's advisable to review the specific contents or supplementary materials provided to ascertain if additional resources or data are available.
14. How can I stay updated on further developments or reports in the Medical Holographic Imaging?
To stay informed about further developments, trends, and reports in the Medical Holographic Imaging, consider subscribing to industry newsletters, following relevant companies and organizations, or regularly checking reputable industry news sources and publications.
Methodology
Step 1 - Identification of Relevant Samples Size from Population Database


Step 2 - Approaches for Defining Global Market Size (Value, Volume* & Price*)

Note*: In applicable scenarios
Step 3 - Data Sources
Primary Research
- Web Analytics
- Survey Reports
- Research Institute
- Latest Research Reports
- Opinion Leaders
Secondary Research
- Annual Reports
- White Paper
- Latest Press Release
- Industry Association
- Paid Database
- Investor Presentations

Step 4 - Data Triangulation
Involves using different sources of information in order to increase the validity of a study
These sources are likely to be stakeholders in a program - participants, other researchers, program staff, other community members, and so on.
Then we put all data in single framework & apply various statistical tools to find out the dynamic on the market.
During the analysis stage, feedback from the stakeholder groups would be compared to determine areas of agreement as well as areas of divergence

