

Key Insights
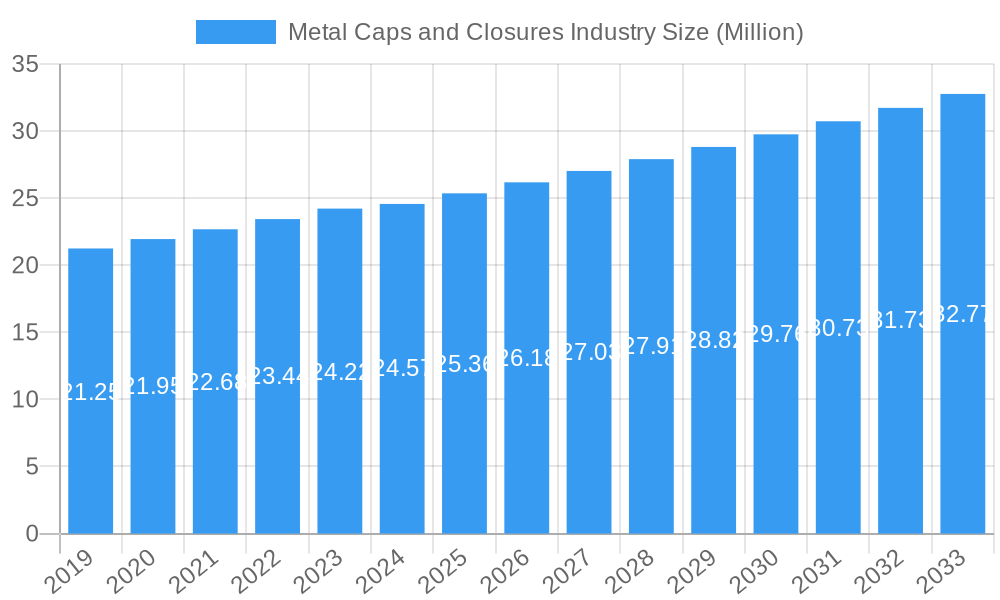
The global Metal Caps and Closures market is projected to reach a substantial $24.57 million by 2025, exhibiting a robust Compound Annual Growth Rate (CAGR) of 3.38% through 2033. This sustained expansion is fueled by the indispensable role of metal closures in ensuring product integrity, extending shelf life, and providing tamper-evident security across a wide spectrum of industries. The increasing demand for packaged food and beverages, coupled with the growing pharmaceutical sector's need for reliable containment solutions, are primary drivers. Furthermore, advancements in material science leading to lighter, more durable, and eco-friendlier metal closure options, along with innovative designs like enhanced grip and easier opening mechanisms, are contributing significantly to market growth. The rising global population and evolving consumer lifestyles, which necessitate convenient and safe packaged goods, further underpin this positive trajectory.
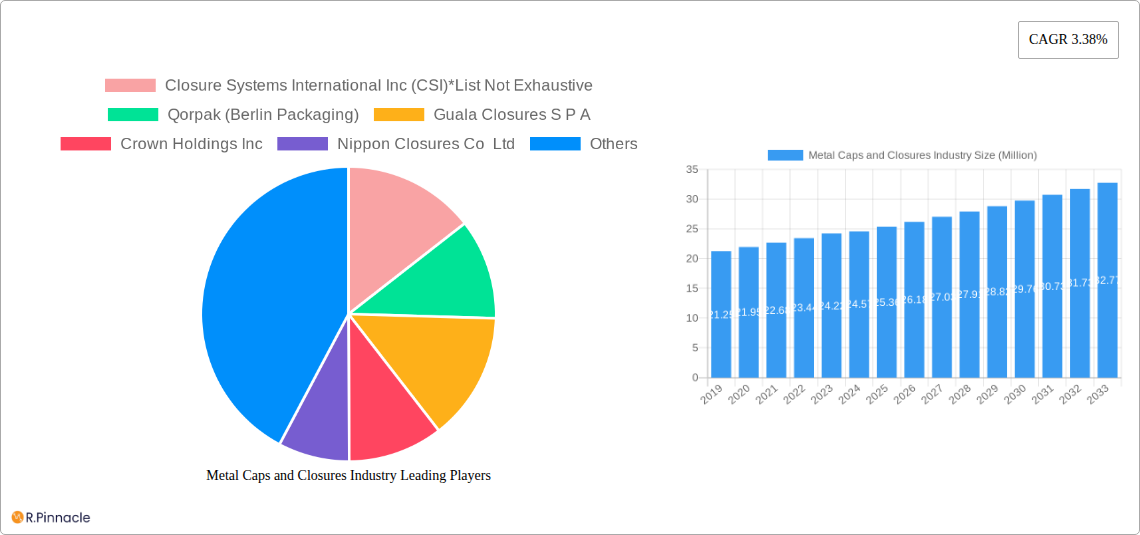
Metal Caps and Closures Industry Market Size (In Million)
The market's segmentation reveals a dynamic landscape, with Aluminum and Steel dominating as key material types, offering a balance of strength, corrosion resistance, and cost-effectiveness. Crown Caps and Screw Caps are the most prevalent closure types, catering to diverse product requirements and packaging machinery. The Food and Beverages sectors, especially alcoholic and non-alcoholic drinks, represent the largest end-user industries, driven by increasing consumption and the need for premium packaging. The Pharmaceutical sector also presents a significant growth avenue due to stringent regulatory requirements for drug safety and preservation. Emerging trends include the adoption of sustainable practices, such as increased use of recycled metals and lighter-weight designs to reduce environmental impact, alongside the integration of smart technologies for enhanced traceability and authentication. However, the market may face restraints such as fluctuating raw material prices and the growing competition from alternative packaging materials like plastic and glass, especially in certain niche applications.
Metal Caps and Closures Industry Company Market Share
This in-depth report provides a definitive analysis of the global Metal Caps and Closures industry, offering critical insights for stakeholders looking to navigate this dynamic market. Covering the period from 2019 to 2033, with a base year of 2025 and a forecast period of 2025-2033, this comprehensive study delves into market structure, dynamics, dominant regions, product innovations, key drivers, challenges, emerging opportunities, and the competitive landscape. Leveraging high-ranking keywords such as "metal closures market," "aluminum caps industry," "screw caps market share," "beverage packaging solutions," and "sustainable closures trends," this report is optimized for maximum search visibility and reader engagement within the industry.
Metal Caps and Closures Industry Market Structure & Innovation Trends
The global Metal Caps and Closures market exhibits a moderate to high level of concentration, with key players like Crown Holdings Inc. and Amcor PLC holding significant market shares, estimated to be in the range of 15-20% collectively. Innovation is a critical differentiator, driven by the demand for enhanced product safety, convenience, and sustainability. Regulatory frameworks, particularly concerning food contact materials and environmental impact, are increasingly influencing product development and manufacturing processes, with compliance expected to be a major factor. Product substitutes, such as plastic closures and flexible packaging, pose a competitive threat, necessitating continuous innovation in metal closure designs and functionalities. End-user demographics are shifting towards convenience and premiumization, especially in the beverage and personal care sectors. Mergers and Acquisitions (M&A) activity remains a significant strategy for market consolidation and expansion, with deal values often ranging from tens to hundreds of millions of dollars, enabling companies to acquire new technologies and broaden their geographical reach. For instance, Qorpak's acquisition by Berlin Packaging underscored the trend of consolidation.
Metal Caps and Closures Industry Market Dynamics & Trends
The Metal Caps and Closures industry is experiencing robust growth, projected to expand at a Compound Annual Growth Rate (CAGR) of approximately 5-7% during the forecast period. This upward trajectory is propelled by several key factors. The burgeoning global population, coupled with rising disposable incomes, is fueling demand across end-user industries such as food, beverages, and pharmaceuticals. The non-alcoholic and alcoholic beverage sectors, in particular, are significant contributors, driven by the popularity of bottled water, soft drinks, juices, and a wide array of alcoholic beverages requiring secure and tamper-evident sealing solutions. Technological advancements are revolutionizing the industry, with a focus on lightweighting, improved sealing performance, and enhanced recyclability of metal closures. The increasing consumer preference for premium and aesthetically appealing packaging is also driving demand for innovative designs and finishes in metal caps and closures. Furthermore, growing awareness and stringent regulations regarding product safety and shelf-life extension are mandating the use of high-quality, reliable metal sealing solutions. The competitive landscape is characterized by intense rivalry among established players and emerging regional manufacturers, with companies constantly striving to gain market penetration through product differentiation, cost optimization, and strategic partnerships. The market penetration of advanced sealing technologies is expected to accelerate as manufacturers seek to meet evolving consumer and regulatory demands for both functionality and sustainability.
Dominant Regions & Segments in Metal Caps and Closures Industry
Regional Dominance:
- Asia Pacific: This region is projected to be the largest and fastest-growing market for metal caps and closures. Key drivers include a rapidly expanding consumer base, increasing urbanization, a growing middle class with higher disposable incomes, and the robust growth of the food and beverage processing industries. Countries like China and India, with their vast populations and expanding manufacturing capabilities, are central to this dominance. Favorable government policies supporting manufacturing and infrastructure development further bolster growth.
- North America: A mature yet significant market, North America benefits from a strong presence of major beverage and pharmaceutical companies, advanced manufacturing technologies, and a high demand for premium and convenience packaging. Strict regulatory standards ensure a focus on quality and safety.
- Europe: Europe represents a substantial market share, driven by sophisticated consumer preferences, stringent environmental regulations promoting recyclability, and a well-established food and beverage industry. Sustainability initiatives are particularly influential in shaping product development and material choices.
Segment Dominance:
- Material Type:
- Aluminium: This material dominates the market due to its lightweight, excellent corrosion resistance, and high recyclability. It is extensively used in beverage cans, food containers, and pharmaceutical packaging. Its demand is further amplified by sustainability initiatives.
- Steel/Tin: While historically significant, steel and tin closures are increasingly being replaced by aluminum in some applications due to weight and cost considerations. However, they remain crucial for specific applications like preserving goods with a longer shelf life and in certain food preservation contexts.
- Closures Type:
- Screw Caps: These are the most widely used closure type, offering ease of use, re-sealability, and secure sealing for a vast array of products across all end-user industries. Their versatility makes them a consistent market leader.
- Crown Caps: Primarily used for carbonated beverages like beer and soft drinks, crown caps remain indispensable in their niche, benefiting from established infrastructure and consumer familiarity.
- Twist Metal Caps: Offering a balance of security and convenience, twist metal caps are gaining traction, particularly in food and beverage applications where re-sealability is a key consumer demand.
- End-User Industry:
- Beverages (Alcoholic & Non-Alcoholic): This is the largest and most significant end-user segment, driven by the massive global consumption of bottled water, soft drinks, juices, beer, and spirits. The demand for secure, tamper-evident, and aesthetically pleasing closures is paramount.
- Food: The food industry, encompassing preserved foods, sauces, condiments, and dairy products, represents another major consumer of metal caps and closures. Durability, barrier properties, and long-term preservation are critical requirements.
- Pharmaceuticals: In the pharmaceutical sector, stringent safety, sterility, and tamper-evident features are non-negotiable, making high-quality metal closures essential for vials and bottles.
Metal Caps and Closures Industry Product Innovations
Product innovation in the metal caps and closures industry is predominantly focused on enhancing user experience, ensuring product integrity, and promoting sustainability. Advanced tamper-evident features, such as integrated pull rings and peel-off seals, are becoming standard to provide consumers with assurance of product safety. Lightweighting initiatives are leading to the development of thinner yet stronger metal closures, reducing material consumption and transportation costs. Furthermore, companies are investing in coatings and liners that improve compatibility with diverse product contents, preventing reactions and extending shelf life. The growing emphasis on the circular economy is driving innovation in recyclability, with manufacturers exploring new alloys and finishes that facilitate easier and more efficient recycling processes, aligning with global environmental goals.
Report Scope & Segmentation Analysis
This report meticulously segments the Metal Caps and Closures market across Material Type (Aluminium, Steel, Tin), Closures Type (Crown Caps, Screw Caps, Twist Metal Caps, Other Cl), and End-User Industry (Food, Beverages (Alcoholic, Non-Alcoholic), Pharmaceuticals, Personal Care, Other End-User Industries). The Aluminium segment is anticipated to witness the highest growth rate, driven by its recyclability and versatile applications, with its market size projected to reach approximately $8,000 million by 2033. Screw caps, due to their widespread adoption across all end-user sectors, are expected to maintain their dominant position, exhibiting a steady market size of around $9,500 million by 2033. The Beverages segment, encompassing both alcoholic and non-alcoholic drinks, will continue to be the largest end-user market, projected to account for over 40% of the total market value by 2033, driven by consistent consumer demand and evolving packaging trends. Competitive dynamics within each segment are influenced by regional manufacturing capabilities, technological advancements, and the price sensitivity of end-users.
Key Drivers of Metal Caps and Closures Industry Growth
The Metal Caps and Closures industry's growth is propelled by several key drivers. The expanding global food and beverage sector, fueled by population growth and changing consumption patterns, is a primary driver. Increasing consumer demand for convenience and premiumization in packaging further boosts the market. Stringent regulations mandating tamper-evident and secure sealing solutions for product safety, especially in the pharmaceutical and food industries, are critical. Technological advancements leading to more sustainable, lightweight, and cost-effective metal closures are also significant growth accelerators. The growing emphasis on recyclability and the circular economy is driving innovation and adoption of aluminum closures.
Challenges in the Metal Caps and Closures Industry Sector
Despite robust growth, the Metal Caps and Closures industry faces several challenges. The intense competition from alternative packaging materials, such as plastic and glass, poses a significant threat, often driven by lower costs or specific perceived benefits. Fluctuations in the prices of raw materials like aluminum and steel can impact manufacturing costs and profit margins. Stringent environmental regulations, while driving sustainability, also require significant investment in compliance and new technologies. Supply chain disruptions, geopolitical uncertainties, and evolving trade policies can affect the availability and cost of raw materials and finished products. Furthermore, the high initial investment required for advanced manufacturing equipment can be a barrier for smaller players.
Emerging Opportunities in Metal Caps and Closures Industry
Emerging opportunities within the Metal Caps and Closures industry lie in sustainable packaging solutions. The increasing consumer and regulatory push for eco-friendly products presents a significant opportunity for manufacturers of recyclable and reusable metal closures, particularly aluminum. Growth in emerging economies, with their rapidly expanding middle class and increasing demand for packaged goods, offers substantial market potential. Innovations in smart packaging, incorporating features like QR codes or RFID tags, could create new avenues for product differentiation. The personal care and cosmetic sectors, with their focus on premium and durable packaging, also present growing opportunities for specialized metal closures. Furthermore, advancements in manufacturing processes, such as additive manufacturing, could lead to more complex and customized closure designs.
Leading Players in the Metal Caps and Closures Industry Market
- Closure Systems International Inc (CSI)
- Qorpak (Berlin Packaging)
- Guala Closures S P A
- Crown Holdings Inc
- Nippon Closures Co Ltd
- Amcor PLC
- Pelliconi & C SpA
- Sks Bottle & Packaging Inc
- Alameda Packaging LLC
- Silgan White Cap LLC
- O Berk Company
Key Developments in Metal Caps and Closures Industry Industry
- January 2023: Guala Closures Group received validation from the Science Based Targets Initiative (SBTi) for its 2030 Greenhouse Gas (GHG) emission targets, aligning with the 1.5°C goal. This development highlights a strong industry commitment to sustainability, with a pledge to reduce absolute scope 1 and 2 GHG emissions by 44% by 2030 (from a 2020 baseline).
- March 2022: Pelliconi announced the opening of an Outpost at the Mind the Bridge Innovation Center in San Francisco. This strategic move signifies the company's intent to actively identify emerging trends and innovative solutions for the Food & Beverage Industry, embracing international market challenges.
Future Outlook for Metal Caps and Closures Industry Market
The future outlook for the Metal Caps and Closures industry is highly promising, driven by a confluence of sustained demand and evolving market dynamics. The global shift towards sustainable packaging solutions will continue to favor metal closures, particularly aluminum, due to their inherent recyclability and the growing emphasis on the circular economy. Innovations in lightweighting, enhanced sealing technologies, and eco-friendly finishes will further solidify their market position. The expanding middle class in emerging economies presents a significant opportunity for market penetration, while the premiumization trend in developed markets will fuel demand for aesthetically pleasing and functional closures. Strategic collaborations, technological advancements in manufacturing, and a continued focus on regulatory compliance will be crucial for companies aiming to capitalize on the projected growth, with the market expected to witness substantial expansion driven by these factors.
Metal Caps and Closures Industry Segmentation
-
1. Material Type
- 1.1. Aluminium
- 1.2. Steel
- 1.3. Tin
-
2. Closures Type
- 2.1. Crown Caps
- 2.2. Screw Caps
- 2.3. Twist Metal Caps
- 2.4. Other Cl
-
3. End-User Industry
- 3.1. Food
-
3.2. Beverages
- 3.2.1. Alcoholic
- 3.2.2. Non-Alcoholic
- 3.3. Pharmaceuticals
- 3.4. Personal Care
- 3.5. Other End-User Industries
Metal Caps and Closures Industry Segmentation By Geography
- 1. North America
- 2. Europe
- 3. Asia
- 4. Australia and New Zealand
- 5. Latin America
- 6. Middle East and Africa
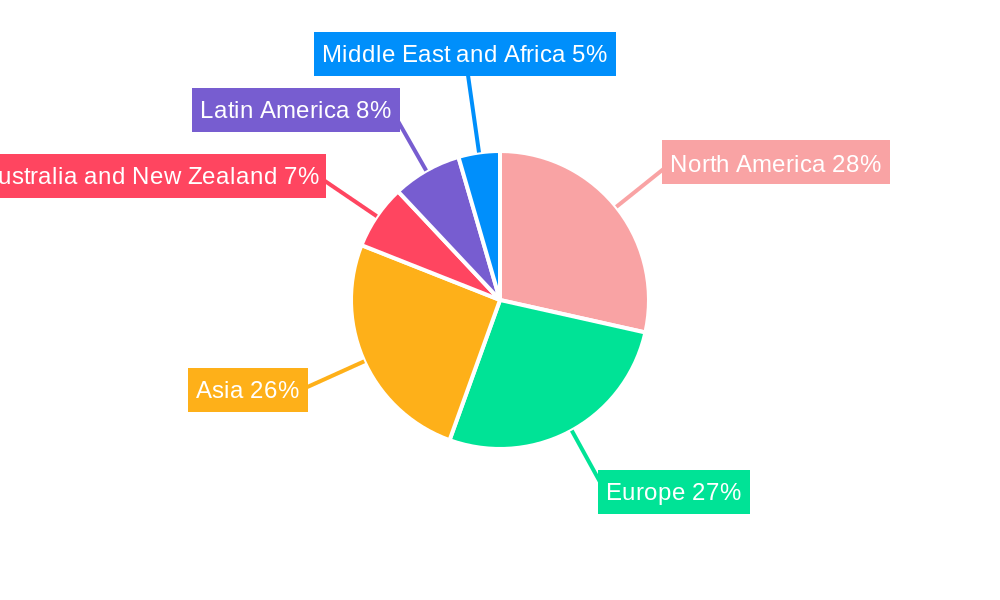
Metal Caps and Closures Industry Regional Market Share
Geographic Coverage of Metal Caps and Closures Industry
Metal Caps and Closures Industry REPORT HIGHLIGHTS
| Aspects | Details |
|---|---|
| Study Period | 2020-2034 |
| Base Year | 2025 |
| Estimated Year | 2026 |
| Forecast Period | 2026-2034 |
| Historical Period | 2020-2025 |
| Growth Rate | CAGR of 3.38% from 2020-2034 |
| Segmentation |
|
Table of Contents
- 1. Introduction
- 1.1. Research Scope
- 1.2. Market Segmentation
- 1.3. Research Objective
- 1.4. Definitions and Assumptions
- 2. Executive Summary
- 2.1. Market Snapshot
- 3. Market Dynamics
- 3.1. Market Drivers
- 3.2. Market Restrains
- 3.3. Market Trends
- 3.4. Market Opportunities
- 4. Market Factor Analysis
- 4.1. Porters Five Forces
- 4.1.1. Bargaining Power of Suppliers
- 4.1.2. Bargaining Power of Buyers
- 4.1.3. Threat of New Entrants
- 4.1.4. Threat of Substitutes
- 4.1.5. Competitive Rivalry
- 4.2. PESTEL analysis
- 4.3. BCG Analysis
- 4.3.1. Stars (High Growth, High Market Share)
- 4.3.2. Cash Cows (Low Growth, High Market Share)
- 4.3.3. Question Mark (High Growth, Low Market Share)
- 4.3.4. Dogs (Low Growth, Low Market Share)
- 4.4. Ansoff Matrix Analysis
- 4.5. Supply Chain Analysis
- 4.6. Regulatory Landscape
- 4.7. Current Market Potential and Opportunity Assessment (TAM–SAM–SOM Framework)
- 4.8. PRI Analyst Note
- 4.1. Porters Five Forces
- 5. Market Analysis, Insights and Forecast 2021-2033
- 5.1. Market Analysis, Insights and Forecast - by Material Type
- 5.1.1. Aluminium
- 5.1.2. Steel
- 5.1.3. Tin
- 5.2. Market Analysis, Insights and Forecast - by Closures Type
- 5.2.1. Crown Caps
- 5.2.2. Screw Caps
- 5.2.3. Twist Metal Caps
- 5.2.4. Other Cl
- 5.3. Market Analysis, Insights and Forecast - by End-User Industry
- 5.3.1. Food
- 5.3.2. Beverages
- 5.3.2.1. Alcoholic
- 5.3.2.2. Non-Alcoholic
- 5.3.3. Pharmaceuticals
- 5.3.4. Personal Care
- 5.3.5. Other End-User Industries
- 5.4. Market Analysis, Insights and Forecast - by Region
- 5.4.1. North America
- 5.4.2. Europe
- 5.4.3. Asia
- 5.4.4. Australia and New Zealand
- 5.4.5. Latin America
- 5.4.6. Middle East and Africa
- 5.1. Market Analysis, Insights and Forecast - by Material Type
- 6. Global Metal Caps and Closures Industry Analysis, Insights and Forecast, 2021-2033
- 6.1. Market Analysis, Insights and Forecast - by Material Type
- 6.1.1. Aluminium
- 6.1.2. Steel
- 6.1.3. Tin
- 6.2. Market Analysis, Insights and Forecast - by Closures Type
- 6.2.1. Crown Caps
- 6.2.2. Screw Caps
- 6.2.3. Twist Metal Caps
- 6.2.4. Other Cl
- 6.3. Market Analysis, Insights and Forecast - by End-User Industry
- 6.3.1. Food
- 6.3.2. Beverages
- 6.3.2.1. Alcoholic
- 6.3.2.2. Non-Alcoholic
- 6.3.3. Pharmaceuticals
- 6.3.4. Personal Care
- 6.3.5. Other End-User Industries
- 6.1. Market Analysis, Insights and Forecast - by Material Type
- 7. North America Metal Caps and Closures Industry Analysis, Insights and Forecast, 2020-2032
- 7.1. Market Analysis, Insights and Forecast - by Material Type
- 7.1.1. Aluminium
- 7.1.2. Steel
- 7.1.3. Tin
- 7.2. Market Analysis, Insights and Forecast - by Closures Type
- 7.2.1. Crown Caps
- 7.2.2. Screw Caps
- 7.2.3. Twist Metal Caps
- 7.2.4. Other Cl
- 7.3. Market Analysis, Insights and Forecast - by End-User Industry
- 7.3.1. Food
- 7.3.2. Beverages
- 7.3.2.1. Alcoholic
- 7.3.2.2. Non-Alcoholic
- 7.3.3. Pharmaceuticals
- 7.3.4. Personal Care
- 7.3.5. Other End-User Industries
- 7.1. Market Analysis, Insights and Forecast - by Material Type
- 8. Europe Metal Caps and Closures Industry Analysis, Insights and Forecast, 2020-2032
- 8.1. Market Analysis, Insights and Forecast - by Material Type
- 8.1.1. Aluminium
- 8.1.2. Steel
- 8.1.3. Tin
- 8.2. Market Analysis, Insights and Forecast - by Closures Type
- 8.2.1. Crown Caps
- 8.2.2. Screw Caps
- 8.2.3. Twist Metal Caps
- 8.2.4. Other Cl
- 8.3. Market Analysis, Insights and Forecast - by End-User Industry
- 8.3.1. Food
- 8.3.2. Beverages
- 8.3.2.1. Alcoholic
- 8.3.2.2. Non-Alcoholic
- 8.3.3. Pharmaceuticals
- 8.3.4. Personal Care
- 8.3.5. Other End-User Industries
- 8.1. Market Analysis, Insights and Forecast - by Material Type
- 9. Asia Metal Caps and Closures Industry Analysis, Insights and Forecast, 2020-2032
- 9.1. Market Analysis, Insights and Forecast - by Material Type
- 9.1.1. Aluminium
- 9.1.2. Steel
- 9.1.3. Tin
- 9.2. Market Analysis, Insights and Forecast - by Closures Type
- 9.2.1. Crown Caps
- 9.2.2. Screw Caps
- 9.2.3. Twist Metal Caps
- 9.2.4. Other Cl
- 9.3. Market Analysis, Insights and Forecast - by End-User Industry
- 9.3.1. Food
- 9.3.2. Beverages
- 9.3.2.1. Alcoholic
- 9.3.2.2. Non-Alcoholic
- 9.3.3. Pharmaceuticals
- 9.3.4. Personal Care
- 9.3.5. Other End-User Industries
- 9.1. Market Analysis, Insights and Forecast - by Material Type
- 10. Australia and New Zealand Metal Caps and Closures Industry Analysis, Insights and Forecast, 2020-2032
- 10.1. Market Analysis, Insights and Forecast - by Material Type
- 10.1.1. Aluminium
- 10.1.2. Steel
- 10.1.3. Tin
- 10.2. Market Analysis, Insights and Forecast - by Closures Type
- 10.2.1. Crown Caps
- 10.2.2. Screw Caps
- 10.2.3. Twist Metal Caps
- 10.2.4. Other Cl
- 10.3. Market Analysis, Insights and Forecast - by End-User Industry
- 10.3.1. Food
- 10.3.2. Beverages
- 10.3.2.1. Alcoholic
- 10.3.2.2. Non-Alcoholic
- 10.3.3. Pharmaceuticals
- 10.3.4. Personal Care
- 10.3.5. Other End-User Industries
- 10.1. Market Analysis, Insights and Forecast - by Material Type
- 11. Latin America Metal Caps and Closures Industry Analysis, Insights and Forecast, 2020-2032
- 11.1. Market Analysis, Insights and Forecast - by Material Type
- 11.1.1. Aluminium
- 11.1.2. Steel
- 11.1.3. Tin
- 11.2. Market Analysis, Insights and Forecast - by Closures Type
- 11.2.1. Crown Caps
- 11.2.2. Screw Caps
- 11.2.3. Twist Metal Caps
- 11.2.4. Other Cl
- 11.3. Market Analysis, Insights and Forecast - by End-User Industry
- 11.3.1. Food
- 11.3.2. Beverages
- 11.3.2.1. Alcoholic
- 11.3.2.2. Non-Alcoholic
- 11.3.3. Pharmaceuticals
- 11.3.4. Personal Care
- 11.3.5. Other End-User Industries
- 11.1. Market Analysis, Insights and Forecast - by Material Type
- 12. Middle East and Africa Metal Caps and Closures Industry Analysis, Insights and Forecast, 2020-2032
- 12.1. Market Analysis, Insights and Forecast - by Material Type
- 12.1.1. Aluminium
- 12.1.2. Steel
- 12.1.3. Tin
- 12.2. Market Analysis, Insights and Forecast - by Closures Type
- 12.2.1. Crown Caps
- 12.2.2. Screw Caps
- 12.2.3. Twist Metal Caps
- 12.2.4. Other Cl
- 12.3. Market Analysis, Insights and Forecast - by End-User Industry
- 12.3.1. Food
- 12.3.2. Beverages
- 12.3.2.1. Alcoholic
- 12.3.2.2. Non-Alcoholic
- 12.3.3. Pharmaceuticals
- 12.3.4. Personal Care
- 12.3.5. Other End-User Industries
- 12.1. Market Analysis, Insights and Forecast - by Material Type
- 13. Competitive Analysis
- 13.1. Company Profiles
- 13.1.1 Closure Systems International Inc (CSI)*List Not Exhaustive
- 13.1.1.1. Company Overview
- 13.1.1.2. Products
- 13.1.1.3. Company Financials
- 13.1.1.4. SWOT Analysis
- 13.1.2 Qorpak (Berlin Packaging)
- 13.1.2.1. Company Overview
- 13.1.2.2. Products
- 13.1.2.3. Company Financials
- 13.1.2.4. SWOT Analysis
- 13.1.3 Guala Closures S P A
- 13.1.3.1. Company Overview
- 13.1.3.2. Products
- 13.1.3.3. Company Financials
- 13.1.3.4. SWOT Analysis
- 13.1.4 Crown Holdings Inc
- 13.1.4.1. Company Overview
- 13.1.4.2. Products
- 13.1.4.3. Company Financials
- 13.1.4.4. SWOT Analysis
- 13.1.5 Nippon Closures Co Ltd
- 13.1.5.1. Company Overview
- 13.1.5.2. Products
- 13.1.5.3. Company Financials
- 13.1.5.4. SWOT Analysis
- 13.1.6 Amcor PLC
- 13.1.6.1. Company Overview
- 13.1.6.2. Products
- 13.1.6.3. Company Financials
- 13.1.6.4. SWOT Analysis
- 13.1.7 Pelliconi & C SpA
- 13.1.7.1. Company Overview
- 13.1.7.2. Products
- 13.1.7.3. Company Financials
- 13.1.7.4. SWOT Analysis
- 13.1.8 Sks Bottle & Packaging Inc
- 13.1.8.1. Company Overview
- 13.1.8.2. Products
- 13.1.8.3. Company Financials
- 13.1.8.4. SWOT Analysis
- 13.1.9 Alameda Packaging LLC
- 13.1.9.1. Company Overview
- 13.1.9.2. Products
- 13.1.9.3. Company Financials
- 13.1.9.4. SWOT Analysis
- 13.1.10 Silgan White Cap LLC
- 13.1.10.1. Company Overview
- 13.1.10.2. Products
- 13.1.10.3. Company Financials
- 13.1.10.4. SWOT Analysis
- 13.1.11 O Berk Company
- 13.1.11.1. Company Overview
- 13.1.11.2. Products
- 13.1.11.3. Company Financials
- 13.1.11.4. SWOT Analysis
- 13.1.1 Closure Systems International Inc (CSI)*List Not Exhaustive
- 13.2. Market Entropy
- 13.2.1 Company's Key Areas Served
- 13.2.2 Recent Developments
- 13.3. Company Market Share Analysis 2025
- 13.3.1 Top 5 Companies Market Share Analysis
- 13.3.2 Top 3 Companies Market Share Analysis
- 13.4. List of Potential Customers
- 14. Research Methodology
List of Figures
- Figure 1: Global Metal Caps and Closures Industry Revenue Breakdown (Million, %) by Region 2025 & 2033
- Figure 2: North America Metal Caps and Closures Industry Revenue (Million), by Material Type 2025 & 2033
- Figure 3: North America Metal Caps and Closures Industry Revenue Share (%), by Material Type 2025 & 2033
- Figure 4: North America Metal Caps and Closures Industry Revenue (Million), by Closures Type 2025 & 2033
- Figure 5: North America Metal Caps and Closures Industry Revenue Share (%), by Closures Type 2025 & 2033
- Figure 6: North America Metal Caps and Closures Industry Revenue (Million), by End-User Industry 2025 & 2033
- Figure 7: North America Metal Caps and Closures Industry Revenue Share (%), by End-User Industry 2025 & 2033
- Figure 8: North America Metal Caps and Closures Industry Revenue (Million), by Country 2025 & 2033
- Figure 9: North America Metal Caps and Closures Industry Revenue Share (%), by Country 2025 & 2033
- Figure 10: Europe Metal Caps and Closures Industry Revenue (Million), by Material Type 2025 & 2033
- Figure 11: Europe Metal Caps and Closures Industry Revenue Share (%), by Material Type 2025 & 2033
- Figure 12: Europe Metal Caps and Closures Industry Revenue (Million), by Closures Type 2025 & 2033
- Figure 13: Europe Metal Caps and Closures Industry Revenue Share (%), by Closures Type 2025 & 2033
- Figure 14: Europe Metal Caps and Closures Industry Revenue (Million), by End-User Industry 2025 & 2033
- Figure 15: Europe Metal Caps and Closures Industry Revenue Share (%), by End-User Industry 2025 & 2033
- Figure 16: Europe Metal Caps and Closures Industry Revenue (Million), by Country 2025 & 2033
- Figure 17: Europe Metal Caps and Closures Industry Revenue Share (%), by Country 2025 & 2033
- Figure 18: Asia Metal Caps and Closures Industry Revenue (Million), by Material Type 2025 & 2033
- Figure 19: Asia Metal Caps and Closures Industry Revenue Share (%), by Material Type 2025 & 2033
- Figure 20: Asia Metal Caps and Closures Industry Revenue (Million), by Closures Type 2025 & 2033
- Figure 21: Asia Metal Caps and Closures Industry Revenue Share (%), by Closures Type 2025 & 2033
- Figure 22: Asia Metal Caps and Closures Industry Revenue (Million), by End-User Industry 2025 & 2033
- Figure 23: Asia Metal Caps and Closures Industry Revenue Share (%), by End-User Industry 2025 & 2033
- Figure 24: Asia Metal Caps and Closures Industry Revenue (Million), by Country 2025 & 2033
- Figure 25: Asia Metal Caps and Closures Industry Revenue Share (%), by Country 2025 & 2033
- Figure 26: Australia and New Zealand Metal Caps and Closures Industry Revenue (Million), by Material Type 2025 & 2033
- Figure 27: Australia and New Zealand Metal Caps and Closures Industry Revenue Share (%), by Material Type 2025 & 2033
- Figure 28: Australia and New Zealand Metal Caps and Closures Industry Revenue (Million), by Closures Type 2025 & 2033
- Figure 29: Australia and New Zealand Metal Caps and Closures Industry Revenue Share (%), by Closures Type 2025 & 2033
- Figure 30: Australia and New Zealand Metal Caps and Closures Industry Revenue (Million), by End-User Industry 2025 & 2033
- Figure 31: Australia and New Zealand Metal Caps and Closures Industry Revenue Share (%), by End-User Industry 2025 & 2033
- Figure 32: Australia and New Zealand Metal Caps and Closures Industry Revenue (Million), by Country 2025 & 2033
- Figure 33: Australia and New Zealand Metal Caps and Closures Industry Revenue Share (%), by Country 2025 & 2033
- Figure 34: Latin America Metal Caps and Closures Industry Revenue (Million), by Material Type 2025 & 2033
- Figure 35: Latin America Metal Caps and Closures Industry Revenue Share (%), by Material Type 2025 & 2033
- Figure 36: Latin America Metal Caps and Closures Industry Revenue (Million), by Closures Type 2025 & 2033
- Figure 37: Latin America Metal Caps and Closures Industry Revenue Share (%), by Closures Type 2025 & 2033
- Figure 38: Latin America Metal Caps and Closures Industry Revenue (Million), by End-User Industry 2025 & 2033
- Figure 39: Latin America Metal Caps and Closures Industry Revenue Share (%), by End-User Industry 2025 & 2033
- Figure 40: Latin America Metal Caps and Closures Industry Revenue (Million), by Country 2025 & 2033
- Figure 41: Latin America Metal Caps and Closures Industry Revenue Share (%), by Country 2025 & 2033
- Figure 42: Middle East and Africa Metal Caps and Closures Industry Revenue (Million), by Material Type 2025 & 2033
- Figure 43: Middle East and Africa Metal Caps and Closures Industry Revenue Share (%), by Material Type 2025 & 2033
- Figure 44: Middle East and Africa Metal Caps and Closures Industry Revenue (Million), by Closures Type 2025 & 2033
- Figure 45: Middle East and Africa Metal Caps and Closures Industry Revenue Share (%), by Closures Type 2025 & 2033
- Figure 46: Middle East and Africa Metal Caps and Closures Industry Revenue (Million), by End-User Industry 2025 & 2033
- Figure 47: Middle East and Africa Metal Caps and Closures Industry Revenue Share (%), by End-User Industry 2025 & 2033
- Figure 48: Middle East and Africa Metal Caps and Closures Industry Revenue (Million), by Country 2025 & 2033
- Figure 49: Middle East and Africa Metal Caps and Closures Industry Revenue Share (%), by Country 2025 & 2033
List of Tables
- Table 1: Global Metal Caps and Closures Industry Revenue Million Forecast, by Material Type 2020 & 2033
- Table 2: Global Metal Caps and Closures Industry Revenue Million Forecast, by Closures Type 2020 & 2033
- Table 3: Global Metal Caps and Closures Industry Revenue Million Forecast, by End-User Industry 2020 & 2033
- Table 4: Global Metal Caps and Closures Industry Revenue Million Forecast, by Region 2020 & 2033
- Table 5: Global Metal Caps and Closures Industry Revenue Million Forecast, by Material Type 2020 & 2033
- Table 6: Global Metal Caps and Closures Industry Revenue Million Forecast, by Closures Type 2020 & 2033
- Table 7: Global Metal Caps and Closures Industry Revenue Million Forecast, by End-User Industry 2020 & 2033
- Table 8: Global Metal Caps and Closures Industry Revenue Million Forecast, by Country 2020 & 2033
- Table 9: Global Metal Caps and Closures Industry Revenue Million Forecast, by Material Type 2020 & 2033
- Table 10: Global Metal Caps and Closures Industry Revenue Million Forecast, by Closures Type 2020 & 2033
- Table 11: Global Metal Caps and Closures Industry Revenue Million Forecast, by End-User Industry 2020 & 2033
- Table 12: Global Metal Caps and Closures Industry Revenue Million Forecast, by Country 2020 & 2033
- Table 13: Global Metal Caps and Closures Industry Revenue Million Forecast, by Material Type 2020 & 2033
- Table 14: Global Metal Caps and Closures Industry Revenue Million Forecast, by Closures Type 2020 & 2033
- Table 15: Global Metal Caps and Closures Industry Revenue Million Forecast, by End-User Industry 2020 & 2033
- Table 16: Global Metal Caps and Closures Industry Revenue Million Forecast, by Country 2020 & 2033
- Table 17: Global Metal Caps and Closures Industry Revenue Million Forecast, by Material Type 2020 & 2033
- Table 18: Global Metal Caps and Closures Industry Revenue Million Forecast, by Closures Type 2020 & 2033
- Table 19: Global Metal Caps and Closures Industry Revenue Million Forecast, by End-User Industry 2020 & 2033
- Table 20: Global Metal Caps and Closures Industry Revenue Million Forecast, by Country 2020 & 2033
- Table 21: Global Metal Caps and Closures Industry Revenue Million Forecast, by Material Type 2020 & 2033
- Table 22: Global Metal Caps and Closures Industry Revenue Million Forecast, by Closures Type 2020 & 2033
- Table 23: Global Metal Caps and Closures Industry Revenue Million Forecast, by End-User Industry 2020 & 2033
- Table 24: Global Metal Caps and Closures Industry Revenue Million Forecast, by Country 2020 & 2033
- Table 25: Global Metal Caps and Closures Industry Revenue Million Forecast, by Material Type 2020 & 2033
- Table 26: Global Metal Caps and Closures Industry Revenue Million Forecast, by Closures Type 2020 & 2033
- Table 27: Global Metal Caps and Closures Industry Revenue Million Forecast, by End-User Industry 2020 & 2033
- Table 28: Global Metal Caps and Closures Industry Revenue Million Forecast, by Country 2020 & 2033
Frequently Asked Questions
1. What is the projected Compound Annual Growth Rate (CAGR) of the Metal Caps and Closures Industry?
The projected CAGR is approximately 3.38%.
2. Which companies are prominent players in the Metal Caps and Closures Industry?
Key companies in the market include Closure Systems International Inc (CSI)*List Not Exhaustive, Qorpak (Berlin Packaging), Guala Closures S P A, Crown Holdings Inc, Nippon Closures Co Ltd, Amcor PLC, Pelliconi & C SpA, Sks Bottle & Packaging Inc, Alameda Packaging LLC, Silgan White Cap LLC, O Berk Company.
3. What are the main segments of the Metal Caps and Closures Industry?
The market segments include Material Type, Closures Type, End-User Industry.
4. Can you provide details about the market size?
The market size is estimated to be USD 24.57 Million as of 2022.
5. What are some drivers contributing to market growth?
Increasing Consumption of Beverages with a Rising Need for Sustainable Packaging Materials; Superior Properties Compared to Other Closure Materials.
6. What are the notable trends driving market growth?
Pharmaceutical Application Offers Potential Growth.
7. Are there any restraints impacting market growth?
High Adoption Rate of Other Types of Closure Materials.
8. Can you provide examples of recent developments in the market?
January 2023: Guala Closures Group, a prominent manufacturer of aluminum and specialty closures, received validation from the Science Based Targets Initiative (SBTi) for its 2030 Greenhouse Gas (GHG) emission targets. The targets have been recognized as meeting the ambitious 1.5°C goal, which is a significant milestone in the group's sustainability journey. The company has pledged to reduce absolute scope 1 and 2 GHG emissions by 44% by 2030, based on a 2020 starting point, by adopting science-based targets.
9. What pricing options are available for accessing the report?
Pricing options include single-user, multi-user, and enterprise licenses priced at USD 4750, USD 5250, and USD 8750 respectively.
10. Is the market size provided in terms of value or volume?
The market size is provided in terms of value, measured in Million.
11. Are there any specific market keywords associated with the report?
Yes, the market keyword associated with the report is "Metal Caps and Closures Industry," which aids in identifying and referencing the specific market segment covered.
12. How do I determine which pricing option suits my needs best?
The pricing options vary based on user requirements and access needs. Individual users may opt for single-user licenses, while businesses requiring broader access may choose multi-user or enterprise licenses for cost-effective access to the report.
13. Are there any additional resources or data provided in the Metal Caps and Closures Industry report?
While the report offers comprehensive insights, it's advisable to review the specific contents or supplementary materials provided to ascertain if additional resources or data are available.
14. How can I stay updated on further developments or reports in the Metal Caps and Closures Industry?
To stay informed about further developments, trends, and reports in the Metal Caps and Closures Industry, consider subscribing to industry newsletters, following relevant companies and organizations, or regularly checking reputable industry news sources and publications.
Methodology
Step 1 - Identification of Relevant Samples Size from Population Database


Step 2 - Approaches for Defining Global Market Size (Value, Volume* & Price*)

Note*: In applicable scenarios
Step 3 - Data Sources
Primary Research
- Web Analytics
- Survey Reports
- Research Institute
- Latest Research Reports
- Opinion Leaders
Secondary Research
- Annual Reports
- White Paper
- Latest Press Release
- Industry Association
- Paid Database
- Investor Presentations

Step 4 - Data Triangulation
Involves using different sources of information in order to increase the validity of a study
These sources are likely to be stakeholders in a program - participants, other researchers, program staff, other community members, and so on.
Then we put all data in single framework & apply various statistical tools to find out the dynamic on the market.
During the analysis stage, feedback from the stakeholder groups would be compared to determine areas of agreement as well as areas of divergence