
Key Insights
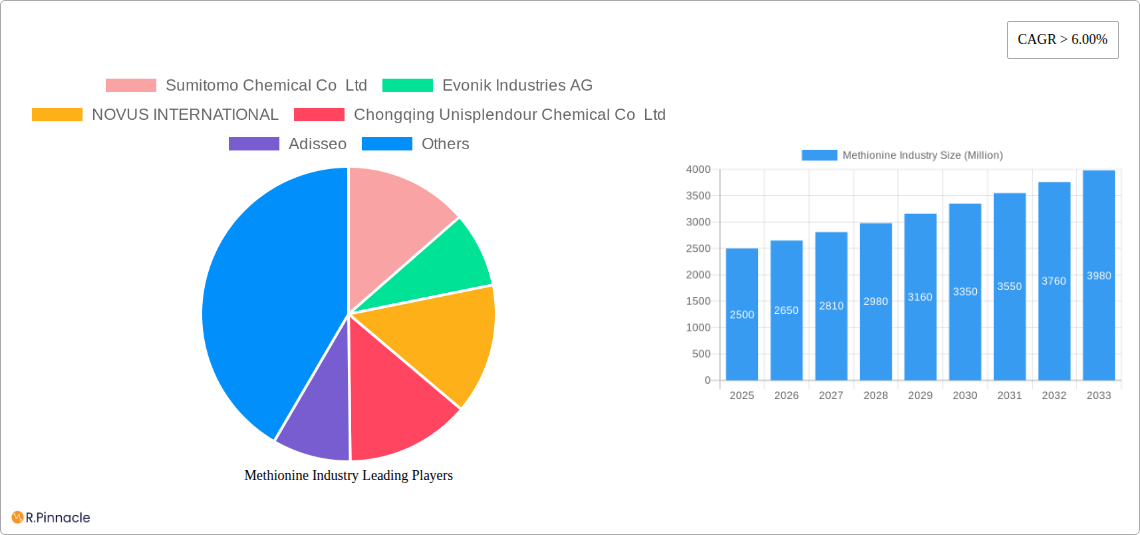
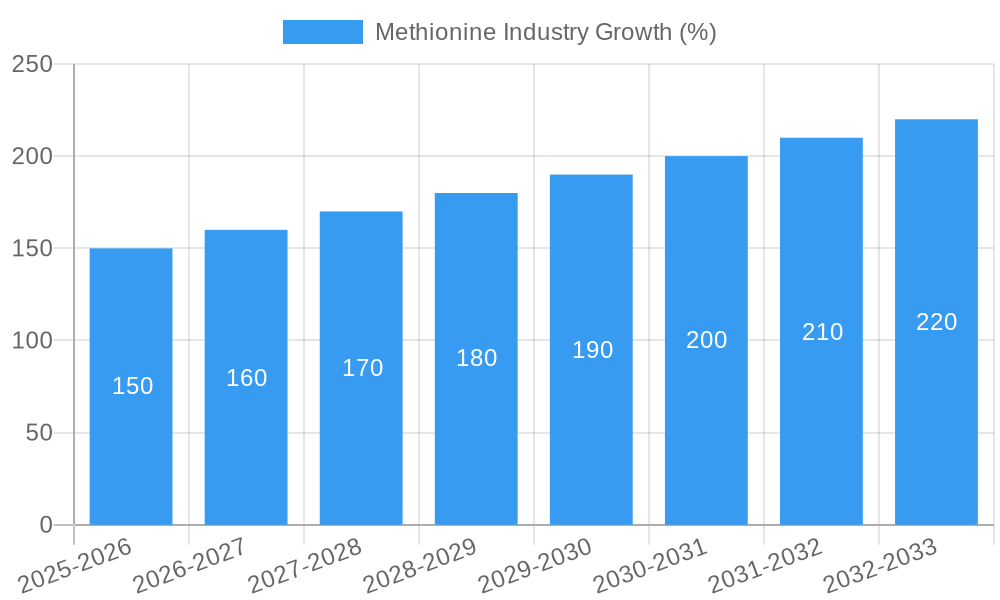
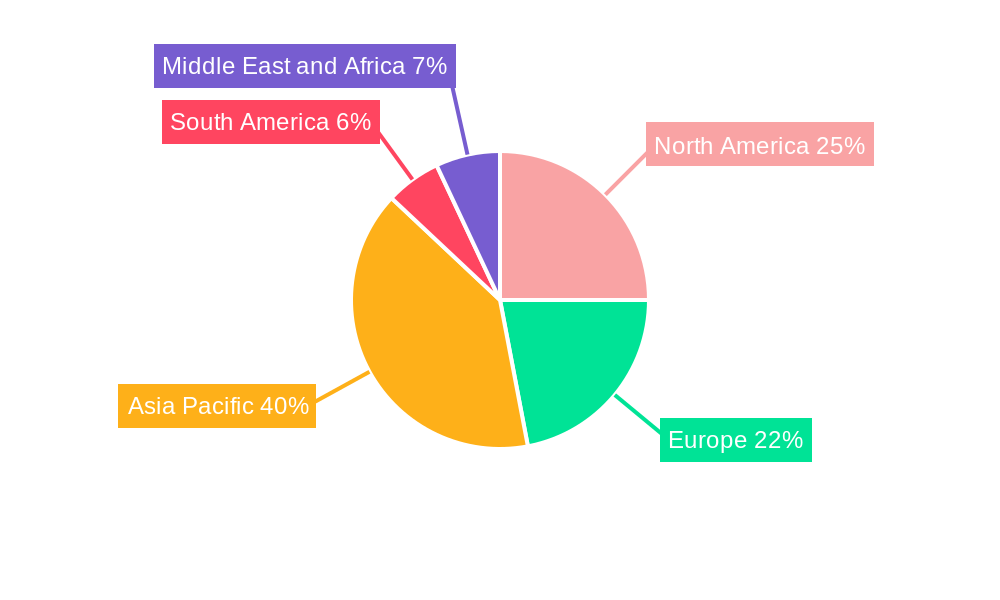
The global methionine market is experiencing robust growth, driven by the expanding animal feed industry, particularly in developing economies with rising protein consumption. A compound annual growth rate (CAGR) exceeding 6% from 2019 to 2033 indicates a significant expansion of market size. This growth is fueled by increasing demand for poultry and swine products, which rely heavily on methionine supplementation for optimal animal health and productivity. The market is segmented by end-user industry (food and beverage, pharmaceutical, animal feed, other industries) and type (liquid, powder), with the animal feed segment dominating. Major players like Sumitomo Chemical, Evonik Industries, and Adisseo are driving innovation and consolidation within the market, offering a range of products to cater to the evolving needs of customers. Geographic expansion is also a key factor, with Asia-Pacific, particularly China and India, exhibiting strong growth due to rapid industrialization and rising disposable incomes. While regulatory changes and raw material price fluctuations pose potential restraints, the long-term outlook for the methionine market remains positive, largely driven by consistent demand from the burgeoning animal protein sector.
Growth in the liquid methionine segment is expected to outpace that of the powder segment due to its ease of handling and integration into feed formulations. The increasing adoption of precision feeding techniques to optimize livestock nutrition further fuels market demand. North America and Europe, while mature markets, will continue to contribute significantly, with focus shifting towards sustainable and environmentally friendly methionine production methods. Emerging markets in South America, the Middle East, and Africa present promising opportunities for expansion, although infrastructure development and economic factors will influence market penetration in these regions. Competition is intense, with established players focusing on product diversification, strategic partnerships, and expansion into new markets to maintain their market share. Future growth will depend on technological advancements in methionine production, greater focus on improving feed efficiency, and a continued rise in global meat consumption.
Methionine Industry Market Report: 2019-2033
This comprehensive report provides a detailed analysis of the global methionine industry, offering invaluable insights for industry professionals, investors, and stakeholders. Covering the period from 2019 to 2033, with a base year of 2025, this report presents a thorough examination of market dynamics, competitive landscape, and future growth prospects. The report leverages extensive market research and data analysis to provide actionable intelligence, helping businesses make informed decisions and capitalize on emerging opportunities.
Methionine Industry Market Structure & Innovation Trends
The global methionine market exhibits a moderately concentrated structure, with key players such as Sumitomo Chemical Co Ltd, Evonik Industries AG, NOVUS INTERNATIONAL, and Adisseo holding significant market share. Market concentration is influenced by economies of scale in production and significant R&D investments. Innovation within the industry focuses on enhancing production efficiency, developing sustainable manufacturing processes, and creating value-added products catering to specific end-user needs. Regulatory frameworks, particularly concerning environmental regulations and food safety standards, play a significant role in shaping industry practices. Product substitutes, though limited, include alternative amino acid sources, impacting market competition. M&A activities have been observed, with deal values varying considerably depending on the size and strategic importance of the acquired company. For instance, Evonik's USD 176.5 Million investment showcases significant expansion activity. Further analysis of M&A activities reveals a xx% increase in deal volume between 2021 and 2024, suggesting a consolidating market.
Methionine Industry Market Dynamics & Trends
The global methionine market is projected to experience substantial growth during the forecast period (2025-2033), driven by increasing demand from the animal feed industry, particularly in developing economies. This growth is fueled by rising global meat consumption and expanding livestock populations. Technological advancements in production processes, leading to improved efficiency and reduced costs, are also significant drivers. Consumer preferences towards high-quality protein sources, coupled with stringent food safety regulations, are further boosting market growth. Competitive dynamics are characterized by intense rivalry among major players, focusing on capacity expansion, product innovation, and strategic partnerships. The CAGR for the period is estimated at xx%, with market penetration in key regions expected to increase by xx% by 2033.
Dominant Regions & Segments in Methionine Industry
The Asia-Pacific region dominates the global methionine market, driven by robust growth in the animal feed sector and substantial investments in livestock production. Within this region, China stands out as a key driver, owing to its large and expanding livestock industry and supportive government policies.
Key Drivers in Asia-Pacific:
- Rapid growth of animal feed industry.
- Rising meat consumption.
- Government support for livestock farming.
- Expanding middle class, increasing demand for meat-based products.
Dominant End-User Industries: Animal feed holds the largest market share, followed by the pharmaceutical and food and beverage sectors. The dominance of the animal feed segment is primarily attributed to the crucial role of methionine in animal nutrition, improving feed efficiency, and enhancing livestock productivity. The powder form of methionine holds a larger market share than the liquid form.
Key Drivers in Animal Feed Segment: Growing global demand for meat and dairy products, increased awareness about animal nutrition, and technological advancements in feed formulation.
Methionine Industry Product Innovations
Recent innovations in the methionine industry have focused on developing more efficient and sustainable production methods, including utilizing renewable energy sources and implementing closed-loop recycling systems. The introduction of liquid methionine, as exemplified by Adisseo's expansion, provides additional benefits in terms of handling and application in animal feed formulations. These developments are enhancing product quality and increasing market competitiveness.
Report Scope & Segmentation Analysis
This report segments the methionine market by end-user industry (Food and Beverage, Pharmaceutical, Animal Feed, Other End-user Industries) and product type (Liquid, Powder). The Animal Feed segment is expected to witness significant growth throughout the forecast period driven by the rising global meat consumption and expanding livestock industry. The Pharmaceutical and Food and Beverage sectors are also projected to display steady growth. In terms of product type, the Powder segment currently holds a larger market share, although Liquid Methionine is projected to gain traction owing to its ease of handling and application in certain applications. Market sizes for each segment are detailed in the complete report, along with growth projections and competitive analysis.
Key Drivers of Methionine Industry Growth
The growth of the methionine industry is propelled by several factors: Firstly, the expanding global demand for animal protein sources necessitates increased methionine production to satisfy the needs of the growing animal feed industry. Secondly, advancements in biotechnology and production technologies lead to greater efficiency and cost reductions. Finally, stringent regulations surrounding animal health and nutrition are driving the demand for high-quality methionine products.
Challenges in the Methionine Industry Sector
The methionine industry faces challenges like fluctuations in raw material prices and supply chain disruptions affecting production costs and availability. Moreover, stringent environmental regulations related to emissions and waste management create additional operational complexities. Intense competition among established players also puts pressure on profit margins.
Emerging Opportunities in Methionine Industry
The methionine industry presents promising opportunities in exploring new applications in specialty feed formulations and functional foods. The rising demand for sustainable and eco-friendly production processes also presents a significant opportunity for innovation and market expansion. Exploring emerging markets in developing economies offers considerable growth potential.
Leading Players in the Methionine Industry Market
- Sumitomo Chemical Co Ltd
- Evonik Industries AG
- NOVUS INTERNATIONAL
- Chongqing Unisplendour Chemical Co Ltd
- Adisseo
- Volzhsky Orgsynthese JSC
- Zhejiang NHU Co Ltd
- CJ CheilJedang Corp
Key Developments in Methionine Industry
- September 2022: Adisseo commissioned its new 180,000-ton liquid methionine production plant in Nanjing, China, effectively doubling its global capacity to 350,000 tons. This significantly strengthens Adisseo's market position.
- March 2022: Evonik announced a USD 176.5 Million expansion project at its Theodore, Alabama facility, focused on increasing methyl mercaptan production to support its MetAmino (DL-methionine) output. This underscores Evonik's commitment to expanding its animal nutrition portfolio.
Future Outlook for Methionine Industry Market
The future of the methionine market appears bright, driven by sustained growth in the animal feed sector, particularly in developing economies. Continued innovation in production processes, coupled with strategic partnerships and investments in capacity expansion, will play a crucial role in shaping the industry's trajectory. The increasing focus on sustainable and environmentally friendly production methods presents further opportunities for growth and market differentiation.
Methionine Industry Segmentation
-
1. Type
- 1.1. Liquid
- 1.2. Powder
-
2. End-user Industry
- 2.1. Food and Beverage
- 2.2. Pharmaceutical
- 2.3. Animal Feed
- 2.4. Other End-user Industries
Methionine Industry Segmentation By Geography
-
1. Asia Pacific
- 1.1. China
- 1.2. India
- 1.3. Japan
- 1.4. South Korea
- 1.5. Rest of Asia Pacific
-
2. North America
- 2.1. United States
- 2.2. Canada
- 2.3. Mexico
-
3. Europe
- 3.1. Germany
- 3.2. United Kingdom
- 3.3. Italy
- 3.4. France
- 3.5. Rest of Europe
-
4. South America
- 4.1. Brazil
- 4.2. Argentina
- 4.3. Rest of South America
-
5. Middle East and Africa
- 5.1. Saudi Arabia
- 5.2. South Africa
- 5.3. Rest of Middle East and Africa
Methionine Industry REPORT HIGHLIGHTS
| Aspects | Details |
|---|---|
| Study Period | 2019-2033 |
| Base Year | 2024 |
| Estimated Year | 2025 |
| Forecast Period | 2025-2033 |
| Historical Period | 2019-2024 |
| Growth Rate | CAGR of > 6.00% from 2019-2033 |
| Segmentation |
|
Table of Contents
- 1. Introduction
- 1.1. Research Scope
- 1.2. Market Segmentation
- 1.3. Research Methodology
- 1.4. Definitions and Assumptions
- 2. Executive Summary
- 2.1. Introduction
- 3. Market Dynamics
- 3.1. Introduction
- 3.2. Market Drivers
- 3.2.1. Growing Demand from the Poultry Industry; Emerging Demand from the Aquaculture Industry
- 3.3. Market Restrains
- 3.3.1. Complex Process of Manufacturing Methionine
- 3.4. Market Trends
- 3.4.1. Increasing Demand from the Animal Feed Segment
- 4. Market Factor Analysis
- 4.1. Porters Five Forces
- 4.2. Supply/Value Chain
- 4.3. PESTEL analysis
- 4.4. Market Entropy
- 4.5. Patent/Trademark Analysis
- 5. Global Methionine Industry Analysis, Insights and Forecast, 2019-2031
- 5.1. Market Analysis, Insights and Forecast - by Type
- 5.1.1. Liquid
- 5.1.2. Powder
- 5.2. Market Analysis, Insights and Forecast - by End-user Industry
- 5.2.1. Food and Beverage
- 5.2.2. Pharmaceutical
- 5.2.3. Animal Feed
- 5.2.4. Other End-user Industries
- 5.3. Market Analysis, Insights and Forecast - by Region
- 5.3.1. Asia Pacific
- 5.3.2. North America
- 5.3.3. Europe
- 5.3.4. South America
- 5.3.5. Middle East and Africa
- 5.1. Market Analysis, Insights and Forecast - by Type
- 6. Asia Pacific Methionine Industry Analysis, Insights and Forecast, 2019-2031
- 6.1. Market Analysis, Insights and Forecast - by Type
- 6.1.1. Liquid
- 6.1.2. Powder
- 6.2. Market Analysis, Insights and Forecast - by End-user Industry
- 6.2.1. Food and Beverage
- 6.2.2. Pharmaceutical
- 6.2.3. Animal Feed
- 6.2.4. Other End-user Industries
- 6.1. Market Analysis, Insights and Forecast - by Type
- 7. North America Methionine Industry Analysis, Insights and Forecast, 2019-2031
- 7.1. Market Analysis, Insights and Forecast - by Type
- 7.1.1. Liquid
- 7.1.2. Powder
- 7.2. Market Analysis, Insights and Forecast - by End-user Industry
- 7.2.1. Food and Beverage
- 7.2.2. Pharmaceutical
- 7.2.3. Animal Feed
- 7.2.4. Other End-user Industries
- 7.1. Market Analysis, Insights and Forecast - by Type
- 8. Europe Methionine Industry Analysis, Insights and Forecast, 2019-2031
- 8.1. Market Analysis, Insights and Forecast - by Type
- 8.1.1. Liquid
- 8.1.2. Powder
- 8.2. Market Analysis, Insights and Forecast - by End-user Industry
- 8.2.1. Food and Beverage
- 8.2.2. Pharmaceutical
- 8.2.3. Animal Feed
- 8.2.4. Other End-user Industries
- 8.1. Market Analysis, Insights and Forecast - by Type
- 9. South America Methionine Industry Analysis, Insights and Forecast, 2019-2031
- 9.1. Market Analysis, Insights and Forecast - by Type
- 9.1.1. Liquid
- 9.1.2. Powder
- 9.2. Market Analysis, Insights and Forecast - by End-user Industry
- 9.2.1. Food and Beverage
- 9.2.2. Pharmaceutical
- 9.2.3. Animal Feed
- 9.2.4. Other End-user Industries
- 9.1. Market Analysis, Insights and Forecast - by Type
- 10. Middle East and Africa Methionine Industry Analysis, Insights and Forecast, 2019-2031
- 10.1. Market Analysis, Insights and Forecast - by Type
- 10.1.1. Liquid
- 10.1.2. Powder
- 10.2. Market Analysis, Insights and Forecast - by End-user Industry
- 10.2.1. Food and Beverage
- 10.2.2. Pharmaceutical
- 10.2.3. Animal Feed
- 10.2.4. Other End-user Industries
- 10.1. Market Analysis, Insights and Forecast - by Type
- 11. Asia Pacific Methionine Industry Analysis, Insights and Forecast, 2019-2031
- 11.1. Market Analysis, Insights and Forecast - By Country/Sub-region
- 11.1.1 China
- 11.1.2 India
- 11.1.3 Japan
- 11.1.4 South Korea
- 11.1.5 Rest of Asia Pacific
- 12. North America Methionine Industry Analysis, Insights and Forecast, 2019-2031
- 12.1. Market Analysis, Insights and Forecast - By Country/Sub-region
- 12.1.1 United States
- 12.1.2 Canada
- 12.1.3 Mexico
- 13. Europe Methionine Industry Analysis, Insights and Forecast, 2019-2031
- 13.1. Market Analysis, Insights and Forecast - By Country/Sub-region
- 13.1.1 Germany
- 13.1.2 United Kingdom
- 13.1.3 Italy
- 13.1.4 France
- 13.1.5 Rest of Europe
- 14. South America Methionine Industry Analysis, Insights and Forecast, 2019-2031
- 14.1. Market Analysis, Insights and Forecast - By Country/Sub-region
- 14.1.1 Brazil
- 14.1.2 Argentina
- 14.1.3 Rest of South America
- 15. Middle East and Africa Methionine Industry Analysis, Insights and Forecast, 2019-2031
- 15.1. Market Analysis, Insights and Forecast - By Country/Sub-region
- 15.1.1 Saudi Arabia
- 15.1.2 South Africa
- 15.1.3 Rest of Middle East and Africa
- 16. Competitive Analysis
- 16.1. Global Market Share Analysis 2024
- 16.2. Company Profiles
- 16.2.1 Sumitomo Chemical Co Ltd
- 16.2.1.1. Overview
- 16.2.1.2. Products
- 16.2.1.3. SWOT Analysis
- 16.2.1.4. Recent Developments
- 16.2.1.5. Financials (Based on Availability)
- 16.2.2 Evonik Industries AG
- 16.2.2.1. Overview
- 16.2.2.2. Products
- 16.2.2.3. SWOT Analysis
- 16.2.2.4. Recent Developments
- 16.2.2.5. Financials (Based on Availability)
- 16.2.3 NOVUS INTERNATIONAL
- 16.2.3.1. Overview
- 16.2.3.2. Products
- 16.2.3.3. SWOT Analysis
- 16.2.3.4. Recent Developments
- 16.2.3.5. Financials (Based on Availability)
- 16.2.4 Chongqing Unisplendour Chemical Co Ltd
- 16.2.4.1. Overview
- 16.2.4.2. Products
- 16.2.4.3. SWOT Analysis
- 16.2.4.4. Recent Developments
- 16.2.4.5. Financials (Based on Availability)
- 16.2.5 Adisseo
- 16.2.5.1. Overview
- 16.2.5.2. Products
- 16.2.5.3. SWOT Analysis
- 16.2.5.4. Recent Developments
- 16.2.5.5. Financials (Based on Availability)
- 16.2.6 Volzhsky Orgsynthese JSC
- 16.2.6.1. Overview
- 16.2.6.2. Products
- 16.2.6.3. SWOT Analysis
- 16.2.6.4. Recent Developments
- 16.2.6.5. Financials (Based on Availability)
- 16.2.7 Zhejiang NHU Co Ltd*List Not Exhaustive
- 16.2.7.1. Overview
- 16.2.7.2. Products
- 16.2.7.3. SWOT Analysis
- 16.2.7.4. Recent Developments
- 16.2.7.5. Financials (Based on Availability)
- 16.2.8 CJ CheilJedang Corp
- 16.2.8.1. Overview
- 16.2.8.2. Products
- 16.2.8.3. SWOT Analysis
- 16.2.8.4. Recent Developments
- 16.2.8.5. Financials (Based on Availability)
- 16.2.1 Sumitomo Chemical Co Ltd
List of Figures
- Figure 1: Global Methionine Industry Revenue Breakdown (Million, %) by Region 2024 & 2032
- Figure 2: Asia Pacific Methionine Industry Revenue (Million), by Country 2024 & 2032
- Figure 3: Asia Pacific Methionine Industry Revenue Share (%), by Country 2024 & 2032
- Figure 4: North America Methionine Industry Revenue (Million), by Country 2024 & 2032
- Figure 5: North America Methionine Industry Revenue Share (%), by Country 2024 & 2032
- Figure 6: Europe Methionine Industry Revenue (Million), by Country 2024 & 2032
- Figure 7: Europe Methionine Industry Revenue Share (%), by Country 2024 & 2032
- Figure 8: South America Methionine Industry Revenue (Million), by Country 2024 & 2032
- Figure 9: South America Methionine Industry Revenue Share (%), by Country 2024 & 2032
- Figure 10: Middle East and Africa Methionine Industry Revenue (Million), by Country 2024 & 2032
- Figure 11: Middle East and Africa Methionine Industry Revenue Share (%), by Country 2024 & 2032
- Figure 12: Asia Pacific Methionine Industry Revenue (Million), by Type 2024 & 2032
- Figure 13: Asia Pacific Methionine Industry Revenue Share (%), by Type 2024 & 2032
- Figure 14: Asia Pacific Methionine Industry Revenue (Million), by End-user Industry 2024 & 2032
- Figure 15: Asia Pacific Methionine Industry Revenue Share (%), by End-user Industry 2024 & 2032
- Figure 16: Asia Pacific Methionine Industry Revenue (Million), by Country 2024 & 2032
- Figure 17: Asia Pacific Methionine Industry Revenue Share (%), by Country 2024 & 2032
- Figure 18: North America Methionine Industry Revenue (Million), by Type 2024 & 2032
- Figure 19: North America Methionine Industry Revenue Share (%), by Type 2024 & 2032
- Figure 20: North America Methionine Industry Revenue (Million), by End-user Industry 2024 & 2032
- Figure 21: North America Methionine Industry Revenue Share (%), by End-user Industry 2024 & 2032
- Figure 22: North America Methionine Industry Revenue (Million), by Country 2024 & 2032
- Figure 23: North America Methionine Industry Revenue Share (%), by Country 2024 & 2032
- Figure 24: Europe Methionine Industry Revenue (Million), by Type 2024 & 2032
- Figure 25: Europe Methionine Industry Revenue Share (%), by Type 2024 & 2032
- Figure 26: Europe Methionine Industry Revenue (Million), by End-user Industry 2024 & 2032
- Figure 27: Europe Methionine Industry Revenue Share (%), by End-user Industry 2024 & 2032
- Figure 28: Europe Methionine Industry Revenue (Million), by Country 2024 & 2032
- Figure 29: Europe Methionine Industry Revenue Share (%), by Country 2024 & 2032
- Figure 30: South America Methionine Industry Revenue (Million), by Type 2024 & 2032
- Figure 31: South America Methionine Industry Revenue Share (%), by Type 2024 & 2032
- Figure 32: South America Methionine Industry Revenue (Million), by End-user Industry 2024 & 2032
- Figure 33: South America Methionine Industry Revenue Share (%), by End-user Industry 2024 & 2032
- Figure 34: South America Methionine Industry Revenue (Million), by Country 2024 & 2032
- Figure 35: South America Methionine Industry Revenue Share (%), by Country 2024 & 2032
- Figure 36: Middle East and Africa Methionine Industry Revenue (Million), by Type 2024 & 2032
- Figure 37: Middle East and Africa Methionine Industry Revenue Share (%), by Type 2024 & 2032
- Figure 38: Middle East and Africa Methionine Industry Revenue (Million), by End-user Industry 2024 & 2032
- Figure 39: Middle East and Africa Methionine Industry Revenue Share (%), by End-user Industry 2024 & 2032
- Figure 40: Middle East and Africa Methionine Industry Revenue (Million), by Country 2024 & 2032
- Figure 41: Middle East and Africa Methionine Industry Revenue Share (%), by Country 2024 & 2032
List of Tables
- Table 1: Global Methionine Industry Revenue Million Forecast, by Region 2019 & 2032
- Table 2: Global Methionine Industry Revenue Million Forecast, by Type 2019 & 2032
- Table 3: Global Methionine Industry Revenue Million Forecast, by End-user Industry 2019 & 2032
- Table 4: Global Methionine Industry Revenue Million Forecast, by Region 2019 & 2032
- Table 5: Global Methionine Industry Revenue Million Forecast, by Country 2019 & 2032
- Table 6: China Methionine Industry Revenue (Million) Forecast, by Application 2019 & 2032
- Table 7: India Methionine Industry Revenue (Million) Forecast, by Application 2019 & 2032
- Table 8: Japan Methionine Industry Revenue (Million) Forecast, by Application 2019 & 2032
- Table 9: South Korea Methionine Industry Revenue (Million) Forecast, by Application 2019 & 2032
- Table 10: Rest of Asia Pacific Methionine Industry Revenue (Million) Forecast, by Application 2019 & 2032
- Table 11: Global Methionine Industry Revenue Million Forecast, by Country 2019 & 2032
- Table 12: United States Methionine Industry Revenue (Million) Forecast, by Application 2019 & 2032
- Table 13: Canada Methionine Industry Revenue (Million) Forecast, by Application 2019 & 2032
- Table 14: Mexico Methionine Industry Revenue (Million) Forecast, by Application 2019 & 2032
- Table 15: Global Methionine Industry Revenue Million Forecast, by Country 2019 & 2032
- Table 16: Germany Methionine Industry Revenue (Million) Forecast, by Application 2019 & 2032
- Table 17: United Kingdom Methionine Industry Revenue (Million) Forecast, by Application 2019 & 2032
- Table 18: Italy Methionine Industry Revenue (Million) Forecast, by Application 2019 & 2032
- Table 19: France Methionine Industry Revenue (Million) Forecast, by Application 2019 & 2032
- Table 20: Rest of Europe Methionine Industry Revenue (Million) Forecast, by Application 2019 & 2032
- Table 21: Global Methionine Industry Revenue Million Forecast, by Country 2019 & 2032
- Table 22: Brazil Methionine Industry Revenue (Million) Forecast, by Application 2019 & 2032
- Table 23: Argentina Methionine Industry Revenue (Million) Forecast, by Application 2019 & 2032
- Table 24: Rest of South America Methionine Industry Revenue (Million) Forecast, by Application 2019 & 2032
- Table 25: Global Methionine Industry Revenue Million Forecast, by Country 2019 & 2032
- Table 26: Saudi Arabia Methionine Industry Revenue (Million) Forecast, by Application 2019 & 2032
- Table 27: South Africa Methionine Industry Revenue (Million) Forecast, by Application 2019 & 2032
- Table 28: Rest of Middle East and Africa Methionine Industry Revenue (Million) Forecast, by Application 2019 & 2032
- Table 29: Global Methionine Industry Revenue Million Forecast, by Type 2019 & 2032
- Table 30: Global Methionine Industry Revenue Million Forecast, by End-user Industry 2019 & 2032
- Table 31: Global Methionine Industry Revenue Million Forecast, by Country 2019 & 2032
- Table 32: China Methionine Industry Revenue (Million) Forecast, by Application 2019 & 2032
- Table 33: India Methionine Industry Revenue (Million) Forecast, by Application 2019 & 2032
- Table 34: Japan Methionine Industry Revenue (Million) Forecast, by Application 2019 & 2032
- Table 35: South Korea Methionine Industry Revenue (Million) Forecast, by Application 2019 & 2032
- Table 36: Rest of Asia Pacific Methionine Industry Revenue (Million) Forecast, by Application 2019 & 2032
- Table 37: Global Methionine Industry Revenue Million Forecast, by Type 2019 & 2032
- Table 38: Global Methionine Industry Revenue Million Forecast, by End-user Industry 2019 & 2032
- Table 39: Global Methionine Industry Revenue Million Forecast, by Country 2019 & 2032
- Table 40: United States Methionine Industry Revenue (Million) Forecast, by Application 2019 & 2032
- Table 41: Canada Methionine Industry Revenue (Million) Forecast, by Application 2019 & 2032
- Table 42: Mexico Methionine Industry Revenue (Million) Forecast, by Application 2019 & 2032
- Table 43: Global Methionine Industry Revenue Million Forecast, by Type 2019 & 2032
- Table 44: Global Methionine Industry Revenue Million Forecast, by End-user Industry 2019 & 2032
- Table 45: Global Methionine Industry Revenue Million Forecast, by Country 2019 & 2032
- Table 46: Germany Methionine Industry Revenue (Million) Forecast, by Application 2019 & 2032
- Table 47: United Kingdom Methionine Industry Revenue (Million) Forecast, by Application 2019 & 2032
- Table 48: Italy Methionine Industry Revenue (Million) Forecast, by Application 2019 & 2032
- Table 49: France Methionine Industry Revenue (Million) Forecast, by Application 2019 & 2032
- Table 50: Rest of Europe Methionine Industry Revenue (Million) Forecast, by Application 2019 & 2032
- Table 51: Global Methionine Industry Revenue Million Forecast, by Type 2019 & 2032
- Table 52: Global Methionine Industry Revenue Million Forecast, by End-user Industry 2019 & 2032
- Table 53: Global Methionine Industry Revenue Million Forecast, by Country 2019 & 2032
- Table 54: Brazil Methionine Industry Revenue (Million) Forecast, by Application 2019 & 2032
- Table 55: Argentina Methionine Industry Revenue (Million) Forecast, by Application 2019 & 2032
- Table 56: Rest of South America Methionine Industry Revenue (Million) Forecast, by Application 2019 & 2032
- Table 57: Global Methionine Industry Revenue Million Forecast, by Type 2019 & 2032
- Table 58: Global Methionine Industry Revenue Million Forecast, by End-user Industry 2019 & 2032
- Table 59: Global Methionine Industry Revenue Million Forecast, by Country 2019 & 2032
- Table 60: Saudi Arabia Methionine Industry Revenue (Million) Forecast, by Application 2019 & 2032
- Table 61: South Africa Methionine Industry Revenue (Million) Forecast, by Application 2019 & 2032
- Table 62: Rest of Middle East and Africa Methionine Industry Revenue (Million) Forecast, by Application 2019 & 2032
Frequently Asked Questions
1. What is the projected Compound Annual Growth Rate (CAGR) of the Methionine Industry?
The projected CAGR is approximately > 6.00%.
2. Which companies are prominent players in the Methionine Industry?
Key companies in the market include Sumitomo Chemical Co Ltd, Evonik Industries AG, NOVUS INTERNATIONAL, Chongqing Unisplendour Chemical Co Ltd, Adisseo, Volzhsky Orgsynthese JSC, Zhejiang NHU Co Ltd*List Not Exhaustive, CJ CheilJedang Corp.
3. What are the main segments of the Methionine Industry?
The market segments include Type, End-user Industry.
4. Can you provide details about the market size?
The market size is estimated to be USD XX Million as of 2022.
5. What are some drivers contributing to market growth?
Growing Demand from the Poultry Industry; Emerging Demand from the Aquaculture Industry.
6. What are the notable trends driving market growth?
Increasing Demand from the Animal Feed Segment.
7. Are there any restraints impacting market growth?
Complex Process of Manufacturing Methionine.
8. Can you provide examples of recent developments in the market?
September 2022: Adisseo started liquid methionine production through its 180,000-ton new plant in Nanjing, China. The company has doubled its methionine capacity to 350,000 tons through its operational new plant consolidating its leading position in the world.
9. What pricing options are available for accessing the report?
Pricing options include single-user, multi-user, and enterprise licenses priced at USD 4750, USD 5250, and USD 8750 respectively.
10. Is the market size provided in terms of value or volume?
The market size is provided in terms of value, measured in Million.
11. Are there any specific market keywords associated with the report?
Yes, the market keyword associated with the report is "Methionine Industry," which aids in identifying and referencing the specific market segment covered.
12. How do I determine which pricing option suits my needs best?
The pricing options vary based on user requirements and access needs. Individual users may opt for single-user licenses, while businesses requiring broader access may choose multi-user or enterprise licenses for cost-effective access to the report.
13. Are there any additional resources or data provided in the Methionine Industry report?
While the report offers comprehensive insights, it's advisable to review the specific contents or supplementary materials provided to ascertain if additional resources or data are available.
14. How can I stay updated on further developments or reports in the Methionine Industry?
To stay informed about further developments, trends, and reports in the Methionine Industry, consider subscribing to industry newsletters, following relevant companies and organizations, or regularly checking reputable industry news sources and publications.
Methodology
Step 1 - Identification of Relevant Samples Size from Population Database


Step 2 - Approaches for Defining Global Market Size (Value, Volume* & Price*)

Note*: In applicable scenarios
Step 3 - Data Sources
Primary Research
- Web Analytics
- Survey Reports
- Research Institute
- Latest Research Reports
- Opinion Leaders
Secondary Research
- Annual Reports
- White Paper
- Latest Press Release
- Industry Association
- Paid Database
- Investor Presentations

Step 4 - Data Triangulation
Involves using different sources of information in order to increase the validity of a study
These sources are likely to be stakeholders in a program - participants, other researchers, program staff, other community members, and so on.
Then we put all data in single framework & apply various statistical tools to find out the dynamic on the market.
During the analysis stage, feedback from the stakeholder groups would be compared to determine areas of agreement as well as areas of divergence


