

Key Insights
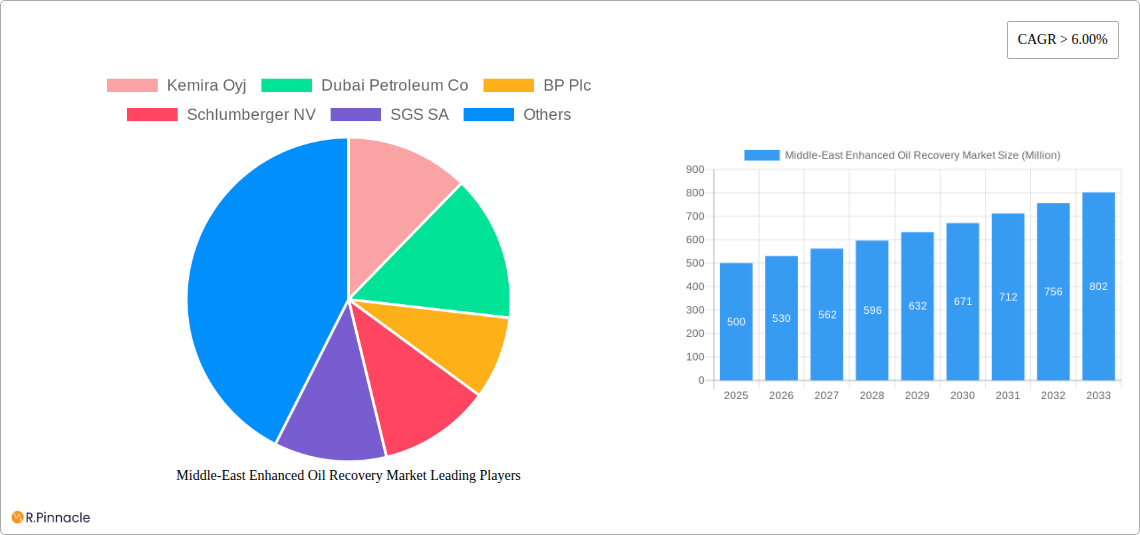
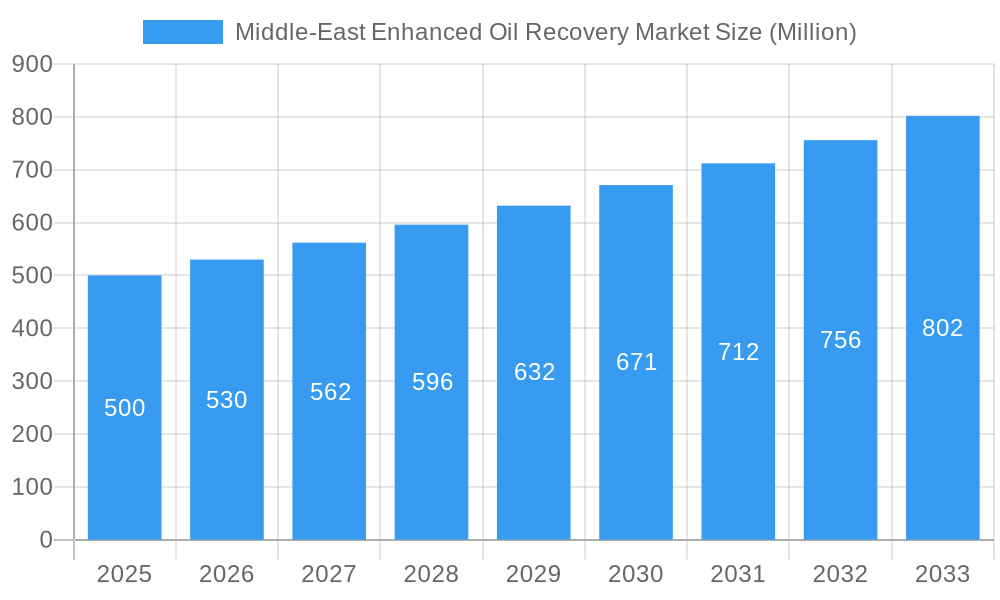
The Middle East Enhanced Oil Recovery (EOR) market is poised for substantial growth, driven by the region's vast oil reserves and the imperative to maximize output from mature fields. Projected to reach 48.71 billion by 2033 from a 2025 base year, the market is expected to expand at a Compound Annual Growth Rate (CAGR) of 3.65%. Key growth catalysts include the depletion of conventional oil reserves, escalating global energy demand, and government-led initiatives focused on energy security and diversification. Technological advancements in thermal, gas injection, and chemical EOR methods are enhancing extraction efficiency from complex reservoirs. Major oil companies are significantly investing in EOR projects, fostering market competitiveness and innovation. Segmentation by technique indicates thermal and chemical injection methods are anticipated to hold significant market shares due to regional reservoir characteristics and operational expertise.
Middle-East Enhanced Oil Recovery Market Market Size (In Billion)
Regional market dynamics reflect varying oil production levels and EOR investment across Middle Eastern nations. Saudi Arabia and the UAE, with their extensive oil reserves and advanced infrastructure, are expected to lead the market. However, other nations are increasingly adopting EOR technologies to boost their production capabilities. Future market trajectory will be influenced by global oil prices, EOR technological breakthroughs, and supportive government energy investment policies. The growing emphasis on sustainability and emissions reduction will also shape EOR technique adoption, favoring those with a lower environmental impact. The Middle East EOR market presents significant opportunities for established and emerging players in the oil and gas sector.
Middle-East Enhanced Oil Recovery Market Company Market Share
Middle East Enhanced Oil Recovery Market Analysis: 2019-2033
This comprehensive report offers detailed analysis of the Middle East Enhanced Oil Recovery market, providing critical insights for industry professionals, investors, and stakeholders. Covering the period from 2019 to 2033, with a 2025 market size projection, this report details the market's structure, dynamics, and future potential. The study includes segmentation by EOR technique (Thermal, Gas Injection, Chemical Injection) and features key market participants such as Kemira Oyj, Dubai Petroleum Co, BP Plc, Schlumberger NV, SGS SA, Linde Plc, Saudi Aramco, China National Offshore Oil Corporation, Abu Dhabi National Oil Company (ADNOC), and Petroleum Development Oman. This list is not exhaustive.
Middle-East Enhanced Oil Recovery Market Structure & Innovation Trends
This section analyzes the competitive landscape of the Middle East EOR market, examining market concentration, innovation drivers, regulatory frameworks, and M&A activities. We delve into the market share held by key players and analyze the value of significant M&A deals within the sector. The report explores the influence of technological advancements, government policies, and evolving end-user demands on market structure. We examine the role of substitute products and identify potential disruptions to the existing market dynamics.
- Market Concentration: xx% market share held by the top 5 players in 2025.
- Innovation Drivers: Focus on CO2 utilization, digitalization of EOR operations, and enhanced chemical formulations.
- Regulatory Framework: Analysis of regional policies impacting EOR investments and operations.
- M&A Activities: Assessment of key mergers and acquisitions, including deal values (xx Million) and their impact on market consolidation.
- End-user Demographics: Detailed breakdown of oil and gas companies utilizing EOR technologies in the region.
Middle-East Enhanced Oil Recovery Market Dynamics & Trends
This section explores the key factors driving market growth, including technological advancements, increasing oil demand, government incentives for EOR projects, and the ongoing efforts to optimize production from mature oil fields. The competitive dynamics within the market are analyzed, alongside the impact of technological disruptions and shifting consumer preferences (e.g., demand for sustainable EOR solutions). The report provides a detailed analysis of the Compound Annual Growth Rate (CAGR) and market penetration rates for various EOR techniques. The analysis also encompasses the influence of geopolitical factors and fluctuating oil prices on market dynamics.
Dominant Regions & Segments in Middle-East Enhanced Oil Recovery Market
This section identifies the leading region, country, and EOR technique within the Middle East market. We provide a comprehensive analysis of the factors contributing to the dominance of specific regions and techniques, focusing on economic policies, infrastructure development, and resource availability. The detailed analysis of each segment (Thermal, Gas Injection, Chemical Injection) is supported by bullet points highlighting key drivers.
- Key Drivers for Dominant Segment (e.g., Gas Injection):
- Abundant natural gas resources in the region.
- Established infrastructure for gas transportation and processing.
- Favorable economic policies supporting gas-based EOR projects.
- Dominant Region Analysis: A detailed examination of the factors contributing to the dominance of a specific region (e.g., Saudi Arabia). This includes an in-depth discussion of government regulations, technological advancements, and resource availability.
Middle-East Enhanced Oil Recovery Market Product Innovations
This section summarizes recent product developments, their applications, and competitive advantages. We highlight the technological trends shaping the EOR landscape and the market fit of new products. This analysis includes discussions about advancements in chemical formulations, improved thermal recovery techniques, and the integration of digital technologies to optimize EOR processes.
Report Scope & Segmentation Analysis
This report segments the Middle East EOR market based on technique: Thermal, Gas Injection, and Chemical Injection. Each segment’s growth projections, market size (in Million), and competitive dynamics are discussed.
- Thermal EOR: Analysis of market size (xx Million in 2025), growth projections (xx% CAGR), and key players.
- Gas Injection EOR: Analysis of market size (xx Million in 2025), growth projections (xx% CAGR), and key players.
- Chemical Injection EOR: Analysis of market size (xx Million in 2025), growth projections (xx% CAGR), and key players.
Key Drivers of Middle-East Enhanced Oil Recovery Market Growth
This section outlines the key factors driving the growth of the Middle East EOR market. These factors include technological advancements leading to increased efficiency and cost-effectiveness, supportive government policies and incentives, and the growing demand for oil globally. Specific examples of these drivers are highlighted.
Challenges in the Middle-East Enhanced Oil Recovery Market Sector
This section discusses the challenges and restraints faced by the Middle East EOR market. This includes regulatory hurdles, supply chain disruptions, high upfront capital investment requirements, and intense competition among service providers. Quantifiable impacts of these challenges are included where possible.
Emerging Opportunities in Middle-East Enhanced Oil Recovery Market
This section highlights emerging opportunities in the Middle East EOR market. These include the exploration of new and unconventional oil reservoirs, the development of innovative EOR technologies, and the adoption of sustainable EOR practices. Focus areas include potential markets, technological advancements, and evolving consumer preferences.
Leading Players in the Middle-East Enhanced Oil Recovery Market Market
- Kemira Oyj
- Dubai Petroleum Co
- BP Plc
- Schlumberger NV
- SGS SA
- Linde Plc
- Saudi Aramco
- China National Offshore Oil Corporation
- Abu Dhabi National Oil Company (ADNOC)
- Petroleum Development Oman
Key Developments in Middle-East Enhanced Oil Recovery Market Industry
- November 2021: Qatar Petroleum partnered with Axens (an IFP group company) for a CO2 dehydration project, supporting future EOR and CO2 sequestration efforts. Medgulf Construction was selected as the EPC contractor.
- 2019: ADNOC aimed to position the UAE among the top four countries globally in CCUS EOR projects by 2025, securing gas from Shah-Ultra Sour Gas Plant, Habshan, and Bab gas fields for CO2 sourcing.
Future Outlook for Middle-East Enhanced Oil Recovery Market Market
The Middle East EOR market is poised for significant growth, driven by continued technological advancements, supportive government policies, and the sustained demand for oil. Strategic opportunities exist for companies investing in innovative technologies, expanding their regional presence, and collaborating with local partners. The long-term outlook is positive, with considerable potential for market expansion and increased investment in the coming years.
Middle-East Enhanced Oil Recovery Market Segmentation
-
1. Technique
- 1.1. Thermal
- 1.2. Gas Injection
- 1.3. Chemical Injection
-
2. Geography
- 2.1. Oman
- 2.2. United Arab Emirates
- 2.3. Qatar
- 2.4. Rest of Middle-East
Middle-East Enhanced Oil Recovery Market Segmentation By Geography
- 1. Oman
- 2. United Arab Emirates
- 3. Qatar
- 4. Rest of Middle East
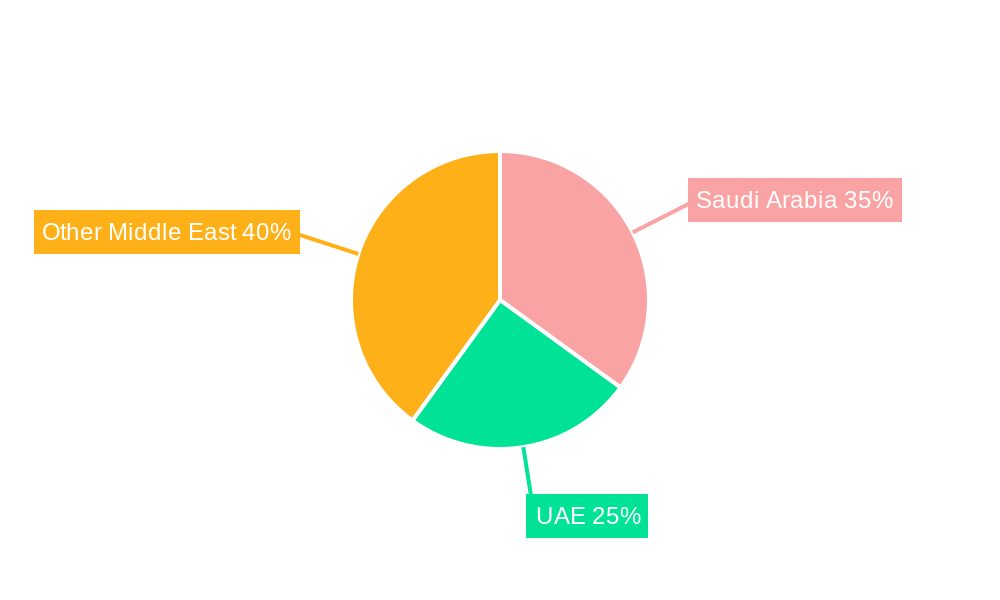
Middle-East Enhanced Oil Recovery Market Regional Market Share
Geographic Coverage of Middle-East Enhanced Oil Recovery Market
Middle-East Enhanced Oil Recovery Market REPORT HIGHLIGHTS
| Aspects | Details |
|---|---|
| Study Period | 2020-2034 |
| Base Year | 2025 |
| Estimated Year | 2026 |
| Forecast Period | 2026-2034 |
| Historical Period | 2020-2025 |
| Growth Rate | CAGR of 3.65% from 2020-2034 |
| Segmentation |
|
Table of Contents
- 1. Introduction
- 1.1. Research Scope
- 1.2. Market Segmentation
- 1.3. Research Objective
- 1.4. Definitions and Assumptions
- 2. Executive Summary
- 2.1. Market Snapshot
- 3. Market Dynamics
- 3.1. Market Drivers
- 3.2. Market Restrains
- 3.3. Market Trends
- 3.4. Market Opportunities
- 4. Market Factor Analysis
- 4.1. Porters Five Forces
- 4.1.1. Bargaining Power of Suppliers
- 4.1.2. Bargaining Power of Buyers
- 4.1.3. Threat of New Entrants
- 4.1.4. Threat of Substitutes
- 4.1.5. Competitive Rivalry
- 4.2. PESTEL analysis
- 4.3. BCG Analysis
- 4.3.1. Stars (High Growth, High Market Share)
- 4.3.2. Cash Cows (Low Growth, High Market Share)
- 4.3.3. Question Mark (High Growth, Low Market Share)
- 4.3.4. Dogs (Low Growth, Low Market Share)
- 4.4. Ansoff Matrix Analysis
- 4.5. Supply Chain Analysis
- 4.6. Regulatory Landscape
- 4.7. Current Market Potential and Opportunity Assessment (TAM–SAM–SOM Framework)
- 4.8. PRI Analyst Note
- 4.1. Porters Five Forces
- 5. Market Analysis, Insights and Forecast 2021-2033
- 5.1. Market Analysis, Insights and Forecast - by Technique
- 5.1.1. Thermal
- 5.1.2. Gas Injection
- 5.1.3. Chemical Injection
- 5.2. Market Analysis, Insights and Forecast - by Geography
- 5.2.1. Oman
- 5.2.2. United Arab Emirates
- 5.2.3. Qatar
- 5.2.4. Rest of Middle-East
- 5.3. Market Analysis, Insights and Forecast - by Region
- 5.3.1. Oman
- 5.3.2. United Arab Emirates
- 5.3.3. Qatar
- 5.3.4. Rest of Middle East
- 5.1. Market Analysis, Insights and Forecast - by Technique
- 6. Global Middle-East Enhanced Oil Recovery Market Analysis, Insights and Forecast, 2021-2033
- 6.1. Market Analysis, Insights and Forecast - by Technique
- 6.1.1. Thermal
- 6.1.2. Gas Injection
- 6.1.3. Chemical Injection
- 6.2. Market Analysis, Insights and Forecast - by Geography
- 6.2.1. Oman
- 6.2.2. United Arab Emirates
- 6.2.3. Qatar
- 6.2.4. Rest of Middle-East
- 6.1. Market Analysis, Insights and Forecast - by Technique
- 7. Oman Middle-East Enhanced Oil Recovery Market Analysis, Insights and Forecast, 2020-2032
- 7.1. Market Analysis, Insights and Forecast - by Technique
- 7.1.1. Thermal
- 7.1.2. Gas Injection
- 7.1.3. Chemical Injection
- 7.2. Market Analysis, Insights and Forecast - by Geography
- 7.2.1. Oman
- 7.2.2. United Arab Emirates
- 7.2.3. Qatar
- 7.2.4. Rest of Middle-East
- 7.1. Market Analysis, Insights and Forecast - by Technique
- 8. United Arab Emirates Middle-East Enhanced Oil Recovery Market Analysis, Insights and Forecast, 2020-2032
- 8.1. Market Analysis, Insights and Forecast - by Technique
- 8.1.1. Thermal
- 8.1.2. Gas Injection
- 8.1.3. Chemical Injection
- 8.2. Market Analysis, Insights and Forecast - by Geography
- 8.2.1. Oman
- 8.2.2. United Arab Emirates
- 8.2.3. Qatar
- 8.2.4. Rest of Middle-East
- 8.1. Market Analysis, Insights and Forecast - by Technique
- 9. Qatar Middle-East Enhanced Oil Recovery Market Analysis, Insights and Forecast, 2020-2032
- 9.1. Market Analysis, Insights and Forecast - by Technique
- 9.1.1. Thermal
- 9.1.2. Gas Injection
- 9.1.3. Chemical Injection
- 9.2. Market Analysis, Insights and Forecast - by Geography
- 9.2.1. Oman
- 9.2.2. United Arab Emirates
- 9.2.3. Qatar
- 9.2.4. Rest of Middle-East
- 9.1. Market Analysis, Insights and Forecast - by Technique
- 10. Rest of Middle East Middle-East Enhanced Oil Recovery Market Analysis, Insights and Forecast, 2020-2032
- 10.1. Market Analysis, Insights and Forecast - by Technique
- 10.1.1. Thermal
- 10.1.2. Gas Injection
- 10.1.3. Chemical Injection
- 10.2. Market Analysis, Insights and Forecast - by Geography
- 10.2.1. Oman
- 10.2.2. United Arab Emirates
- 10.2.3. Qatar
- 10.2.4. Rest of Middle-East
- 10.1. Market Analysis, Insights and Forecast - by Technique
- 11. Competitive Analysis
- 11.1. Company Profiles
- 11.1.1 Kemira Oyj
- 11.1.1.1. Company Overview
- 11.1.1.2. Products
- 11.1.1.3. Company Financials
- 11.1.1.4. SWOT Analysis
- 11.1.2 Dubai Petroleum Co
- 11.1.2.1. Company Overview
- 11.1.2.2. Products
- 11.1.2.3. Company Financials
- 11.1.2.4. SWOT Analysis
- 11.1.3 BP Plc
- 11.1.3.1. Company Overview
- 11.1.3.2. Products
- 11.1.3.3. Company Financials
- 11.1.3.4. SWOT Analysis
- 11.1.4 Schlumberger NV
- 11.1.4.1. Company Overview
- 11.1.4.2. Products
- 11.1.4.3. Company Financials
- 11.1.4.4. SWOT Analysis
- 11.1.5 SGS SA
- 11.1.5.1. Company Overview
- 11.1.5.2. Products
- 11.1.5.3. Company Financials
- 11.1.5.4. SWOT Analysis
- 11.1.6 Linde Plc*List Not Exhaustive
- 11.1.6.1. Company Overview
- 11.1.6.2. Products
- 11.1.6.3. Company Financials
- 11.1.6.4. SWOT Analysis
- 11.1.7 Saudi Aramco
- 11.1.7.1. Company Overview
- 11.1.7.2. Products
- 11.1.7.3. Company Financials
- 11.1.7.4. SWOT Analysis
- 11.1.8 China National Offshore Oil Corporation
- 11.1.8.1. Company Overview
- 11.1.8.2. Products
- 11.1.8.3. Company Financials
- 11.1.8.4. SWOT Analysis
- 11.1.9 Abu Dhabi National Oil Company (ADNOC)
- 11.1.9.1. Company Overview
- 11.1.9.2. Products
- 11.1.9.3. Company Financials
- 11.1.9.4. SWOT Analysis
- 11.1.10 Petroleum Development Oman
- 11.1.10.1. Company Overview
- 11.1.10.2. Products
- 11.1.10.3. Company Financials
- 11.1.10.4. SWOT Analysis
- 11.1.1 Kemira Oyj
- 11.2. Market Entropy
- 11.2.1 Company's Key Areas Served
- 11.2.2 Recent Developments
- 11.3. Company Market Share Analysis 2025
- 11.3.1 Top 5 Companies Market Share Analysis
- 11.3.2 Top 3 Companies Market Share Analysis
- 11.4. List of Potential Customers
- 12. Research Methodology
List of Figures
- Figure 1: Global Middle-East Enhanced Oil Recovery Market Revenue Breakdown (billion, %) by Region 2025 & 2033
- Figure 2: Oman Middle-East Enhanced Oil Recovery Market Revenue (billion), by Technique 2025 & 2033
- Figure 3: Oman Middle-East Enhanced Oil Recovery Market Revenue Share (%), by Technique 2025 & 2033
- Figure 4: Oman Middle-East Enhanced Oil Recovery Market Revenue (billion), by Geography 2025 & 2033
- Figure 5: Oman Middle-East Enhanced Oil Recovery Market Revenue Share (%), by Geography 2025 & 2033
- Figure 6: Oman Middle-East Enhanced Oil Recovery Market Revenue (billion), by Country 2025 & 2033
- Figure 7: Oman Middle-East Enhanced Oil Recovery Market Revenue Share (%), by Country 2025 & 2033
- Figure 8: United Arab Emirates Middle-East Enhanced Oil Recovery Market Revenue (billion), by Technique 2025 & 2033
- Figure 9: United Arab Emirates Middle-East Enhanced Oil Recovery Market Revenue Share (%), by Technique 2025 & 2033
- Figure 10: United Arab Emirates Middle-East Enhanced Oil Recovery Market Revenue (billion), by Geography 2025 & 2033
- Figure 11: United Arab Emirates Middle-East Enhanced Oil Recovery Market Revenue Share (%), by Geography 2025 & 2033
- Figure 12: United Arab Emirates Middle-East Enhanced Oil Recovery Market Revenue (billion), by Country 2025 & 2033
- Figure 13: United Arab Emirates Middle-East Enhanced Oil Recovery Market Revenue Share (%), by Country 2025 & 2033
- Figure 14: Qatar Middle-East Enhanced Oil Recovery Market Revenue (billion), by Technique 2025 & 2033
- Figure 15: Qatar Middle-East Enhanced Oil Recovery Market Revenue Share (%), by Technique 2025 & 2033
- Figure 16: Qatar Middle-East Enhanced Oil Recovery Market Revenue (billion), by Geography 2025 & 2033
- Figure 17: Qatar Middle-East Enhanced Oil Recovery Market Revenue Share (%), by Geography 2025 & 2033
- Figure 18: Qatar Middle-East Enhanced Oil Recovery Market Revenue (billion), by Country 2025 & 2033
- Figure 19: Qatar Middle-East Enhanced Oil Recovery Market Revenue Share (%), by Country 2025 & 2033
- Figure 20: Rest of Middle East Middle-East Enhanced Oil Recovery Market Revenue (billion), by Technique 2025 & 2033
- Figure 21: Rest of Middle East Middle-East Enhanced Oil Recovery Market Revenue Share (%), by Technique 2025 & 2033
- Figure 22: Rest of Middle East Middle-East Enhanced Oil Recovery Market Revenue (billion), by Geography 2025 & 2033
- Figure 23: Rest of Middle East Middle-East Enhanced Oil Recovery Market Revenue Share (%), by Geography 2025 & 2033
- Figure 24: Rest of Middle East Middle-East Enhanced Oil Recovery Market Revenue (billion), by Country 2025 & 2033
- Figure 25: Rest of Middle East Middle-East Enhanced Oil Recovery Market Revenue Share (%), by Country 2025 & 2033
List of Tables
- Table 1: Global Middle-East Enhanced Oil Recovery Market Revenue billion Forecast, by Technique 2020 & 2033
- Table 2: Global Middle-East Enhanced Oil Recovery Market Revenue billion Forecast, by Geography 2020 & 2033
- Table 3: Global Middle-East Enhanced Oil Recovery Market Revenue billion Forecast, by Region 2020 & 2033
- Table 4: Global Middle-East Enhanced Oil Recovery Market Revenue billion Forecast, by Technique 2020 & 2033
- Table 5: Global Middle-East Enhanced Oil Recovery Market Revenue billion Forecast, by Geography 2020 & 2033
- Table 6: Global Middle-East Enhanced Oil Recovery Market Revenue billion Forecast, by Country 2020 & 2033
- Table 7: Global Middle-East Enhanced Oil Recovery Market Revenue billion Forecast, by Technique 2020 & 2033
- Table 8: Global Middle-East Enhanced Oil Recovery Market Revenue billion Forecast, by Geography 2020 & 2033
- Table 9: Global Middle-East Enhanced Oil Recovery Market Revenue billion Forecast, by Country 2020 & 2033
- Table 10: Global Middle-East Enhanced Oil Recovery Market Revenue billion Forecast, by Technique 2020 & 2033
- Table 11: Global Middle-East Enhanced Oil Recovery Market Revenue billion Forecast, by Geography 2020 & 2033
- Table 12: Global Middle-East Enhanced Oil Recovery Market Revenue billion Forecast, by Country 2020 & 2033
- Table 13: Global Middle-East Enhanced Oil Recovery Market Revenue billion Forecast, by Technique 2020 & 2033
- Table 14: Global Middle-East Enhanced Oil Recovery Market Revenue billion Forecast, by Geography 2020 & 2033
- Table 15: Global Middle-East Enhanced Oil Recovery Market Revenue billion Forecast, by Country 2020 & 2033
Frequently Asked Questions
1. What is the projected Compound Annual Growth Rate (CAGR) of the Middle-East Enhanced Oil Recovery Market?
The projected CAGR is approximately 3.65%.
2. Which companies are prominent players in the Middle-East Enhanced Oil Recovery Market?
Key companies in the market include Kemira Oyj, Dubai Petroleum Co, BP Plc, Schlumberger NV, SGS SA, Linde Plc*List Not Exhaustive, Saudi Aramco, China National Offshore Oil Corporation, Abu Dhabi National Oil Company (ADNOC), Petroleum Development Oman.
3. What are the main segments of the Middle-East Enhanced Oil Recovery Market?
The market segments include Technique, Geography.
4. Can you provide details about the market size?
The market size is estimated to be USD 48.71 billion as of 2022.
5. What are some drivers contributing to market growth?
4.; Recovering Number of Air Passengers. on Account of the Cheaper Airfare in Recent Times4.; Increasing Disposable Income of Population.
6. What are the notable trends driving market growth?
Gas Injection Expected to Witness Significant Growth.
7. Are there any restraints impacting market growth?
4.; High Share of Fossil-Fuel-Based Aviation Fuels in South American Countries.
8. Can you provide examples of recent developments in the market?
In November 2021, Qatar Petroleum planned the CO2 dehydration project with Axens, an IFP group company, for the upcoming EOR projects and the CO2 sequestration process. The Medgulf Construction company was selected as the EPC contractor.
9. What pricing options are available for accessing the report?
Pricing options include single-user, multi-user, and enterprise licenses priced at USD 4750, USD 5250, and USD 8750 respectively.
10. Is the market size provided in terms of value or volume?
The market size is provided in terms of value, measured in billion.
11. Are there any specific market keywords associated with the report?
Yes, the market keyword associated with the report is "Middle-East Enhanced Oil Recovery Market," which aids in identifying and referencing the specific market segment covered.
12. How do I determine which pricing option suits my needs best?
The pricing options vary based on user requirements and access needs. Individual users may opt for single-user licenses, while businesses requiring broader access may choose multi-user or enterprise licenses for cost-effective access to the report.
13. Are there any additional resources or data provided in the Middle-East Enhanced Oil Recovery Market report?
While the report offers comprehensive insights, it's advisable to review the specific contents or supplementary materials provided to ascertain if additional resources or data are available.
14. How can I stay updated on further developments or reports in the Middle-East Enhanced Oil Recovery Market?
To stay informed about further developments, trends, and reports in the Middle-East Enhanced Oil Recovery Market, consider subscribing to industry newsletters, following relevant companies and organizations, or regularly checking reputable industry news sources and publications.
Methodology
Step 1 - Identification of Relevant Samples Size from Population Database


Step 2 - Approaches for Defining Global Market Size (Value, Volume* & Price*)

Note*: In applicable scenarios
Step 3 - Data Sources
Primary Research
- Web Analytics
- Survey Reports
- Research Institute
- Latest Research Reports
- Opinion Leaders
Secondary Research
- Annual Reports
- White Paper
- Latest Press Release
- Industry Association
- Paid Database
- Investor Presentations

Step 4 - Data Triangulation
Involves using different sources of information in order to increase the validity of a study
These sources are likely to be stakeholders in a program - participants, other researchers, program staff, other community members, and so on.
Then we put all data in single framework & apply various statistical tools to find out the dynamic on the market.
During the analysis stage, feedback from the stakeholder groups would be compared to determine areas of agreement as well as areas of divergence