
Key Insights
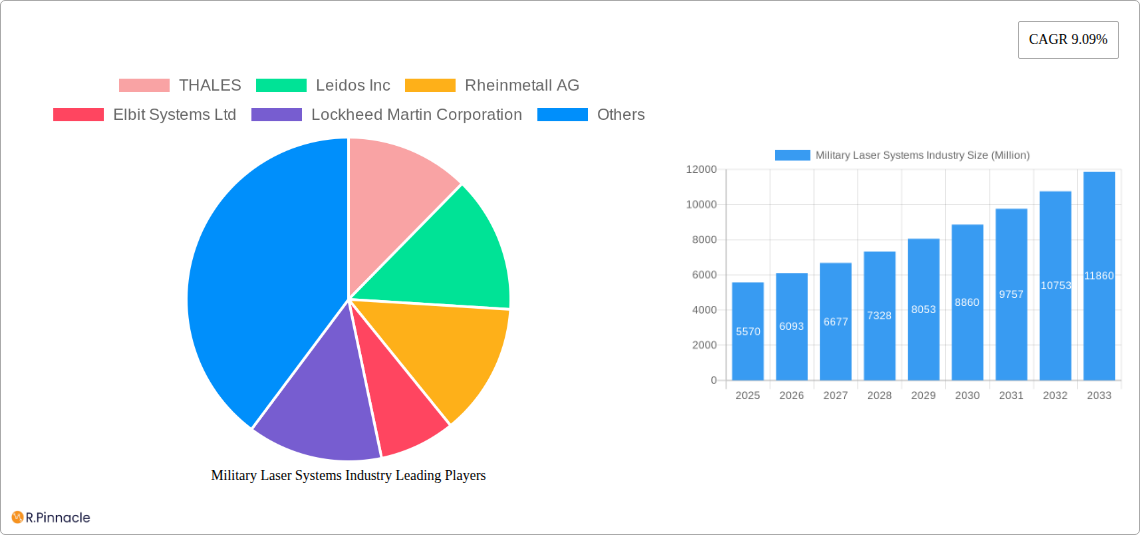
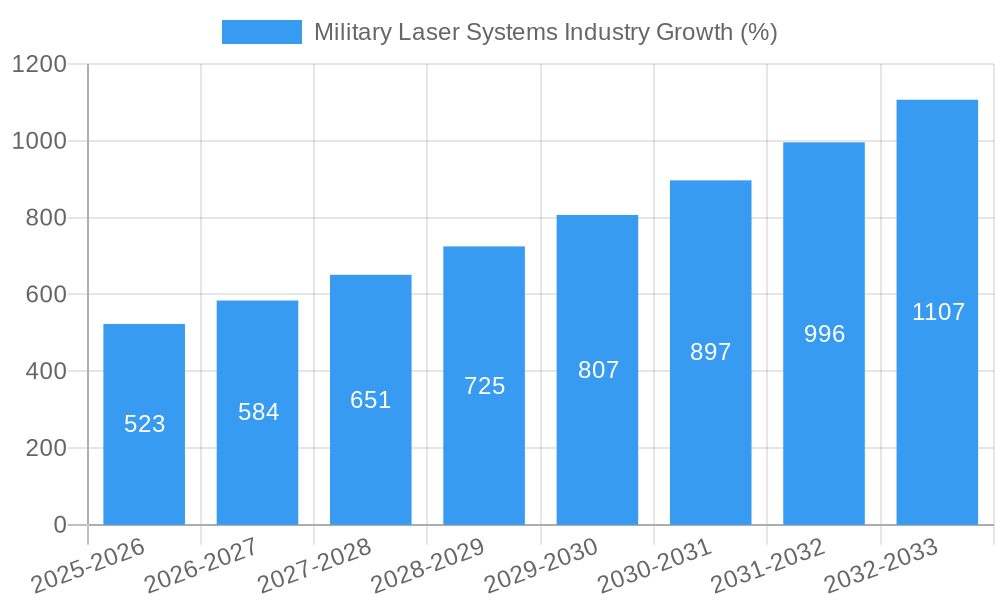
The Military Laser Systems market, valued at $5.57 billion in 2025, is projected to experience robust growth, driven by a Compound Annual Growth Rate (CAGR) of 9.09% from 2025 to 2033. This expansion is fueled by several key factors. Firstly, the increasing demand for advanced precision-guided munitions and directed energy weapons across various military applications is significantly impacting market growth. Secondly, technological advancements in solid-state lasers, offering enhanced efficiency and power output, are driving adoption. Thirdly, governments worldwide are investing heavily in modernizing their defense capabilities, leading to increased procurement of laser systems for applications such as rangefinding, targeting, and countermeasures. Finally, miniaturization and improved power efficiency are making laser systems more adaptable for integration into smaller platforms like drones and unmanned aerial vehicles (UAVs). The market segmentation reveals strong demand across various applications, including directed energy weapons, guidance systems, and laser designators, with solid-state lasers holding a significant technology segment share.
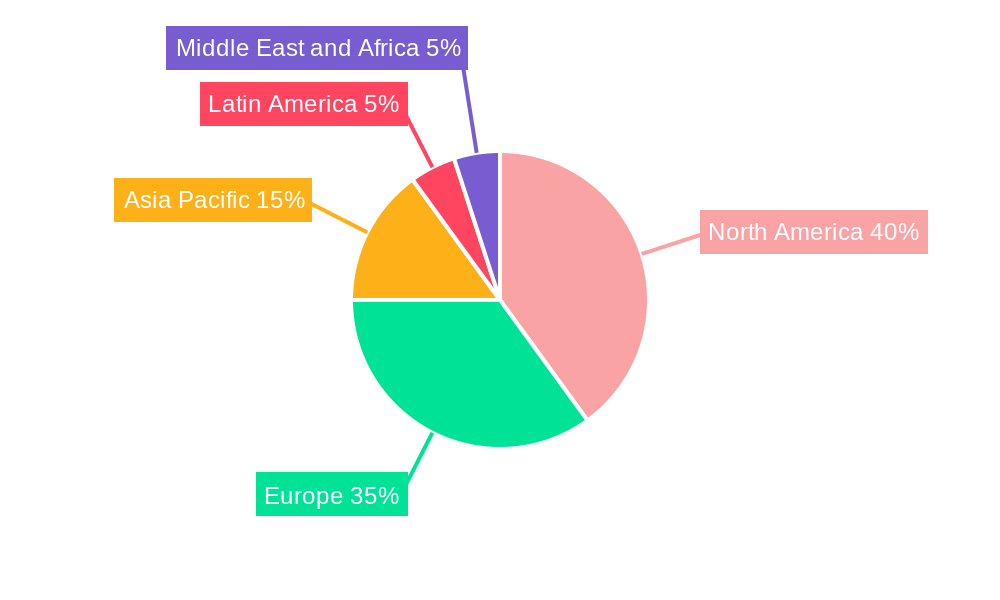
Competition in the military laser systems market is intense, with major players such as Thales, Leidos, Rheinmetall, Elbit Systems, Lockheed Martin, and others vying for market share. Geographical distribution shows a concentration of demand in North America and Europe, largely due to established defense budgets and technological advancements. However, the Asia-Pacific region is witnessing significant growth, driven by increasing defense expenditure and technological adoption by countries in the region. While challenges remain, including the high initial investment costs associated with laser system development and integration, the long-term prospects for the military laser systems market remain highly positive, underpinned by the continuous need for enhanced military capabilities and technological innovations. The market is poised for substantial expansion as defense modernization efforts continue globally.
Military Laser Systems Industry Market Report: 2019-2033
This comprehensive report provides an in-depth analysis of the Military Laser Systems industry, offering actionable insights for industry professionals, investors, and strategists. The report covers the period from 2019 to 2033, with a focus on the 2025-2033 forecast period. The base year for this analysis is 2025. The market is segmented by technology (Solid State Lasers, Gas Lasers, Others) and application (Directed Energy Weapons, Guidance Systems, Laser Sights, Designators and Rangefinders, Others). Key players like Thales, Leidos, Rheinmetall, Elbit Systems, Lockheed Martin, and others are profiled, providing a complete overview of this dynamic sector. The report projects a xx Million market size by 2033, with a CAGR of xx% during the forecast period.
Military Laser Systems Industry Market Structure & Innovation Trends
The Military Laser Systems market is characterized by a moderately concentrated structure, with several major players holding significant market share. THALES, Lockheed Martin Corporation, and RTX Corporation are among the leading companies, collectively accounting for an estimated xx% of the market in 2025. However, the market is also witnessing increased participation from smaller, specialized firms focusing on niche technologies and applications.
Innovation is a key driver in this sector, fueled by advancements in solid-state laser technology, miniaturization, and improved energy efficiency. Stringent regulatory frameworks governing defense technologies influence market dynamics. Product substitutes, such as traditional targeting systems, are facing increasing pressure due to laser systems’ enhanced precision and effectiveness.
- Market Concentration: High (xx%), with top 5 players holding significant market share.
- M&A Activity: Moderate (xx Million in deal value in the last 5 years), primarily focused on technology acquisitions and expansion into new markets.
- Innovation Drivers: Advancements in solid-state lasers, miniaturization, improved energy efficiency.
- Regulatory Frameworks: Stringent regulations and export controls impact market access and growth.
Military Laser Systems Industry Market Dynamics & Trends
The Military Laser Systems market is experiencing robust growth, driven by increasing defense budgets globally, the demand for precision-guided munitions, and the development of directed energy weapons. Technological disruptions, such as the emergence of high-power fiber lasers and improved thermal management systems, are reshaping the competitive landscape.
Consumer preferences are shifting towards more compact, lightweight, and energy-efficient laser systems. Competitive dynamics are intense, with major players focusing on R&D, strategic partnerships, and mergers & acquisitions to enhance their market position. The market is expected to witness a significant increase in the adoption of solid-state lasers due to their advantages in terms of size, weight, and power efficiency.
The market witnessed a CAGR of xx% from 2019 to 2024 and is projected to maintain a strong growth trajectory with a CAGR of xx% from 2025 to 2033. Market penetration of laser-based systems is increasing across various military applications, especially in directed energy weapons.
Dominant Regions & Segments in Military Laser Systems Industry
The North American region, particularly the United States, holds a dominant position in the Military Laser Systems market, driven by robust defense spending, technological advancements, and a strong domestic industrial base. Significant investments in R&D and the adoption of advanced laser technologies by the US military contribute to this dominance.
- Leading Region: North America (United States)
- Key Drivers (North America): High defense budget, advanced technology development, strong domestic industry.
Within the technology segment, Solid State Lasers are experiencing the fastest growth, owing to their superior performance and cost-effectiveness compared to gas lasers. In terms of application, Directed Energy Weapons represent the largest and fastest-growing segment, driven by the increasing need for effective countermeasures against drones and other threats.
- Leading Technology Segment: Solid State Lasers
- Key Drivers (Solid State Lasers): Improved performance, cost-effectiveness, miniaturization.
- Leading Application Segment: Directed Energy Weapons
- Key Drivers (Directed Energy Weapons): Growing demand for effective countermeasures, technological advancements.
Military Laser Systems Industry Product Innovations
Recent years have witnessed significant advancements in military laser systems, including the development of higher-power lasers, improved beam quality, and more compact and robust designs. These innovations have enhanced the capabilities of laser-based weapon systems, guidance systems, and rangefinders. The focus is on integrating advanced technologies such as artificial intelligence and improved thermal management systems to enhance overall performance and effectiveness. This aligns with the growing need for effective and precise military applications.
Report Scope & Segmentation Analysis
This report comprehensively analyzes the Military Laser Systems market, segmented by technology (Solid State Lasers, Gas Lasers, Others) and application (Directed Energy Weapons, Guidance Systems, Laser Sights, Designators and Rangefinders, Others).
Technology: Solid State Lasers are projected to witness the highest growth rate due to their advantages in efficiency and size. Gas Lasers maintain a significant market share, driven by their established performance in specific applications. The "Others" segment encompasses emerging laser technologies.
Application: Directed Energy Weapons are the largest and fastest-growing segment, followed by Guidance Systems and Laser Sights/Designators/Rangefinders. The "Others" segment includes various niche applications. Each segment's growth projection, market size, and competitive dynamics are extensively analyzed in the full report.
Key Drivers of Military Laser Systems Industry Growth
The Military Laser Systems industry's growth is driven by several factors: increasing defense budgets, particularly in major military powers; the escalating demand for precise targeting and engagement capabilities; the development of increasingly sophisticated directed energy weapons; and technological advancements in laser technology, resulting in higher power, better beam quality, and more compact systems. Furthermore, stringent regulatory requirements related to weapon systems modernization further fuel market growth.
Challenges in the Military Laser Systems Industry Sector
The Military Laser Systems industry faces challenges such as high R&D costs, the complexity of integrating laser systems into existing military platforms, and supply chain vulnerabilities affecting critical components. Stringent export controls and regulatory hurdles also limit market access and growth. Additionally, the competitive landscape is intense, with established players facing competition from new entrants and disruptive technologies. These challenges may result in a xx% reduction in projected market growth if not addressed effectively.
Emerging Opportunities in Military Laser Systems Industry
Emerging opportunities include the development of smaller, more energy-efficient laser systems for unmanned aerial vehicles (UAVs) and other platforms; the integration of artificial intelligence and machine learning for improved targeting and autonomous operation; and the expansion into new applications such as counter-drone systems and laser communications. The increasing use of laser-based systems in asymmetric warfare scenarios also presents promising opportunities.
Leading Players in the Military Laser Systems Industry Market
- THALES
- Leidos Inc
- Rheinmetall AG
- Elbit Systems Ltd
- Lockheed Martin Corporation
- MBDA
- IAI
- Rafael Advanced Defense Systems Ltd
- RTX Corporation
- BAE Systems plc
- Northrop Grumman Corporation
- The Boeing Company
Key Developments in Military Laser Systems Industry
- June 2023: RTX Corporation delivered the fourth combat-ready laser weapon to the US Air Force. This 10 KW laser is a significant advancement in stand-alone, mobile laser weapon technology.
- April 2023: The US Department of Defence (DoD) awarded NUBURU Inc. a contract for developing solid-state high-energy laser (HEL) weapon systems, boosting the development of high-power blue lasers.
- March 2023: Blighter Surveillance Systems secured a contract to supply Raytheon UK with radars for a laser weapon project with the UK MoD, highlighting collaboration in laser weapon development.
Future Outlook for Military Laser Systems Industry Market
The Military Laser Systems market is poised for sustained growth, driven by continuous technological advancements, increasing defense budgets, and the growing demand for precision-guided munitions and directed energy weapons. Strategic partnerships and acquisitions will continue shaping the market landscape, further fueling innovation and market expansion. The integration of AI and improved energy efficiency will open new application avenues and contribute to the market's overall growth trajectory.
Military Laser Systems Industry Segmentation
-
1. Technology
- 1.1. Solid-state Lasers
- 1.2. Gas Lasers
- 1.3. Other Technologies
-
2. Application
- 2.1. Directed Energy Weapons
- 2.2. Guidance Systems
- 2.3. Laser Sights, Designators, and Rangefinders
- 2.4. Other Applications
Military Laser Systems Industry Segmentation By Geography
-
1. North America
- 1.1. United States
- 1.2. Canada
-
2. Europe
- 2.1. United Kingdom
- 2.2. Germany
- 2.3. France
- 2.4. Italy
- 2.5. Russia
- 2.6. Rest of Europe
-
3. Asia Pacific
- 3.1. China
- 3.2. India
- 3.3. Japan
- 3.4. South Korea
- 3.5. Rest of Asia Pacific
-
4. Latin America
- 4.1. Brazil
- 4.2. Rest of Latin America
-
5. Middle East and Africa
- 5.1. United Arab Emirates
- 5.2. Saudi Arabia
- 5.3. Israel
- 5.4. Rest of Middle East and Africa
Military Laser Systems Industry REPORT HIGHLIGHTS
| Aspects | Details |
|---|---|
| Study Period | 2019-2033 |
| Base Year | 2024 |
| Estimated Year | 2025 |
| Forecast Period | 2025-2033 |
| Historical Period | 2019-2024 |
| Growth Rate | CAGR of 9.09% from 2019-2033 |
| Segmentation |
|
Table of Contents
- 1. Introduction
- 1.1. Research Scope
- 1.2. Market Segmentation
- 1.3. Research Methodology
- 1.4. Definitions and Assumptions
- 2. Executive Summary
- 2.1. Introduction
- 3. Market Dynamics
- 3.1. Introduction
- 3.2. Market Drivers
- 3.2.1. Increase in Internet of Things (IoT) and Autonomous Systems; Rise in Demand for Military and Defense Satellite Communication Solutions
- 3.3. Market Restrains
- 3.3.1. Cybersecurity Threats to Satellite Communication; Interference in Transmission of Data
- 3.4. Market Trends
- 3.4.1. Directed Energy Weapons Segment Projected to Exhibit the Highest CAGR During the Forecast Period
- 4. Market Factor Analysis
- 4.1. Porters Five Forces
- 4.2. Supply/Value Chain
- 4.3. PESTEL analysis
- 4.4. Market Entropy
- 4.5. Patent/Trademark Analysis
- 5. Global Military Laser Systems Industry Analysis, Insights and Forecast, 2019-2031
- 5.1. Market Analysis, Insights and Forecast - by Technology
- 5.1.1. Solid-state Lasers
- 5.1.2. Gas Lasers
- 5.1.3. Other Technologies
- 5.2. Market Analysis, Insights and Forecast - by Application
- 5.2.1. Directed Energy Weapons
- 5.2.2. Guidance Systems
- 5.2.3. Laser Sights, Designators, and Rangefinders
- 5.2.4. Other Applications
- 5.3. Market Analysis, Insights and Forecast - by Region
- 5.3.1. North America
- 5.3.2. Europe
- 5.3.3. Asia Pacific
- 5.3.4. Latin America
- 5.3.5. Middle East and Africa
- 5.1. Market Analysis, Insights and Forecast - by Technology
- 6. North America Military Laser Systems Industry Analysis, Insights and Forecast, 2019-2031
- 6.1. Market Analysis, Insights and Forecast - by Technology
- 6.1.1. Solid-state Lasers
- 6.1.2. Gas Lasers
- 6.1.3. Other Technologies
- 6.2. Market Analysis, Insights and Forecast - by Application
- 6.2.1. Directed Energy Weapons
- 6.2.2. Guidance Systems
- 6.2.3. Laser Sights, Designators, and Rangefinders
- 6.2.4. Other Applications
- 6.1. Market Analysis, Insights and Forecast - by Technology
- 7. Europe Military Laser Systems Industry Analysis, Insights and Forecast, 2019-2031
- 7.1. Market Analysis, Insights and Forecast - by Technology
- 7.1.1. Solid-state Lasers
- 7.1.2. Gas Lasers
- 7.1.3. Other Technologies
- 7.2. Market Analysis, Insights and Forecast - by Application
- 7.2.1. Directed Energy Weapons
- 7.2.2. Guidance Systems
- 7.2.3. Laser Sights, Designators, and Rangefinders
- 7.2.4. Other Applications
- 7.1. Market Analysis, Insights and Forecast - by Technology
- 8. Asia Pacific Military Laser Systems Industry Analysis, Insights and Forecast, 2019-2031
- 8.1. Market Analysis, Insights and Forecast - by Technology
- 8.1.1. Solid-state Lasers
- 8.1.2. Gas Lasers
- 8.1.3. Other Technologies
- 8.2. Market Analysis, Insights and Forecast - by Application
- 8.2.1. Directed Energy Weapons
- 8.2.2. Guidance Systems
- 8.2.3. Laser Sights, Designators, and Rangefinders
- 8.2.4. Other Applications
- 8.1. Market Analysis, Insights and Forecast - by Technology
- 9. Latin America Military Laser Systems Industry Analysis, Insights and Forecast, 2019-2031
- 9.1. Market Analysis, Insights and Forecast - by Technology
- 9.1.1. Solid-state Lasers
- 9.1.2. Gas Lasers
- 9.1.3. Other Technologies
- 9.2. Market Analysis, Insights and Forecast - by Application
- 9.2.1. Directed Energy Weapons
- 9.2.2. Guidance Systems
- 9.2.3. Laser Sights, Designators, and Rangefinders
- 9.2.4. Other Applications
- 9.1. Market Analysis, Insights and Forecast - by Technology
- 10. Middle East and Africa Military Laser Systems Industry Analysis, Insights and Forecast, 2019-2031
- 10.1. Market Analysis, Insights and Forecast - by Technology
- 10.1.1. Solid-state Lasers
- 10.1.2. Gas Lasers
- 10.1.3. Other Technologies
- 10.2. Market Analysis, Insights and Forecast - by Application
- 10.2.1. Directed Energy Weapons
- 10.2.2. Guidance Systems
- 10.2.3. Laser Sights, Designators, and Rangefinders
- 10.2.4. Other Applications
- 10.1. Market Analysis, Insights and Forecast - by Technology
- 11. North America Military Laser Systems Industry Analysis, Insights and Forecast, 2019-2031
- 11.1. Market Analysis, Insights and Forecast - By Country/Sub-region
- 11.1.1 United States
- 11.1.2 Canada
- 12. Europe Military Laser Systems Industry Analysis, Insights and Forecast, 2019-2031
- 12.1. Market Analysis, Insights and Forecast - By Country/Sub-region
- 12.1.1 United Kingdom
- 12.1.2 Germany
- 12.1.3 France
- 12.1.4 Italy
- 12.1.5 Russia
- 12.1.6 Rest of Europe
- 13. Asia Pacific Military Laser Systems Industry Analysis, Insights and Forecast, 2019-2031
- 13.1. Market Analysis, Insights and Forecast - By Country/Sub-region
- 13.1.1 China
- 13.1.2 India
- 13.1.3 Japan
- 13.1.4 South Korea
- 13.1.5 Rest of Asia Pacific
- 14. Latin America Military Laser Systems Industry Analysis, Insights and Forecast, 2019-2031
- 14.1. Market Analysis, Insights and Forecast - By Country/Sub-region
- 14.1.1 Brazil
- 14.1.2 Rest of Latin America
- 15. Middle East and Africa Military Laser Systems Industry Analysis, Insights and Forecast, 2019-2031
- 15.1. Market Analysis, Insights and Forecast - By Country/Sub-region
- 15.1.1 United Arab Emirates
- 15.1.2 Saudi Arabia
- 15.1.3 Israel
- 15.1.4 Rest of Middle East and Africa
- 16. Competitive Analysis
- 16.1. Global Market Share Analysis 2024
- 16.2. Company Profiles
- 16.2.1 THALES
- 16.2.1.1. Overview
- 16.2.1.2. Products
- 16.2.1.3. SWOT Analysis
- 16.2.1.4. Recent Developments
- 16.2.1.5. Financials (Based on Availability)
- 16.2.2 Leidos Inc
- 16.2.2.1. Overview
- 16.2.2.2. Products
- 16.2.2.3. SWOT Analysis
- 16.2.2.4. Recent Developments
- 16.2.2.5. Financials (Based on Availability)
- 16.2.3 Rheinmetall AG
- 16.2.3.1. Overview
- 16.2.3.2. Products
- 16.2.3.3. SWOT Analysis
- 16.2.3.4. Recent Developments
- 16.2.3.5. Financials (Based on Availability)
- 16.2.4 Elbit Systems Ltd
- 16.2.4.1. Overview
- 16.2.4.2. Products
- 16.2.4.3. SWOT Analysis
- 16.2.4.4. Recent Developments
- 16.2.4.5. Financials (Based on Availability)
- 16.2.5 Lockheed Martin Corporation
- 16.2.5.1. Overview
- 16.2.5.2. Products
- 16.2.5.3. SWOT Analysis
- 16.2.5.4. Recent Developments
- 16.2.5.5. Financials (Based on Availability)
- 16.2.6 MBDA
- 16.2.6.1. Overview
- 16.2.6.2. Products
- 16.2.6.3. SWOT Analysis
- 16.2.6.4. Recent Developments
- 16.2.6.5. Financials (Based on Availability)
- 16.2.7 IAI
- 16.2.7.1. Overview
- 16.2.7.2. Products
- 16.2.7.3. SWOT Analysis
- 16.2.7.4. Recent Developments
- 16.2.7.5. Financials (Based on Availability)
- 16.2.8 Rafael Advanced Defense Systems Ltd
- 16.2.8.1. Overview
- 16.2.8.2. Products
- 16.2.8.3. SWOT Analysis
- 16.2.8.4. Recent Developments
- 16.2.8.5. Financials (Based on Availability)
- 16.2.9 RTX Corporation
- 16.2.9.1. Overview
- 16.2.9.2. Products
- 16.2.9.3. SWOT Analysis
- 16.2.9.4. Recent Developments
- 16.2.9.5. Financials (Based on Availability)
- 16.2.10 BAE Systems plc
- 16.2.10.1. Overview
- 16.2.10.2. Products
- 16.2.10.3. SWOT Analysis
- 16.2.10.4. Recent Developments
- 16.2.10.5. Financials (Based on Availability)
- 16.2.11 Northrop Grumman Corporation
- 16.2.11.1. Overview
- 16.2.11.2. Products
- 16.2.11.3. SWOT Analysis
- 16.2.11.4. Recent Developments
- 16.2.11.5. Financials (Based on Availability)
- 16.2.12 The Boeing Company
- 16.2.12.1. Overview
- 16.2.12.2. Products
- 16.2.12.3. SWOT Analysis
- 16.2.12.4. Recent Developments
- 16.2.12.5. Financials (Based on Availability)
- 16.2.1 THALES
List of Figures
- Figure 1: Global Military Laser Systems Industry Revenue Breakdown (Million, %) by Region 2024 & 2032
- Figure 2: North America Military Laser Systems Industry Revenue (Million), by Country 2024 & 2032
- Figure 3: North America Military Laser Systems Industry Revenue Share (%), by Country 2024 & 2032
- Figure 4: Europe Military Laser Systems Industry Revenue (Million), by Country 2024 & 2032
- Figure 5: Europe Military Laser Systems Industry Revenue Share (%), by Country 2024 & 2032
- Figure 6: Asia Pacific Military Laser Systems Industry Revenue (Million), by Country 2024 & 2032
- Figure 7: Asia Pacific Military Laser Systems Industry Revenue Share (%), by Country 2024 & 2032
- Figure 8: Latin America Military Laser Systems Industry Revenue (Million), by Country 2024 & 2032
- Figure 9: Latin America Military Laser Systems Industry Revenue Share (%), by Country 2024 & 2032
- Figure 10: Middle East and Africa Military Laser Systems Industry Revenue (Million), by Country 2024 & 2032
- Figure 11: Middle East and Africa Military Laser Systems Industry Revenue Share (%), by Country 2024 & 2032
- Figure 12: North America Military Laser Systems Industry Revenue (Million), by Technology 2024 & 2032
- Figure 13: North America Military Laser Systems Industry Revenue Share (%), by Technology 2024 & 2032
- Figure 14: North America Military Laser Systems Industry Revenue (Million), by Application 2024 & 2032
- Figure 15: North America Military Laser Systems Industry Revenue Share (%), by Application 2024 & 2032
- Figure 16: North America Military Laser Systems Industry Revenue (Million), by Country 2024 & 2032
- Figure 17: North America Military Laser Systems Industry Revenue Share (%), by Country 2024 & 2032
- Figure 18: Europe Military Laser Systems Industry Revenue (Million), by Technology 2024 & 2032
- Figure 19: Europe Military Laser Systems Industry Revenue Share (%), by Technology 2024 & 2032
- Figure 20: Europe Military Laser Systems Industry Revenue (Million), by Application 2024 & 2032
- Figure 21: Europe Military Laser Systems Industry Revenue Share (%), by Application 2024 & 2032
- Figure 22: Europe Military Laser Systems Industry Revenue (Million), by Country 2024 & 2032
- Figure 23: Europe Military Laser Systems Industry Revenue Share (%), by Country 2024 & 2032
- Figure 24: Asia Pacific Military Laser Systems Industry Revenue (Million), by Technology 2024 & 2032
- Figure 25: Asia Pacific Military Laser Systems Industry Revenue Share (%), by Technology 2024 & 2032
- Figure 26: Asia Pacific Military Laser Systems Industry Revenue (Million), by Application 2024 & 2032
- Figure 27: Asia Pacific Military Laser Systems Industry Revenue Share (%), by Application 2024 & 2032
- Figure 28: Asia Pacific Military Laser Systems Industry Revenue (Million), by Country 2024 & 2032
- Figure 29: Asia Pacific Military Laser Systems Industry Revenue Share (%), by Country 2024 & 2032
- Figure 30: Latin America Military Laser Systems Industry Revenue (Million), by Technology 2024 & 2032
- Figure 31: Latin America Military Laser Systems Industry Revenue Share (%), by Technology 2024 & 2032
- Figure 32: Latin America Military Laser Systems Industry Revenue (Million), by Application 2024 & 2032
- Figure 33: Latin America Military Laser Systems Industry Revenue Share (%), by Application 2024 & 2032
- Figure 34: Latin America Military Laser Systems Industry Revenue (Million), by Country 2024 & 2032
- Figure 35: Latin America Military Laser Systems Industry Revenue Share (%), by Country 2024 & 2032
- Figure 36: Middle East and Africa Military Laser Systems Industry Revenue (Million), by Technology 2024 & 2032
- Figure 37: Middle East and Africa Military Laser Systems Industry Revenue Share (%), by Technology 2024 & 2032
- Figure 38: Middle East and Africa Military Laser Systems Industry Revenue (Million), by Application 2024 & 2032
- Figure 39: Middle East and Africa Military Laser Systems Industry Revenue Share (%), by Application 2024 & 2032
- Figure 40: Middle East and Africa Military Laser Systems Industry Revenue (Million), by Country 2024 & 2032
- Figure 41: Middle East and Africa Military Laser Systems Industry Revenue Share (%), by Country 2024 & 2032
List of Tables
- Table 1: Global Military Laser Systems Industry Revenue Million Forecast, by Region 2019 & 2032
- Table 2: Global Military Laser Systems Industry Revenue Million Forecast, by Technology 2019 & 2032
- Table 3: Global Military Laser Systems Industry Revenue Million Forecast, by Application 2019 & 2032
- Table 4: Global Military Laser Systems Industry Revenue Million Forecast, by Region 2019 & 2032
- Table 5: Global Military Laser Systems Industry Revenue Million Forecast, by Country 2019 & 2032
- Table 6: United States Military Laser Systems Industry Revenue (Million) Forecast, by Application 2019 & 2032
- Table 7: Canada Military Laser Systems Industry Revenue (Million) Forecast, by Application 2019 & 2032
- Table 8: Global Military Laser Systems Industry Revenue Million Forecast, by Country 2019 & 2032
- Table 9: United Kingdom Military Laser Systems Industry Revenue (Million) Forecast, by Application 2019 & 2032
- Table 10: Germany Military Laser Systems Industry Revenue (Million) Forecast, by Application 2019 & 2032
- Table 11: France Military Laser Systems Industry Revenue (Million) Forecast, by Application 2019 & 2032
- Table 12: Italy Military Laser Systems Industry Revenue (Million) Forecast, by Application 2019 & 2032
- Table 13: Russia Military Laser Systems Industry Revenue (Million) Forecast, by Application 2019 & 2032
- Table 14: Rest of Europe Military Laser Systems Industry Revenue (Million) Forecast, by Application 2019 & 2032
- Table 15: Global Military Laser Systems Industry Revenue Million Forecast, by Country 2019 & 2032
- Table 16: China Military Laser Systems Industry Revenue (Million) Forecast, by Application 2019 & 2032
- Table 17: India Military Laser Systems Industry Revenue (Million) Forecast, by Application 2019 & 2032
- Table 18: Japan Military Laser Systems Industry Revenue (Million) Forecast, by Application 2019 & 2032
- Table 19: South Korea Military Laser Systems Industry Revenue (Million) Forecast, by Application 2019 & 2032
- Table 20: Rest of Asia Pacific Military Laser Systems Industry Revenue (Million) Forecast, by Application 2019 & 2032
- Table 21: Global Military Laser Systems Industry Revenue Million Forecast, by Country 2019 & 2032
- Table 22: Brazil Military Laser Systems Industry Revenue (Million) Forecast, by Application 2019 & 2032
- Table 23: Rest of Latin America Military Laser Systems Industry Revenue (Million) Forecast, by Application 2019 & 2032
- Table 24: Global Military Laser Systems Industry Revenue Million Forecast, by Country 2019 & 2032
- Table 25: United Arab Emirates Military Laser Systems Industry Revenue (Million) Forecast, by Application 2019 & 2032
- Table 26: Saudi Arabia Military Laser Systems Industry Revenue (Million) Forecast, by Application 2019 & 2032
- Table 27: Israel Military Laser Systems Industry Revenue (Million) Forecast, by Application 2019 & 2032
- Table 28: Rest of Middle East and Africa Military Laser Systems Industry Revenue (Million) Forecast, by Application 2019 & 2032
- Table 29: Global Military Laser Systems Industry Revenue Million Forecast, by Technology 2019 & 2032
- Table 30: Global Military Laser Systems Industry Revenue Million Forecast, by Application 2019 & 2032
- Table 31: Global Military Laser Systems Industry Revenue Million Forecast, by Country 2019 & 2032
- Table 32: United States Military Laser Systems Industry Revenue (Million) Forecast, by Application 2019 & 2032
- Table 33: Canada Military Laser Systems Industry Revenue (Million) Forecast, by Application 2019 & 2032
- Table 34: Global Military Laser Systems Industry Revenue Million Forecast, by Technology 2019 & 2032
- Table 35: Global Military Laser Systems Industry Revenue Million Forecast, by Application 2019 & 2032
- Table 36: Global Military Laser Systems Industry Revenue Million Forecast, by Country 2019 & 2032
- Table 37: United Kingdom Military Laser Systems Industry Revenue (Million) Forecast, by Application 2019 & 2032
- Table 38: Germany Military Laser Systems Industry Revenue (Million) Forecast, by Application 2019 & 2032
- Table 39: France Military Laser Systems Industry Revenue (Million) Forecast, by Application 2019 & 2032
- Table 40: Italy Military Laser Systems Industry Revenue (Million) Forecast, by Application 2019 & 2032
- Table 41: Russia Military Laser Systems Industry Revenue (Million) Forecast, by Application 2019 & 2032
- Table 42: Rest of Europe Military Laser Systems Industry Revenue (Million) Forecast, by Application 2019 & 2032
- Table 43: Global Military Laser Systems Industry Revenue Million Forecast, by Technology 2019 & 2032
- Table 44: Global Military Laser Systems Industry Revenue Million Forecast, by Application 2019 & 2032
- Table 45: Global Military Laser Systems Industry Revenue Million Forecast, by Country 2019 & 2032
- Table 46: China Military Laser Systems Industry Revenue (Million) Forecast, by Application 2019 & 2032
- Table 47: India Military Laser Systems Industry Revenue (Million) Forecast, by Application 2019 & 2032
- Table 48: Japan Military Laser Systems Industry Revenue (Million) Forecast, by Application 2019 & 2032
- Table 49: South Korea Military Laser Systems Industry Revenue (Million) Forecast, by Application 2019 & 2032
- Table 50: Rest of Asia Pacific Military Laser Systems Industry Revenue (Million) Forecast, by Application 2019 & 2032
- Table 51: Global Military Laser Systems Industry Revenue Million Forecast, by Technology 2019 & 2032
- Table 52: Global Military Laser Systems Industry Revenue Million Forecast, by Application 2019 & 2032
- Table 53: Global Military Laser Systems Industry Revenue Million Forecast, by Country 2019 & 2032
- Table 54: Brazil Military Laser Systems Industry Revenue (Million) Forecast, by Application 2019 & 2032
- Table 55: Rest of Latin America Military Laser Systems Industry Revenue (Million) Forecast, by Application 2019 & 2032
- Table 56: Global Military Laser Systems Industry Revenue Million Forecast, by Technology 2019 & 2032
- Table 57: Global Military Laser Systems Industry Revenue Million Forecast, by Application 2019 & 2032
- Table 58: Global Military Laser Systems Industry Revenue Million Forecast, by Country 2019 & 2032
- Table 59: United Arab Emirates Military Laser Systems Industry Revenue (Million) Forecast, by Application 2019 & 2032
- Table 60: Saudi Arabia Military Laser Systems Industry Revenue (Million) Forecast, by Application 2019 & 2032
- Table 61: Israel Military Laser Systems Industry Revenue (Million) Forecast, by Application 2019 & 2032
- Table 62: Rest of Middle East and Africa Military Laser Systems Industry Revenue (Million) Forecast, by Application 2019 & 2032
Frequently Asked Questions
1. What is the projected Compound Annual Growth Rate (CAGR) of the Military Laser Systems Industry?
The projected CAGR is approximately 9.09%.
2. Which companies are prominent players in the Military Laser Systems Industry?
Key companies in the market include THALES, Leidos Inc, Rheinmetall AG, Elbit Systems Ltd, Lockheed Martin Corporation, MBDA, IAI, Rafael Advanced Defense Systems Ltd, RTX Corporation, BAE Systems plc, Northrop Grumman Corporation, The Boeing Company.
3. What are the main segments of the Military Laser Systems Industry?
The market segments include Technology, Application.
4. Can you provide details about the market size?
The market size is estimated to be USD 5.57 Million as of 2022.
5. What are some drivers contributing to market growth?
Increase in Internet of Things (IoT) and Autonomous Systems; Rise in Demand for Military and Defense Satellite Communication Solutions.
6. What are the notable trends driving market growth?
Directed Energy Weapons Segment Projected to Exhibit the Highest CAGR During the Forecast Period.
7. Are there any restraints impacting market growth?
Cybersecurity Threats to Satellite Communication; Interference in Transmission of Data.
8. Can you provide examples of recent developments in the market?
June 2023: RTX Corporation delivered the fourth combat-ready laser weapon to the US Air Force. The new palletized laser weapon was the first 10 KW laser built to US military specifications in a stand-alone configuration that can be moved and mounted anywhere it's needed.
9. What pricing options are available for accessing the report?
Pricing options include single-user, multi-user, and enterprise licenses priced at USD 4750, USD 5250, and USD 8750 respectively.
10. Is the market size provided in terms of value or volume?
The market size is provided in terms of value, measured in Million.
11. Are there any specific market keywords associated with the report?
Yes, the market keyword associated with the report is "Military Laser Systems Industry," which aids in identifying and referencing the specific market segment covered.
12. How do I determine which pricing option suits my needs best?
The pricing options vary based on user requirements and access needs. Individual users may opt for single-user licenses, while businesses requiring broader access may choose multi-user or enterprise licenses for cost-effective access to the report.
13. Are there any additional resources or data provided in the Military Laser Systems Industry report?
While the report offers comprehensive insights, it's advisable to review the specific contents or supplementary materials provided to ascertain if additional resources or data are available.
14. How can I stay updated on further developments or reports in the Military Laser Systems Industry?
To stay informed about further developments, trends, and reports in the Military Laser Systems Industry, consider subscribing to industry newsletters, following relevant companies and organizations, or regularly checking reputable industry news sources and publications.
Methodology
Step 1 - Identification of Relevant Samples Size from Population Database


Step 2 - Approaches for Defining Global Market Size (Value, Volume* & Price*)

Note*: In applicable scenarios
Step 3 - Data Sources
Primary Research
- Web Analytics
- Survey Reports
- Research Institute
- Latest Research Reports
- Opinion Leaders
Secondary Research
- Annual Reports
- White Paper
- Latest Press Release
- Industry Association
- Paid Database
- Investor Presentations

Step 4 - Data Triangulation
Involves using different sources of information in order to increase the validity of a study
These sources are likely to be stakeholders in a program - participants, other researchers, program staff, other community members, and so on.
Then we put all data in single framework & apply various statistical tools to find out the dynamic on the market.
During the analysis stage, feedback from the stakeholder groups would be compared to determine areas of agreement as well as areas of divergence


