Key Insights
The global market for Money Saving Apps is experiencing remarkable growth, reaching an estimated $1.21 billion in 2024. This surge is fueled by an anticipated Compound Annual Growth Rate (CAGR) of 18.4% through 2033, indicating a robust and expanding sector. Key drivers behind this expansion include the increasing adoption of digital financial tools, a heightened consumer focus on personal finance management, and the growing demand for accessible and user-friendly solutions to track spending, budget effectively, and optimize savings. The proliferation of smartphones and the convenience offered by these applications have made them indispensable for a wide demographic seeking financial control.
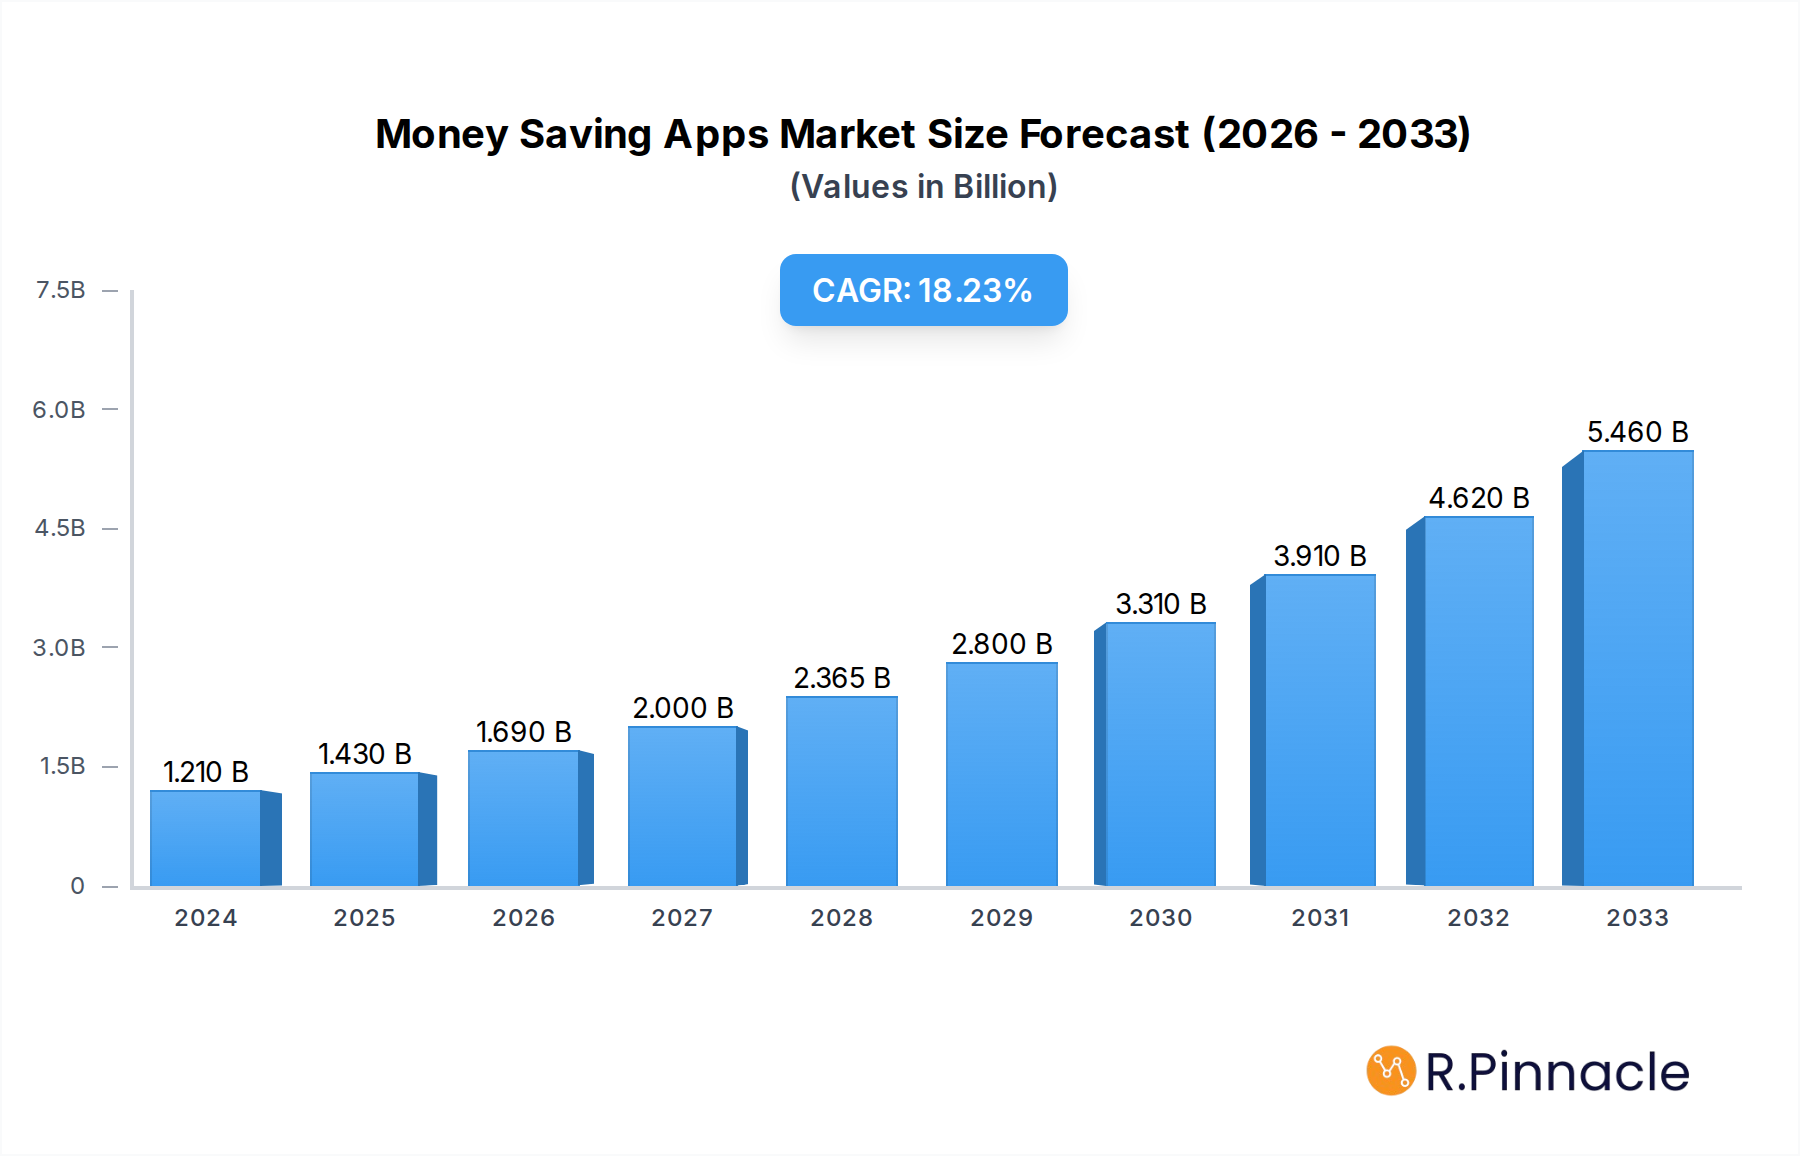
Money Saving Apps Market Size (In Billion)
The market is segmented across various applications, with Investment Accounts, Retirement Accounts, and Checking Accounts emerging as dominant segments, reflecting a broader financial planning trend. Debit Card functionalities are also significant, indicating a blend of spending and saving tools. Within app types, the "Pro Version" is likely to see substantial traction as users become more sophisticated in their financial management needs, seeking advanced features. Leading companies like Oportun, Chime, Acorns, and Rocket Money are at the forefront, driving innovation and user engagement. Geographically, North America currently dominates, but the Asia Pacific region, with its burgeoning middle class and increasing digital penetration, presents a significant growth opportunity. Trends such as the integration of AI for personalized financial advice, gamification of savings, and the rise of embedded finance within e-commerce platforms are shaping the future of this dynamic market.

Money Saving Apps Company Market Share
This comprehensive report offers an in-depth analysis of the burgeoning Money Saving Apps market, projecting a global valuation of over XXX billion USD by 2033. Spanning a study period from 2019 to 2033, with a base and estimated year of 2025 and a forecast period of 2025-2033, this report is an indispensable resource for industry professionals, investors, and financial institutions seeking to navigate this dynamic landscape. We delve into market structure, cutting-edge innovations, prevailing trends, dominant regions, pivotal product developments, critical growth drivers, emerging challenges, and future opportunities within the money-saving app ecosystem. Leveraging advanced analytical methodologies, this report provides actionable insights, strategic recommendations, and precise market valuations to inform your business decisions.
Money Saving Apps Market Structure & Innovation Trends
The Money Saving Apps market exhibits a dynamic structure characterized by increasing competition and continuous innovation. Market concentration varies across sub-segments, with established players holding significant shares in core areas like checking accounts and debit cards, while emerging players are actively carving out niches in investment and retirement accounts. Innovation drivers are primarily fueled by advancements in AI-driven personalization, enhanced user experience (UX), and the integration of gamification to foster sustained engagement. Regulatory frameworks, while generally supportive of financial technology, present evolving compliance landscapes that necessitate strategic adaptation. Product substitutes, though present in traditional banking channels, are rapidly losing ground to the convenience and accessibility offered by mobile applications. End-user demographics are broad, encompassing millennials, Gen Z, and increasingly, older demographics seeking to manage their finances more effectively. Mergers and acquisitions (M&A) activities are expected to rise, with an estimated deal value of over XXX billion USD during the forecast period, as larger entities seek to acquire innovative technologies and expand their user base. Key M&A targets include platforms with strong community engagement and unique value-added services.
- Market Share Dynamics: The market is fragmented, with the top 5 players holding approximately 60% of the market share for basic versions, while specialized apps command higher shares in niche segments.
- Innovation Drivers: AI-powered budgeting, automated savings, gamified financial education, and seamless integration with other financial services.
- Regulatory Landscape: Evolving data privacy regulations (e.g., GDPR, CCPA) and open banking initiatives are shaping product development and market entry strategies.
- Product Substitutes: Traditional banking, manual budgeting, and financial advisory services.
- End-User Demographics: Predominantly tech-savvy individuals aged 18-55, with a growing adoption among older age groups.
- M&A Activities: Strategic acquisitions to gain market share, acquire innovative technology, and expand service portfolios. Estimated M&A deal value in the billions of dollars annually.
Money Saving Apps Market Dynamics & Trends
The global Money Saving Apps market is poised for substantial expansion, driven by a confluence of technological advancements, evolving consumer behaviors, and an increasing emphasis on financial literacy. The projected Compound Annual Growth Rate (CAGR) for the forecast period (2025–2033) is an impressive XX.XX%, with the market valuation expected to surge from an estimated XXX billion USD in 2025 to over XXX billion USD by 2033. This robust growth is primarily attributed to the escalating adoption of smartphones and the pervasive internet penetration worldwide, creating fertile ground for digital financial solutions. Consumer preferences are increasingly leaning towards personalized financial management tools that offer convenience, security, and the ability to track spending in real-time. Features such as automated savings, intelligent budgeting recommendations, and investment opportunities directly within a single app are highly sought after.
Technological disruptions, particularly the advancement of Artificial Intelligence (AI) and Machine Learning (ML), are revolutionizing the user experience. These technologies enable apps to provide sophisticated analytics, predictive insights into spending patterns, and tailored advice, making financial planning more accessible and effective. The integration of blockchain technology for enhanced security and transparency is also gaining traction, building greater trust among users. The competitive landscape is intensifying, with a continuous influx of new players and existing ones diversifying their offerings. Companies are focusing on differentiating themselves through unique features, competitive pricing, and superior customer support. The market penetration of money-saving apps is projected to reach over XX% by 2033, indicating a significant shift from traditional financial management methods. The rise of challenger banks and fintech startups has democratized access to financial services, empowering individuals to take greater control of their financial future. Furthermore, the growing awareness around personal finance management, amplified by social media and educational content, is a significant tailwind for market growth. The demand for micro-investing and round-up features, which allow users to save small amounts of money effortlessly, continues to be a major trend. The increasing focus on financial inclusion also presents a substantial opportunity, as these apps can cater to underserved populations who may lack access to traditional banking services. The seamless integration of these apps with e-commerce platforms and loyalty programs further enhances their utility and adoption rates.
Dominant Regions & Segments in Money Saving Apps
North America is poised to maintain its dominance in the Money Saving Apps market, driven by high disposable incomes, advanced technological infrastructure, and a strong consumer inclination towards digital financial solutions. The United States, in particular, represents a significant portion of this market, with a substantial number of users actively engaging with various money-saving applications. Factors such as robust economic policies supporting financial innovation, widespread smartphone adoption, and a mature digital payments ecosystem contribute to this regional leadership.
Within the Application segment, the Checking Account category is expected to hold the largest market share, driven by the fundamental need for everyday banking and transaction management. Money saving apps that offer enhanced features like interest-bearing accounts, low or no fees, and seamless integration with budgeting tools are particularly popular. Following closely is the Debit Card segment, which benefits from the widespread use of debit cards for daily purchases and the integration of cashback rewards and spending tracking features within associated apps. The Investment Account segment is experiencing rapid growth, fueled by a younger demographic's interest in accessible and user-friendly investment platforms, often with low minimum investment requirements and automated investment options. The Retirement Account segment, while a smaller share currently, is projected to witness significant growth as individuals increasingly prioritize long-term financial planning and seek convenient ways to save for retirement. The "Others" category, encompassing a wide range of specialized savings and budgeting tools, also contributes to market diversification.
In terms of Types, the Basic Version of money-saving apps currently holds a larger market share due to its accessibility and broad appeal. However, the Pro Version is anticipated to experience a higher growth rate. This is attributed to users seeking more advanced features, personalized insights, premium support, and exclusive benefits, justifying a subscription fee for enhanced financial management capabilities. The Pro versions often integrate sophisticated analytical tools, advanced budgeting features, and prioritized customer service, appealing to users who are more serious about optimizing their financial health.
- Dominant Region: North America (United States leading).
- Key Drivers: High disposable income, advanced digital infrastructure, strong consumer adoption of fintech.
- Economic Policies: Favorable regulatory environment for fintech innovation, government initiatives promoting financial literacy.
- Infrastructure: Widespread high-speed internet, ubiquitous smartphone penetration.
- Leading Application Segment: Checking Account.
- Dominance Analysis: Essential for daily financial management, high transaction volumes, integration with other financial services.
- Growth Drivers: Demand for fee-free options, interest-bearing accounts, seamless budgeting integration.
- Leading Application Segment: Debit Card.
- Dominance Analysis: Primary payment method for many consumers, integration with loyalty programs and cashback rewards.
- Growth Drivers: Enhanced spending tracking, fraud protection, seamless integration with budgeting and saving features.
- High-Growth Application Segment: Investment Account.
- Dominance Analysis: Democratization of investing, low-barrier entry for novice investors, automated investment strategies.
- Growth Drivers: Rise of micro-investing, fractional shares, accessible portfolio management.
- High-Growth Application Segment: Retirement Account.
- Dominance Analysis: Increasing focus on long-term financial security, demand for automated retirement planning tools.
- Growth Drivers: Tax-advantaged accounts, personalized retirement planning guidance, integration with employer-sponsored plans.
- Dominant Type: Basic Version.
- Dominance Analysis: Wide accessibility, free or low-cost entry point, appeals to a broad user base.
- Growth Drivers: Ease of use, essential money-saving functionalities.
- High-Growth Type: Pro Version.
- Dominance Analysis: Offers advanced features, personalized insights, premium support.
- Growth Drivers: Demand for sophisticated budgeting, AI-driven financial advice, enhanced reporting capabilities.
Money Saving Apps Product Innovations
The Money Saving Apps landscape is being redefined by a surge of innovative product developments. Companies are focusing on AI-driven personalized budgeting that adapts to individual spending habits, automated savings "round-up" features that discreetly tuck away spare change, and integrated investment tools offering fractional shares for as little as $1. Gamification elements, such as savings challenges and reward systems, are being incorporated to boost user engagement and encourage consistent saving behavior. These innovations create significant competitive advantages by offering unparalleled convenience, intuitive interfaces, and tangible financial benefits, effectively bridging the gap between complex financial management and everyday user needs.
Report Scope & Segmentation Analysis
This report provides a granular analysis of the Money Saving Apps market, segmented by Application and Type. The Application segments include Investment Account, Retirement Account, Checking Account, Debit Card, and Others. Growth projections for these segments indicate a strong upward trajectory, with Investment and Retirement Accounts expected to exhibit the highest CAGRs due to increasing financial literacy and a demand for accessible long-term planning tools. The Type segmentation encompasses Basic Version and Pro Version. While Basic versions currently dominate in user numbers due to their accessibility, Pro versions are projected to capture a larger market share by value as users seek advanced features and personalized financial guidance. Competitive dynamics within each segment are shaped by unique feature sets, pricing strategies, and user experience.
Key Drivers of Money Saving Apps Growth
The exponential growth of the Money Saving Apps market is propelled by several key factors. Technologically, the ubiquity of smartphones and the widespread availability of high-speed internet have created a fertile ground for digital financial solutions. Advancements in AI and machine learning enable personalized financial advice and automated savings, making money management more accessible and efficient. Economically, increasing disposable incomes in emerging economies and a global desire for financial security and wealth accumulation are driving demand. Individuals are seeking tools to navigate economic uncertainties, optimize their spending, and grow their savings. Regulatory environments, particularly those promoting open banking and fintech innovation, further catalyze growth by fostering competition and encouraging the development of user-centric financial products.
Challenges in the Money Saving Apps Sector
Despite the promising growth, the Money Saving Apps sector faces significant challenges. Regulatory hurdles, including evolving data privacy laws and varying compliance requirements across jurisdictions, can impede market expansion and necessitate costly adaptations. Cybersecurity threats and the constant need to safeguard sensitive financial data pose ongoing challenges, requiring robust security measures and continuous investment in protective technologies. Intense competition from a crowded marketplace can lead to price wars and difficulties in customer acquisition and retention. Furthermore, building and maintaining user trust, especially concerning the handling of financial information, remains a critical imperative. Supply chain issues are less directly relevant to the software-centric nature of apps, but the underlying cloud infrastructure and service providers can experience disruptions impacting availability.
Emerging Opportunities in Money Saving Apps
The Money Saving Apps market is ripe with emerging opportunities. The increasing demand for personalized financial wellness platforms, integrating budgeting, saving, investing, and even credit building, presents a significant avenue for growth. The untapped potential in emerging economies, where digital financial literacy is on the rise, offers vast new markets. Innovations in AI-powered financial coaching and predictive analytics can create highly engaging and effective user experiences. The integration of sustainable finance options, allowing users to invest in environmentally conscious companies, caters to a growing segment of socially responsible consumers. Furthermore, partnerships with employers to offer financial wellness programs to their employees represent a substantial B2B opportunity.
Leading Players in the Money Saving Apps Market
- Oportun
- Qapital
- Goodbudget
- Chime
- Current
- Acorns
- Rocket Money
- Allo
- Albert
- Digit
- Ibotta
- Fetch
- GoodRx
- Flashfood
- RatePunk
- Raise
- Rakuten
- Wise
Key Developments in Money Saving Apps Industry
- 2023/08: Acorns introduces enhanced fractional share investing options with lower minimums, broadening access to the stock market for younger investors.
- 2023/09: Chime partners with a major payroll provider to offer early direct deposit, a key feature for user acquisition and retention.
- 2024/01: Rocket Money launches an AI-powered subscription management feature, automatically identifying and cancelling underutilized services.
- 2024/03: Albert introduces a premium subscription tier offering personalized financial advice from human advisors, aiming to capture a more affluent user base.
- 2024/06: Rakuten announces integration with several new e-commerce platforms, expanding its cashback offerings and user reach.
- 2024/10: Ibotta acquires a competitor in the grocery rebate space, consolidating market share and expanding its merchant network.
- 2025/01: Goodbudget rolls out an advanced budgeting tool with predictive spending analysis, allowing users to forecast future financial needs.
- 2025/04: Fetch integrates with a popular rewards credit card, allowing users to earn points on qualifying purchases made through the app.
- 2025/07: Wise (formerly TransferWise) expands its international money transfer services to more countries, targeting freelancers and remote workers.
- 2025/11: Qapital enhances its round-up feature with customizable savings rules, offering greater flexibility for users.
Future Outlook for Money Saving Apps Market
The future outlook for the Money Saving Apps market is exceptionally bright, characterized by sustained growth and continuous innovation. The market is expected to evolve into a holistic financial wellness ecosystem, integrating savings, budgeting, investing, debt management, and even financial education under one roof. Advancements in AI will drive hyper-personalization, offering bespoke financial advice and automated strategies tailored to individual life goals. The increasing adoption of open banking will foster greater interoperability between financial institutions and fintech apps, creating seamless user experiences. Emerging markets will represent significant growth territories as digital financial literacy continues to expand. Strategic partnerships and potential consolidations will likely shape the competitive landscape, with a focus on delivering comprehensive value to users seeking to achieve financial security and prosperity.
Money Saving Apps Segmentation
-
1. Application
- 1.1. Investment Account
- 1.2. Retirement Account
- 1.3. Checking Account
- 1.4. Debit Card
- 1.5. Others
-
2. Types
- 2.1. Basic Version
- 2.2. Pro Version
Money Saving Apps Segmentation By Geography
-
1. North America
- 1.1. United States
- 1.2. Canada
- 1.3. Mexico
-
2. South America
- 2.1. Brazil
- 2.2. Argentina
- 2.3. Rest of South America
-
3. Europe
- 3.1. United Kingdom
- 3.2. Germany
- 3.3. France
- 3.4. Italy
- 3.5. Spain
- 3.6. Russia
- 3.7. Benelux
- 3.8. Nordics
- 3.9. Rest of Europe
-
4. Middle East & Africa
- 4.1. Turkey
- 4.2. Israel
- 4.3. GCC
- 4.4. North Africa
- 4.5. South Africa
- 4.6. Rest of Middle East & Africa
-
5. Asia Pacific
- 5.1. China
- 5.2. India
- 5.3. Japan
- 5.4. South Korea
- 5.5. ASEAN
- 5.6. Oceania
- 5.7. Rest of Asia Pacific
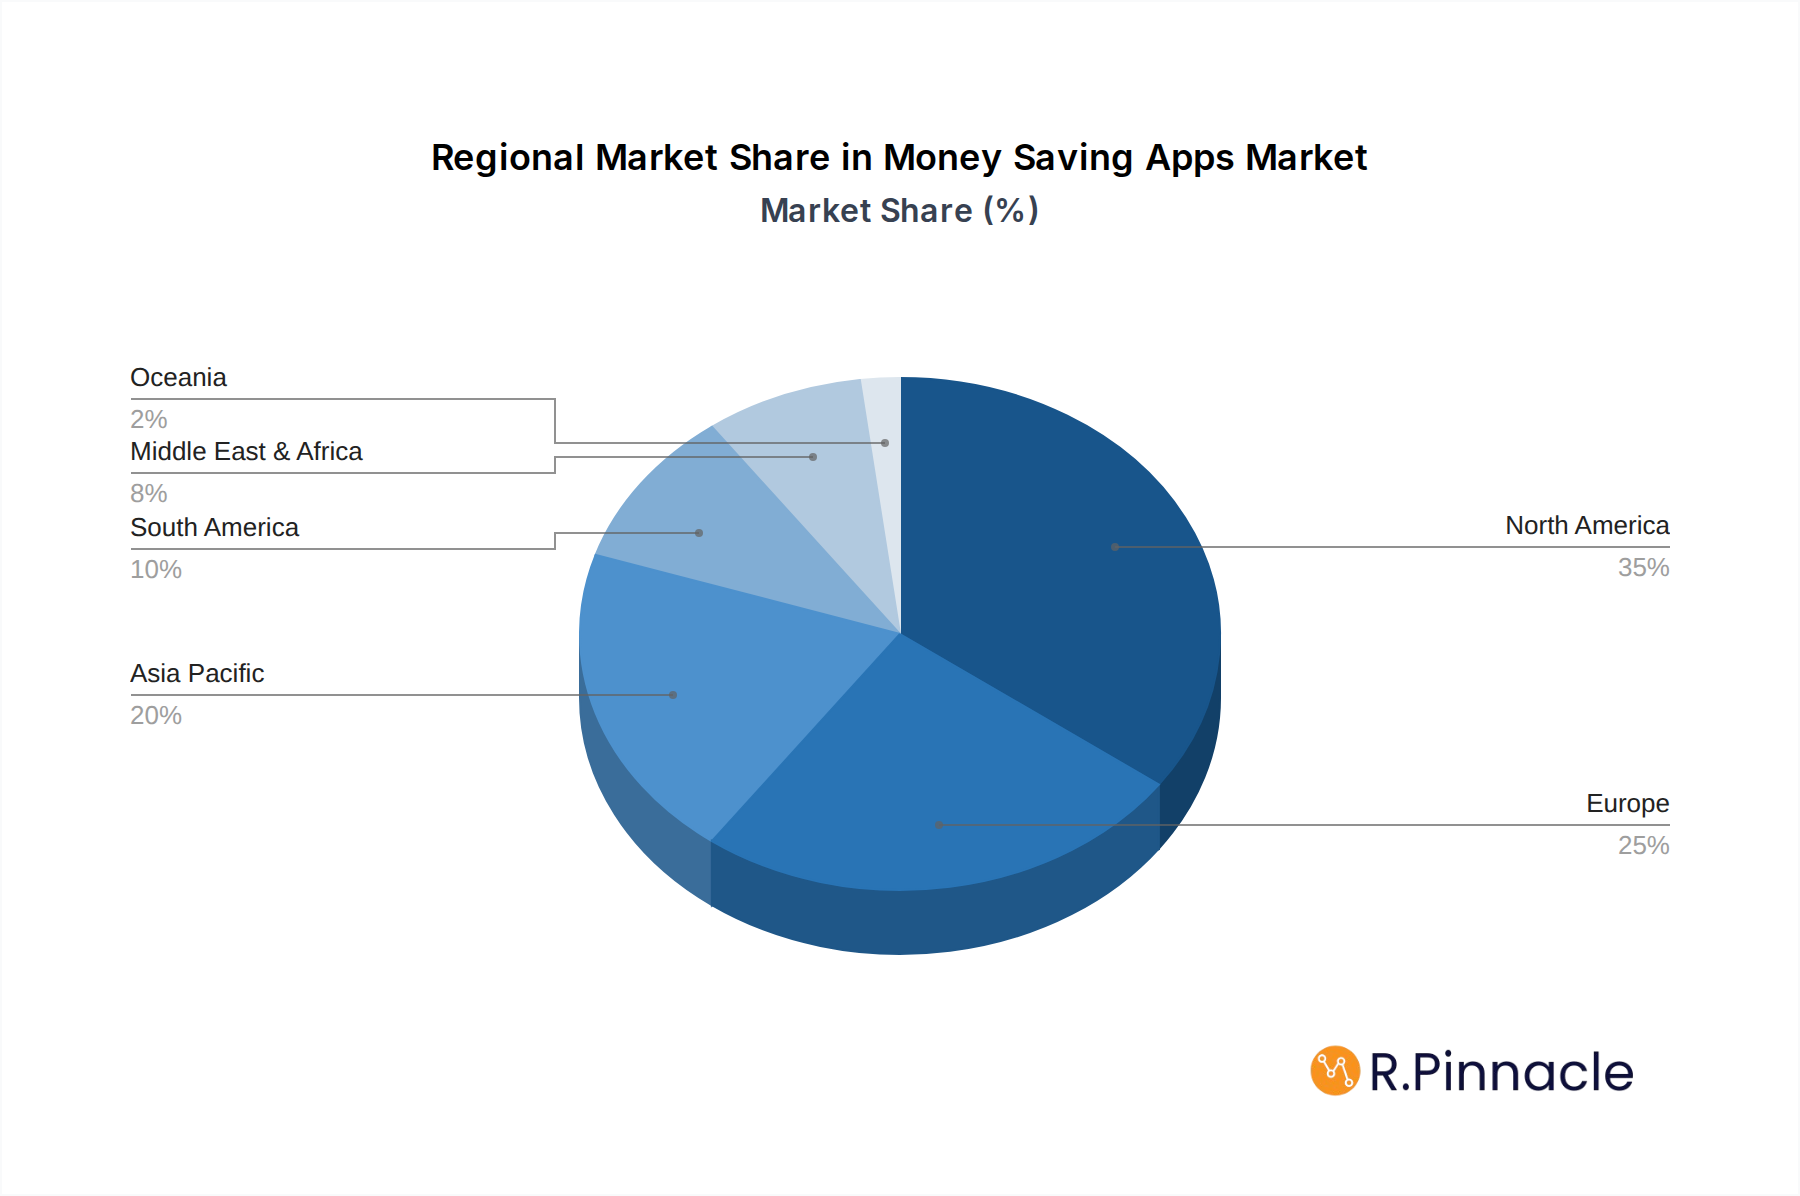
Money Saving Apps Regional Market Share
Geographic Coverage of Money Saving Apps
Money Saving Apps REPORT HIGHLIGHTS
| Aspects | Details |
|---|---|
| Study Period | 2020-2034 |
| Base Year | 2025 |
| Estimated Year | 2026 |
| Forecast Period | 2026-2034 |
| Historical Period | 2020-2025 |
| Growth Rate | CAGR of 18.4% from 2020-2034 |
| Segmentation |
|
Table of Contents
- 1. Introduction
- 1.1. Research Scope
- 1.2. Market Segmentation
- 1.3. Research Methodology
- 1.4. Definitions and Assumptions
- 2. Executive Summary
- 2.1. Introduction
- 3. Market Dynamics
- 3.1. Introduction
- 3.2. Market Drivers
- 3.3. Market Restrains
- 3.4. Market Trends
- 4. Market Factor Analysis
- 4.1. Porters Five Forces
- 4.2. Supply/Value Chain
- 4.3. PESTEL analysis
- 4.4. Market Entropy
- 4.5. Patent/Trademark Analysis
- 5. Global Money Saving Apps Analysis, Insights and Forecast, 2020-2032
- 5.1. Market Analysis, Insights and Forecast - by Application
- 5.1.1. Investment Account
- 5.1.2. Retirement Account
- 5.1.3. Checking Account
- 5.1.4. Debit Card
- 5.1.5. Others
- 5.2. Market Analysis, Insights and Forecast - by Types
- 5.2.1. Basic Version
- 5.2.2. Pro Version
- 5.3. Market Analysis, Insights and Forecast - by Region
- 5.3.1. North America
- 5.3.2. South America
- 5.3.3. Europe
- 5.3.4. Middle East & Africa
- 5.3.5. Asia Pacific
- 5.1. Market Analysis, Insights and Forecast - by Application
- 6. North America Money Saving Apps Analysis, Insights and Forecast, 2020-2032
- 6.1. Market Analysis, Insights and Forecast - by Application
- 6.1.1. Investment Account
- 6.1.2. Retirement Account
- 6.1.3. Checking Account
- 6.1.4. Debit Card
- 6.1.5. Others
- 6.2. Market Analysis, Insights and Forecast - by Types
- 6.2.1. Basic Version
- 6.2.2. Pro Version
- 6.1. Market Analysis, Insights and Forecast - by Application
- 7. South America Money Saving Apps Analysis, Insights and Forecast, 2020-2032
- 7.1. Market Analysis, Insights and Forecast - by Application
- 7.1.1. Investment Account
- 7.1.2. Retirement Account
- 7.1.3. Checking Account
- 7.1.4. Debit Card
- 7.1.5. Others
- 7.2. Market Analysis, Insights and Forecast - by Types
- 7.2.1. Basic Version
- 7.2.2. Pro Version
- 7.1. Market Analysis, Insights and Forecast - by Application
- 8. Europe Money Saving Apps Analysis, Insights and Forecast, 2020-2032
- 8.1. Market Analysis, Insights and Forecast - by Application
- 8.1.1. Investment Account
- 8.1.2. Retirement Account
- 8.1.3. Checking Account
- 8.1.4. Debit Card
- 8.1.5. Others
- 8.2. Market Analysis, Insights and Forecast - by Types
- 8.2.1. Basic Version
- 8.2.2. Pro Version
- 8.1. Market Analysis, Insights and Forecast - by Application
- 9. Middle East & Africa Money Saving Apps Analysis, Insights and Forecast, 2020-2032
- 9.1. Market Analysis, Insights and Forecast - by Application
- 9.1.1. Investment Account
- 9.1.2. Retirement Account
- 9.1.3. Checking Account
- 9.1.4. Debit Card
- 9.1.5. Others
- 9.2. Market Analysis, Insights and Forecast - by Types
- 9.2.1. Basic Version
- 9.2.2. Pro Version
- 9.1. Market Analysis, Insights and Forecast - by Application
- 10. Asia Pacific Money Saving Apps Analysis, Insights and Forecast, 2020-2032
- 10.1. Market Analysis, Insights and Forecast - by Application
- 10.1.1. Investment Account
- 10.1.2. Retirement Account
- 10.1.3. Checking Account
- 10.1.4. Debit Card
- 10.1.5. Others
- 10.2. Market Analysis, Insights and Forecast - by Types
- 10.2.1. Basic Version
- 10.2.2. Pro Version
- 10.1. Market Analysis, Insights and Forecast - by Application
- 11. Competitive Analysis
- 11.1. Global Market Share Analysis 2025
- 11.2. Company Profiles
- 11.2.1 Oportun
- 11.2.1.1. Overview
- 11.2.1.2. Products
- 11.2.1.3. SWOT Analysis
- 11.2.1.4. Recent Developments
- 11.2.1.5. Financials (Based on Availability)
- 11.2.2 Qapital
- 11.2.2.1. Overview
- 11.2.2.2. Products
- 11.2.2.3. SWOT Analysis
- 11.2.2.4. Recent Developments
- 11.2.2.5. Financials (Based on Availability)
- 11.2.3 Goodbudget
- 11.2.3.1. Overview
- 11.2.3.2. Products
- 11.2.3.3. SWOT Analysis
- 11.2.3.4. Recent Developments
- 11.2.3.5. Financials (Based on Availability)
- 11.2.4 Chime
- 11.2.4.1. Overview
- 11.2.4.2. Products
- 11.2.4.3. SWOT Analysis
- 11.2.4.4. Recent Developments
- 11.2.4.5. Financials (Based on Availability)
- 11.2.5 Current
- 11.2.5.1. Overview
- 11.2.5.2. Products
- 11.2.5.3. SWOT Analysis
- 11.2.5.4. Recent Developments
- 11.2.5.5. Financials (Based on Availability)
- 11.2.6 Acorns
- 11.2.6.1. Overview
- 11.2.6.2. Products
- 11.2.6.3. SWOT Analysis
- 11.2.6.4. Recent Developments
- 11.2.6.5. Financials (Based on Availability)
- 11.2.7 Rocket Money
- 11.2.7.1. Overview
- 11.2.7.2. Products
- 11.2.7.3. SWOT Analysis
- 11.2.7.4. Recent Developments
- 11.2.7.5. Financials (Based on Availability)
- 11.2.8 Allo
- 11.2.8.1. Overview
- 11.2.8.2. Products
- 11.2.8.3. SWOT Analysis
- 11.2.8.4. Recent Developments
- 11.2.8.5. Financials (Based on Availability)
- 11.2.9 Albert
- 11.2.9.1. Overview
- 11.2.9.2. Products
- 11.2.9.3. SWOT Analysis
- 11.2.9.4. Recent Developments
- 11.2.9.5. Financials (Based on Availability)
- 11.2.10 Digit
- 11.2.10.1. Overview
- 11.2.10.2. Products
- 11.2.10.3. SWOT Analysis
- 11.2.10.4. Recent Developments
- 11.2.10.5. Financials (Based on Availability)
- 11.2.11 Ibotta
- 11.2.11.1. Overview
- 11.2.11.2. Products
- 11.2.11.3. SWOT Analysis
- 11.2.11.4. Recent Developments
- 11.2.11.5. Financials (Based on Availability)
- 11.2.12 Fetch
- 11.2.12.1. Overview
- 11.2.12.2. Products
- 11.2.12.3. SWOT Analysis
- 11.2.12.4. Recent Developments
- 11.2.12.5. Financials (Based on Availability)
- 11.2.13 GoodRx
- 11.2.13.1. Overview
- 11.2.13.2. Products
- 11.2.13.3. SWOT Analysis
- 11.2.13.4. Recent Developments
- 11.2.13.5. Financials (Based on Availability)
- 11.2.14 Flashfood
- 11.2.14.1. Overview
- 11.2.14.2. Products
- 11.2.14.3. SWOT Analysis
- 11.2.14.4. Recent Developments
- 11.2.14.5. Financials (Based on Availability)
- 11.2.15 RatePunk
- 11.2.15.1. Overview
- 11.2.15.2. Products
- 11.2.15.3. SWOT Analysis
- 11.2.15.4. Recent Developments
- 11.2.15.5. Financials (Based on Availability)
- 11.2.16 Raise
- 11.2.16.1. Overview
- 11.2.16.2. Products
- 11.2.16.3. SWOT Analysis
- 11.2.16.4. Recent Developments
- 11.2.16.5. Financials (Based on Availability)
- 11.2.17 Rakuten
- 11.2.17.1. Overview
- 11.2.17.2. Products
- 11.2.17.3. SWOT Analysis
- 11.2.17.4. Recent Developments
- 11.2.17.5. Financials (Based on Availability)
- 11.2.18 Wise
- 11.2.18.1. Overview
- 11.2.18.2. Products
- 11.2.18.3. SWOT Analysis
- 11.2.18.4. Recent Developments
- 11.2.18.5. Financials (Based on Availability)
- 11.2.1 Oportun
List of Figures
- Figure 1: Global Money Saving Apps Revenue Breakdown (undefined, %) by Region 2025 & 2033
- Figure 2: North America Money Saving Apps Revenue (undefined), by Application 2025 & 2033
- Figure 3: North America Money Saving Apps Revenue Share (%), by Application 2025 & 2033
- Figure 4: North America Money Saving Apps Revenue (undefined), by Types 2025 & 2033
- Figure 5: North America Money Saving Apps Revenue Share (%), by Types 2025 & 2033
- Figure 6: North America Money Saving Apps Revenue (undefined), by Country 2025 & 2033
- Figure 7: North America Money Saving Apps Revenue Share (%), by Country 2025 & 2033
- Figure 8: South America Money Saving Apps Revenue (undefined), by Application 2025 & 2033
- Figure 9: South America Money Saving Apps Revenue Share (%), by Application 2025 & 2033
- Figure 10: South America Money Saving Apps Revenue (undefined), by Types 2025 & 2033
- Figure 11: South America Money Saving Apps Revenue Share (%), by Types 2025 & 2033
- Figure 12: South America Money Saving Apps Revenue (undefined), by Country 2025 & 2033
- Figure 13: South America Money Saving Apps Revenue Share (%), by Country 2025 & 2033
- Figure 14: Europe Money Saving Apps Revenue (undefined), by Application 2025 & 2033
- Figure 15: Europe Money Saving Apps Revenue Share (%), by Application 2025 & 2033
- Figure 16: Europe Money Saving Apps Revenue (undefined), by Types 2025 & 2033
- Figure 17: Europe Money Saving Apps Revenue Share (%), by Types 2025 & 2033
- Figure 18: Europe Money Saving Apps Revenue (undefined), by Country 2025 & 2033
- Figure 19: Europe Money Saving Apps Revenue Share (%), by Country 2025 & 2033
- Figure 20: Middle East & Africa Money Saving Apps Revenue (undefined), by Application 2025 & 2033
- Figure 21: Middle East & Africa Money Saving Apps Revenue Share (%), by Application 2025 & 2033
- Figure 22: Middle East & Africa Money Saving Apps Revenue (undefined), by Types 2025 & 2033
- Figure 23: Middle East & Africa Money Saving Apps Revenue Share (%), by Types 2025 & 2033
- Figure 24: Middle East & Africa Money Saving Apps Revenue (undefined), by Country 2025 & 2033
- Figure 25: Middle East & Africa Money Saving Apps Revenue Share (%), by Country 2025 & 2033
- Figure 26: Asia Pacific Money Saving Apps Revenue (undefined), by Application 2025 & 2033
- Figure 27: Asia Pacific Money Saving Apps Revenue Share (%), by Application 2025 & 2033
- Figure 28: Asia Pacific Money Saving Apps Revenue (undefined), by Types 2025 & 2033
- Figure 29: Asia Pacific Money Saving Apps Revenue Share (%), by Types 2025 & 2033
- Figure 30: Asia Pacific Money Saving Apps Revenue (undefined), by Country 2025 & 2033
- Figure 31: Asia Pacific Money Saving Apps Revenue Share (%), by Country 2025 & 2033
List of Tables
- Table 1: Global Money Saving Apps Revenue undefined Forecast, by Application 2020 & 2033
- Table 2: Global Money Saving Apps Revenue undefined Forecast, by Types 2020 & 2033
- Table 3: Global Money Saving Apps Revenue undefined Forecast, by Region 2020 & 2033
- Table 4: Global Money Saving Apps Revenue undefined Forecast, by Application 2020 & 2033
- Table 5: Global Money Saving Apps Revenue undefined Forecast, by Types 2020 & 2033
- Table 6: Global Money Saving Apps Revenue undefined Forecast, by Country 2020 & 2033
- Table 7: United States Money Saving Apps Revenue (undefined) Forecast, by Application 2020 & 2033
- Table 8: Canada Money Saving Apps Revenue (undefined) Forecast, by Application 2020 & 2033
- Table 9: Mexico Money Saving Apps Revenue (undefined) Forecast, by Application 2020 & 2033
- Table 10: Global Money Saving Apps Revenue undefined Forecast, by Application 2020 & 2033
- Table 11: Global Money Saving Apps Revenue undefined Forecast, by Types 2020 & 2033
- Table 12: Global Money Saving Apps Revenue undefined Forecast, by Country 2020 & 2033
- Table 13: Brazil Money Saving Apps Revenue (undefined) Forecast, by Application 2020 & 2033
- Table 14: Argentina Money Saving Apps Revenue (undefined) Forecast, by Application 2020 & 2033
- Table 15: Rest of South America Money Saving Apps Revenue (undefined) Forecast, by Application 2020 & 2033
- Table 16: Global Money Saving Apps Revenue undefined Forecast, by Application 2020 & 2033
- Table 17: Global Money Saving Apps Revenue undefined Forecast, by Types 2020 & 2033
- Table 18: Global Money Saving Apps Revenue undefined Forecast, by Country 2020 & 2033
- Table 19: United Kingdom Money Saving Apps Revenue (undefined) Forecast, by Application 2020 & 2033
- Table 20: Germany Money Saving Apps Revenue (undefined) Forecast, by Application 2020 & 2033
- Table 21: France Money Saving Apps Revenue (undefined) Forecast, by Application 2020 & 2033
- Table 22: Italy Money Saving Apps Revenue (undefined) Forecast, by Application 2020 & 2033
- Table 23: Spain Money Saving Apps Revenue (undefined) Forecast, by Application 2020 & 2033
- Table 24: Russia Money Saving Apps Revenue (undefined) Forecast, by Application 2020 & 2033
- Table 25: Benelux Money Saving Apps Revenue (undefined) Forecast, by Application 2020 & 2033
- Table 26: Nordics Money Saving Apps Revenue (undefined) Forecast, by Application 2020 & 2033
- Table 27: Rest of Europe Money Saving Apps Revenue (undefined) Forecast, by Application 2020 & 2033
- Table 28: Global Money Saving Apps Revenue undefined Forecast, by Application 2020 & 2033
- Table 29: Global Money Saving Apps Revenue undefined Forecast, by Types 2020 & 2033
- Table 30: Global Money Saving Apps Revenue undefined Forecast, by Country 2020 & 2033
- Table 31: Turkey Money Saving Apps Revenue (undefined) Forecast, by Application 2020 & 2033
- Table 32: Israel Money Saving Apps Revenue (undefined) Forecast, by Application 2020 & 2033
- Table 33: GCC Money Saving Apps Revenue (undefined) Forecast, by Application 2020 & 2033
- Table 34: North Africa Money Saving Apps Revenue (undefined) Forecast, by Application 2020 & 2033
- Table 35: South Africa Money Saving Apps Revenue (undefined) Forecast, by Application 2020 & 2033
- Table 36: Rest of Middle East & Africa Money Saving Apps Revenue (undefined) Forecast, by Application 2020 & 2033
- Table 37: Global Money Saving Apps Revenue undefined Forecast, by Application 2020 & 2033
- Table 38: Global Money Saving Apps Revenue undefined Forecast, by Types 2020 & 2033
- Table 39: Global Money Saving Apps Revenue undefined Forecast, by Country 2020 & 2033
- Table 40: China Money Saving Apps Revenue (undefined) Forecast, by Application 2020 & 2033
- Table 41: India Money Saving Apps Revenue (undefined) Forecast, by Application 2020 & 2033
- Table 42: Japan Money Saving Apps Revenue (undefined) Forecast, by Application 2020 & 2033
- Table 43: South Korea Money Saving Apps Revenue (undefined) Forecast, by Application 2020 & 2033
- Table 44: ASEAN Money Saving Apps Revenue (undefined) Forecast, by Application 2020 & 2033
- Table 45: Oceania Money Saving Apps Revenue (undefined) Forecast, by Application 2020 & 2033
- Table 46: Rest of Asia Pacific Money Saving Apps Revenue (undefined) Forecast, by Application 2020 & 2033
Frequently Asked Questions
1. What is the projected Compound Annual Growth Rate (CAGR) of the Money Saving Apps?
The projected CAGR is approximately 18.4%.
2. Which companies are prominent players in the Money Saving Apps?
Key companies in the market include Oportun, Qapital, Goodbudget, Chime, Current, Acorns, Rocket Money, Allo, Albert, Digit, Ibotta, Fetch, GoodRx, Flashfood, RatePunk, Raise, Rakuten, Wise.
3. What are the main segments of the Money Saving Apps?
The market segments include Application, Types.
4. Can you provide details about the market size?
The market size is estimated to be USD XXX N/A as of 2022.
5. What are some drivers contributing to market growth?
N/A
6. What are the notable trends driving market growth?
N/A
7. Are there any restraints impacting market growth?
N/A
8. Can you provide examples of recent developments in the market?
N/A
9. What pricing options are available for accessing the report?
Pricing options include single-user, multi-user, and enterprise licenses priced at USD 3950.00, USD 5925.00, and USD 7900.00 respectively.
10. Is the market size provided in terms of value or volume?
The market size is provided in terms of value, measured in N/A.
11. Are there any specific market keywords associated with the report?
Yes, the market keyword associated with the report is "Money Saving Apps," which aids in identifying and referencing the specific market segment covered.
12. How do I determine which pricing option suits my needs best?
The pricing options vary based on user requirements and access needs. Individual users may opt for single-user licenses, while businesses requiring broader access may choose multi-user or enterprise licenses for cost-effective access to the report.
13. Are there any additional resources or data provided in the Money Saving Apps report?
While the report offers comprehensive insights, it's advisable to review the specific contents or supplementary materials provided to ascertain if additional resources or data are available.
14. How can I stay updated on further developments or reports in the Money Saving Apps?
To stay informed about further developments, trends, and reports in the Money Saving Apps, consider subscribing to industry newsletters, following relevant companies and organizations, or regularly checking reputable industry news sources and publications.
Methodology
Step 1 - Identification of Relevant Samples Size from Population Database


Step 2 - Approaches for Defining Global Market Size (Value, Volume* & Price*)

Note*: In applicable scenarios
Step 3 - Data Sources
Primary Research
- Web Analytics
- Survey Reports
- Research Institute
- Latest Research Reports
- Opinion Leaders
Secondary Research
- Annual Reports
- White Paper
- Latest Press Release
- Industry Association
- Paid Database
- Investor Presentations

Step 4 - Data Triangulation
Involves using different sources of information in order to increase the validity of a study
These sources are likely to be stakeholders in a program - participants, other researchers, program staff, other community members, and so on.
Then we put all data in single framework & apply various statistical tools to find out the dynamic on the market.
During the analysis stage, feedback from the stakeholder groups would be compared to determine areas of agreement as well as areas of divergence

