
Key Insights
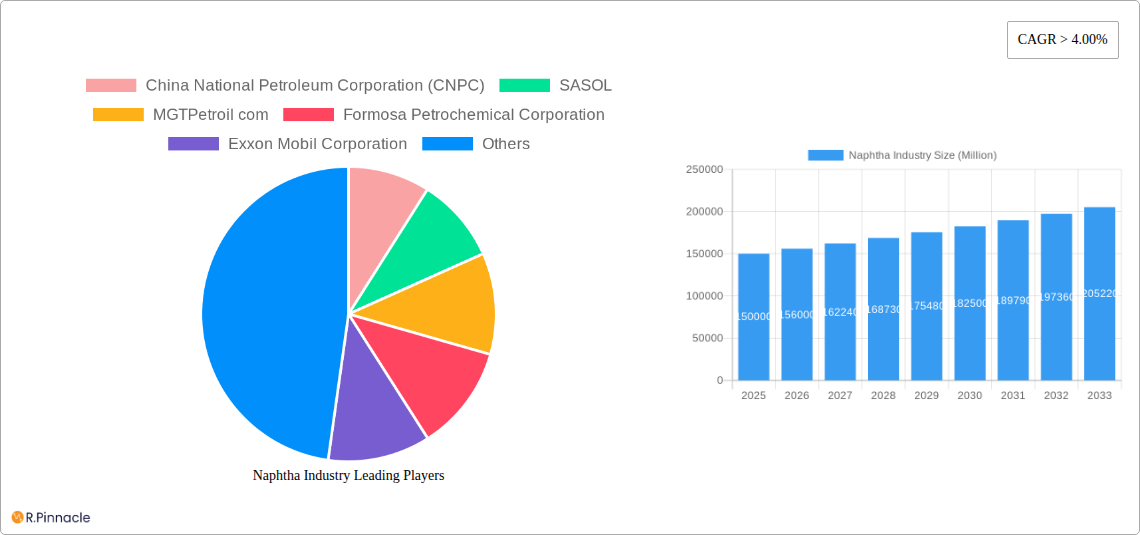
The global naphtha market is experiencing robust growth, driven by increasing demand from the petrochemical sector, particularly for ethylene and propylene production. The market's Compound Annual Growth Rate (CAGR) exceeding 4% signifies a consistent upward trajectory, projected to continue through 2033. Light naphtha, owing to its superior quality and suitability for petrochemical applications, commands a larger market share compared to heavy naphtha. Key end-user industries include petrochemicals, agriculture (as a solvent and feedstock), paints and coatings, and aerospace, with petrochemicals being the dominant driver. Geographic expansion is also a key factor; the Asia-Pacific region, especially China and India, exhibits significant growth potential due to rapid industrialization and increasing petrochemical production. However, the market faces restraints such as fluctuating crude oil prices, which directly impact naphtha pricing and profitability. Furthermore, environmental concerns surrounding naphtha's production and usage are prompting the industry to explore more sustainable alternatives and refining processes. Competition amongst major players like China National Petroleum Corporation (CNPC), SASOL, Formosa Petrochemical Corporation, ExxonMobil, and others is intense, leading to strategic alliances, technological advancements, and a focus on operational efficiency. The market's future hinges on balancing the demand from growing economies with sustainable practices and navigating volatile energy prices.
The forecast for the naphtha market indicates continued growth, driven by the ongoing expansion of the petrochemical industry globally. While the Asia-Pacific region is expected to remain a key growth driver, other regions such as North America and the Middle East will also witness substantial market expansion. The ongoing shift towards lighter naphtha grades reflects the increasing preference for high-quality feedstock in petrochemical processes. Innovation in naphtha refining technologies will be crucial in mitigating environmental concerns and enhancing the overall efficiency of the industry. The competitive landscape will remain dynamic, with companies continually striving to improve their production capabilities, expand their market reach, and develop new applications for naphtha derivatives. Strategic partnerships and mergers and acquisitions are anticipated to further shape the market structure in the coming years. Ultimately, successful players will be those that effectively balance growth, sustainability, and profitability.
Naphtha Industry Market Report: 2019-2033 Forecast
This comprehensive report provides an in-depth analysis of the global naphtha industry, offering crucial insights for industry professionals, investors, and strategic decision-makers. With a focus on market trends, competitive dynamics, and future growth opportunities, this report covers the period from 2019 to 2033, with a base year of 2025 and a forecast period spanning 2025-2033. The report analyzes key segments, including light and heavy naphtha, across various end-user industries such as petrochemicals, agriculture, paints and coatings, and aerospace. The report values are in Millions.
Naphtha Industry Market Structure & Innovation Trends
This section analyzes the competitive landscape of the naphtha industry, examining market concentration, innovation drivers, regulatory frameworks, and mergers and acquisitions (M&A) activities. We explore the impact of product substitutes and end-user demographics on market dynamics.
- Market Concentration: The naphtha market exhibits a moderately concentrated structure, with several major players controlling a significant market share. For example, CNPC, Saudi Aramco, and ExxonMobil collectively hold an estimated xx% market share as of 2024.
- Innovation Drivers: Technological advancements in refining processes and the development of novel naphtha-based products are key drivers of innovation. The focus on sustainability and the increasing demand for petrochemicals are also pushing innovation.
- Regulatory Frameworks: Government regulations related to emissions, safety, and environmental standards significantly impact the naphtha industry. Variations in these regulations across different regions create complexities for market players.
- Product Substitutes: The availability of alternative feedstocks for petrochemical production poses a challenge to the naphtha industry. The competitiveness of these substitutes varies depending on factors such as price and availability.
- M&A Activities: The naphtha industry has witnessed significant M&A activity in recent years, driven by the consolidation of market power and access to new technologies and resources. Total M&A deal values exceeded xx Million in the period 2019-2024, with an average deal size of xx Million. Examples include ExxonMobil's investment in a chemical complex in China.
Naphtha Industry Market Dynamics & Trends
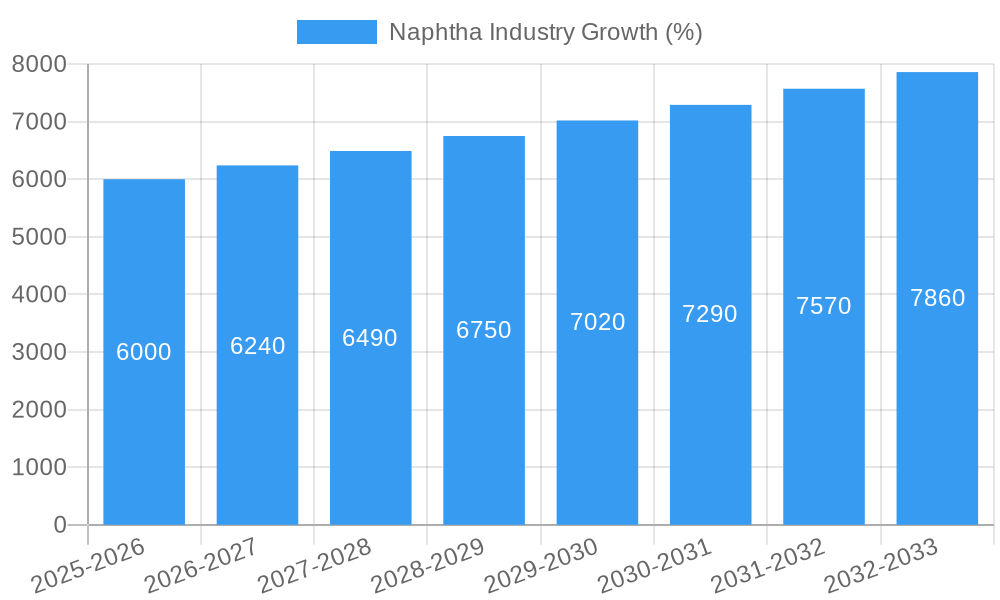
This section delves into the key factors shaping the naphtha market's growth trajectory, including technological disruptions, consumer preferences, and competitive dynamics. We analyze market growth drivers, assess future market potential, and project Compound Annual Growth Rates (CAGR). The global naphtha market is projected to grow at a CAGR of xx% during the forecast period (2025-2033), driven by a combination of factors including rising global demand for petrochemicals, increasing industrialization in developing economies, and technological advancements in naphtha processing. Market penetration in key regions will be driven by increased infrastructural investments and favorable economic policies. The increasing adoption of sustainable naphtha production processes and the development of new applications are other key trends shaping market dynamics.
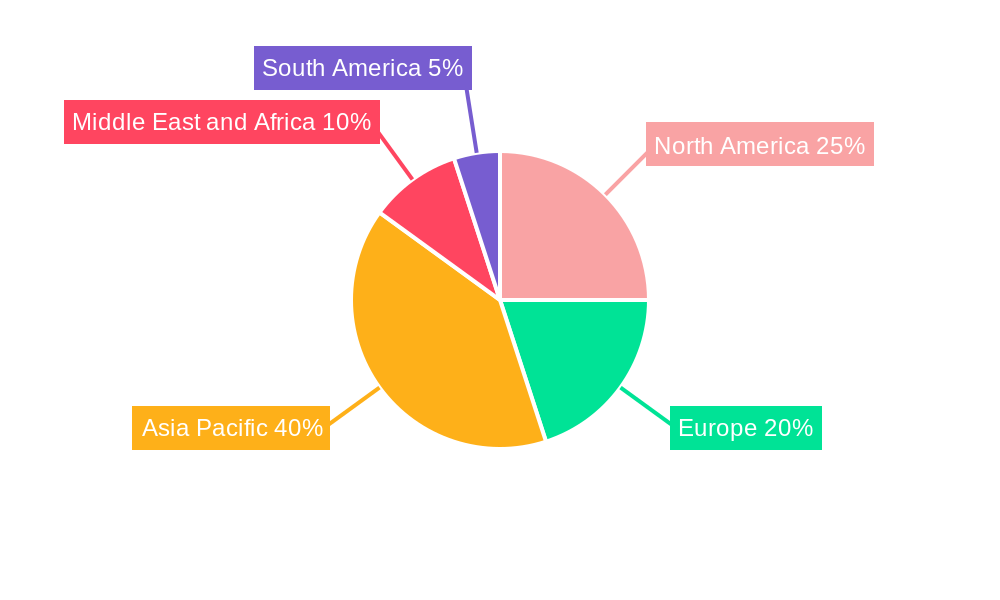
Dominant Regions & Segments in Naphtha Industry
This section identifies the leading regions and segments within the naphtha industry. The Asia-Pacific region is currently the dominant market, driven by strong demand from the petrochemical industry and rapid industrialization.
Key Drivers:
- Asia-Pacific: Rapid industrialization, increasing petrochemical demand, and significant investments in infrastructure.
- North America: Established petrochemical industry, robust economy, and access to resources.
- Europe: Stringent environmental regulations and the presence of large petrochemical companies.
Segment Dominance:
- By Type: Light naphtha currently holds a larger market share compared to heavy naphtha due to its wider applicability in the petrochemical sector.
- By End-user Industry: The petrochemical industry remains the dominant consumer of naphtha, accounting for a significant proportion of global naphtha consumption. Growth in the other segments is projected, driven by rising demand for diverse applications. However, the petrochemical industry's share is projected to remain significant throughout the forecast period due to sustained demand growth.
Naphtha Industry Product Innovations
Recent innovations focus on improving naphtha refining processes to enhance efficiency, reduce emissions, and produce higher-value products. Technological advancements such as advanced catalysis are contributing to improved product quality and yield. The market is witnessing the development of new naphtha-based materials with enhanced properties for various applications.
Report Scope & Segmentation Analysis
This report segments the naphtha market by type (Light Naphtha, Heavy Naphtha) and by end-user industry (Petrochemical, Agriculture, Paints and Coatings, Aerospace, Other End-user Industries). Each segment's market size, growth projections, and competitive dynamics are analyzed in detail. The petrochemical segment exhibits the highest growth potential, followed by the paints and coatings sector. Light naphtha is anticipated to retain a substantial market share due to its versatility and higher demand from the petrochemical industry.
Key Drivers of Naphtha Industry Growth
The naphtha industry's growth is driven by several factors, including the robust growth of the global petrochemical industry, increasing demand from emerging economies, and technological advancements in refining and processing techniques. Government policies promoting industrialization and infrastructural development also contribute significantly to market growth.
Challenges in the Naphtha Industry Sector
The naphtha industry faces challenges, including fluctuating crude oil prices, stringent environmental regulations impacting production costs, and the increasing competition from alternative feedstocks. Supply chain disruptions, geopolitical instability, and the volatility of global economic conditions also impact market growth.
Emerging Opportunities in Naphtha Industry
Emerging opportunities exist in the development of high-value naphtha-based specialty chemicals, bio-based naphtha alternatives, and sustainable refining technologies. Expanding into new markets, especially in developing economies, offers significant growth potential. The adoption of circular economy principles is also driving innovation and opening up new opportunities.
Leading Players in the Naphtha Industry Market
- China National Petroleum Corporation (CNPC)
- SASOL
- MGTPetroil com
- Formosa Petrochemical Corporation
- Exxon Mobil Corporation
- Chevron Phillips Chemical Company LLC
- Reliance Industries Limited
- PetroChina Company Limited
- AMOC (Alexandria Mineral Oils Co )
- SABIC
- Petroleos Mexicanos
- Saudi Arabian Oil Co (Saudi Aramco)
- LG Chem
- Royal Dutch Shell PLC
- BP PLC
- China Petroleum & Chemical Corporation (SINOPEC)
Key Developments in Naphtha Industry Industry
- November 2021: Exxon Mobil announced a multi-billion-dollar investment in a chemical complex in Guangdong, China, increasing production by 1.6 Million tonnes/year.
- October 2022: LG Chem shut down its naphtha crackers in South Korea for seven weeks of maintenance, impacting regional petrochemical supply.
Future Outlook for Naphtha Industry Market
The naphtha industry's future growth hinges on the continued expansion of the global petrochemical sector and advancements in refining technology focusing on sustainability. Strategic collaborations, investments in R&D, and the exploration of new applications will shape the market landscape in the coming years. The industry's capacity to adapt to evolving environmental regulations and consumer preferences will be crucial for long-term success.
Naphtha Industry Segmentation
-
1. Type
- 1.1. Light Naphtha
- 1.2. Heavy Naptha
-
2. End-user Industry
- 2.1. Petrochemical
- 2.2. Agriculture
- 2.3. Paints and Coatings
- 2.4. Aerospace
- 2.5. Other End-user Industries
Naphtha Industry Segmentation By Geography
-
1. Asia Pacific
- 1.1. China
- 1.2. India
- 1.3. Japan
- 1.4. South Korea
- 1.5. Rest of Asia Pacific
-
2. North America
- 2.1. United States
- 2.2. Canada
- 2.3. Mexico
-
3. Europe
- 3.1. Germany
- 3.2. United Kingdom
- 3.3. Italy
- 3.4. France
- 3.5. Rest of Europe
-
4. South America
- 4.1. Brazil
- 4.2. Argentina
- 4.3. Rest of South America
-
5. Middle East and Africa
- 5.1. Saudi Arabia
- 5.2. South Africa
- 5.3. Rest of Middle East and Africa
Naphtha Industry REPORT HIGHLIGHTS
| Aspects | Details |
|---|---|
| Study Period | 2019-2033 |
| Base Year | 2024 |
| Estimated Year | 2025 |
| Forecast Period | 2025-2033 |
| Historical Period | 2019-2024 |
| Growth Rate | CAGR of > 4.00% from 2019-2033 |
| Segmentation |
|
Table of Contents
- 1. Introduction
- 1.1. Research Scope
- 1.2. Market Segmentation
- 1.3. Research Methodology
- 1.4. Definitions and Assumptions
- 2. Executive Summary
- 2.1. Introduction
- 3. Market Dynamics
- 3.1. Introduction
- 3.2. Market Drivers
- 3.2.1. Increasing Demand for Petrochemicals in Asia Pacific; Rising Demand for Fertilizers in India
- 3.3. Market Restrains
- 3.3.1. Natural Gas Liquid Demand in the United States
- 3.4. Market Trends
- 3.4.1. Rising Demand from Petrochemical Industry
- 4. Market Factor Analysis
- 4.1. Porters Five Forces
- 4.2. Supply/Value Chain
- 4.3. PESTEL analysis
- 4.4. Market Entropy
- 4.5. Patent/Trademark Analysis
- 5. Global Naphtha Industry Analysis, Insights and Forecast, 2019-2031
- 5.1. Market Analysis, Insights and Forecast - by Type
- 5.1.1. Light Naphtha
- 5.1.2. Heavy Naptha
- 5.2. Market Analysis, Insights and Forecast - by End-user Industry
- 5.2.1. Petrochemical
- 5.2.2. Agriculture
- 5.2.3. Paints and Coatings
- 5.2.4. Aerospace
- 5.2.5. Other End-user Industries
- 5.3. Market Analysis, Insights and Forecast - by Region
- 5.3.1. Asia Pacific
- 5.3.2. North America
- 5.3.3. Europe
- 5.3.4. South America
- 5.3.5. Middle East and Africa
- 5.1. Market Analysis, Insights and Forecast - by Type
- 6. Asia Pacific Naphtha Industry Analysis, Insights and Forecast, 2019-2031
- 6.1. Market Analysis, Insights and Forecast - by Type
- 6.1.1. Light Naphtha
- 6.1.2. Heavy Naptha
- 6.2. Market Analysis, Insights and Forecast - by End-user Industry
- 6.2.1. Petrochemical
- 6.2.2. Agriculture
- 6.2.3. Paints and Coatings
- 6.2.4. Aerospace
- 6.2.5. Other End-user Industries
- 6.1. Market Analysis, Insights and Forecast - by Type
- 7. North America Naphtha Industry Analysis, Insights and Forecast, 2019-2031
- 7.1. Market Analysis, Insights and Forecast - by Type
- 7.1.1. Light Naphtha
- 7.1.2. Heavy Naptha
- 7.2. Market Analysis, Insights and Forecast - by End-user Industry
- 7.2.1. Petrochemical
- 7.2.2. Agriculture
- 7.2.3. Paints and Coatings
- 7.2.4. Aerospace
- 7.2.5. Other End-user Industries
- 7.1. Market Analysis, Insights and Forecast - by Type
- 8. Europe Naphtha Industry Analysis, Insights and Forecast, 2019-2031
- 8.1. Market Analysis, Insights and Forecast - by Type
- 8.1.1. Light Naphtha
- 8.1.2. Heavy Naptha
- 8.2. Market Analysis, Insights and Forecast - by End-user Industry
- 8.2.1. Petrochemical
- 8.2.2. Agriculture
- 8.2.3. Paints and Coatings
- 8.2.4. Aerospace
- 8.2.5. Other End-user Industries
- 8.1. Market Analysis, Insights and Forecast - by Type
- 9. South America Naphtha Industry Analysis, Insights and Forecast, 2019-2031
- 9.1. Market Analysis, Insights and Forecast - by Type
- 9.1.1. Light Naphtha
- 9.1.2. Heavy Naptha
- 9.2. Market Analysis, Insights and Forecast - by End-user Industry
- 9.2.1. Petrochemical
- 9.2.2. Agriculture
- 9.2.3. Paints and Coatings
- 9.2.4. Aerospace
- 9.2.5. Other End-user Industries
- 9.1. Market Analysis, Insights and Forecast - by Type
- 10. Middle East and Africa Naphtha Industry Analysis, Insights and Forecast, 2019-2031
- 10.1. Market Analysis, Insights and Forecast - by Type
- 10.1.1. Light Naphtha
- 10.1.2. Heavy Naptha
- 10.2. Market Analysis, Insights and Forecast - by End-user Industry
- 10.2.1. Petrochemical
- 10.2.2. Agriculture
- 10.2.3. Paints and Coatings
- 10.2.4. Aerospace
- 10.2.5. Other End-user Industries
- 10.1. Market Analysis, Insights and Forecast - by Type
- 11. Asia Pacific Naphtha Industry Analysis, Insights and Forecast, 2019-2031
- 11.1. Market Analysis, Insights and Forecast - By Country/Sub-region
- 11.1.1 China
- 11.1.2 India
- 11.1.3 Japan
- 11.1.4 South Korea
- 11.1.5 Rest of Asia Pacific
- 12. North America Naphtha Industry Analysis, Insights and Forecast, 2019-2031
- 12.1. Market Analysis, Insights and Forecast - By Country/Sub-region
- 12.1.1 United States
- 12.1.2 Canada
- 12.1.3 Mexico
- 13. Europe Naphtha Industry Analysis, Insights and Forecast, 2019-2031
- 13.1. Market Analysis, Insights and Forecast - By Country/Sub-region
- 13.1.1 Germany
- 13.1.2 United Kingdom
- 13.1.3 Italy
- 13.1.4 France
- 13.1.5 Rest of Europe
- 14. South America Naphtha Industry Analysis, Insights and Forecast, 2019-2031
- 14.1. Market Analysis, Insights and Forecast - By Country/Sub-region
- 14.1.1 Brazil
- 14.1.2 Argentina
- 14.1.3 Rest of South America
- 15. Middle East and Africa Naphtha Industry Analysis, Insights and Forecast, 2019-2031
- 15.1. Market Analysis, Insights and Forecast - By Country/Sub-region
- 15.1.1 Saudi Arabia
- 15.1.2 South Africa
- 15.1.3 Rest of Middle East and Africa
- 16. Competitive Analysis
- 16.1. Global Market Share Analysis 2024
- 16.2. Company Profiles
- 16.2.1 China National Petroleum Corporation (CNPC)
- 16.2.1.1. Overview
- 16.2.1.2. Products
- 16.2.1.3. SWOT Analysis
- 16.2.1.4. Recent Developments
- 16.2.1.5. Financials (Based on Availability)
- 16.2.2 SASOL
- 16.2.2.1. Overview
- 16.2.2.2. Products
- 16.2.2.3. SWOT Analysis
- 16.2.2.4. Recent Developments
- 16.2.2.5. Financials (Based on Availability)
- 16.2.3 MGTPetroil com
- 16.2.3.1. Overview
- 16.2.3.2. Products
- 16.2.3.3. SWOT Analysis
- 16.2.3.4. Recent Developments
- 16.2.3.5. Financials (Based on Availability)
- 16.2.4 Formosa Petrochemical Corporation
- 16.2.4.1. Overview
- 16.2.4.2. Products
- 16.2.4.3. SWOT Analysis
- 16.2.4.4. Recent Developments
- 16.2.4.5. Financials (Based on Availability)
- 16.2.5 Exxon Mobil Corporation
- 16.2.5.1. Overview
- 16.2.5.2. Products
- 16.2.5.3. SWOT Analysis
- 16.2.5.4. Recent Developments
- 16.2.5.5. Financials (Based on Availability)
- 16.2.6 Chevron Phillips Chemical Company LLC
- 16.2.6.1. Overview
- 16.2.6.2. Products
- 16.2.6.3. SWOT Analysis
- 16.2.6.4. Recent Developments
- 16.2.6.5. Financials (Based on Availability)
- 16.2.7 Reliance Industries Limited
- 16.2.7.1. Overview
- 16.2.7.2. Products
- 16.2.7.3. SWOT Analysis
- 16.2.7.4. Recent Developments
- 16.2.7.5. Financials (Based on Availability)
- 16.2.8 PetroChina Company Limited
- 16.2.8.1. Overview
- 16.2.8.2. Products
- 16.2.8.3. SWOT Analysis
- 16.2.8.4. Recent Developments
- 16.2.8.5. Financials (Based on Availability)
- 16.2.9 AMOC (Alexandria Mineral Oils Co )
- 16.2.9.1. Overview
- 16.2.9.2. Products
- 16.2.9.3. SWOT Analysis
- 16.2.9.4. Recent Developments
- 16.2.9.5. Financials (Based on Availability)
- 16.2.10 SABIC
- 16.2.10.1. Overview
- 16.2.10.2. Products
- 16.2.10.3. SWOT Analysis
- 16.2.10.4. Recent Developments
- 16.2.10.5. Financials (Based on Availability)
- 16.2.11 Petroleos Mexicanos
- 16.2.11.1. Overview
- 16.2.11.2. Products
- 16.2.11.3. SWOT Analysis
- 16.2.11.4. Recent Developments
- 16.2.11.5. Financials (Based on Availability)
- 16.2.12 Saudi Arabian Oil Co (Saudi Aramco)*List Not Exhaustive
- 16.2.12.1. Overview
- 16.2.12.2. Products
- 16.2.12.3. SWOT Analysis
- 16.2.12.4. Recent Developments
- 16.2.12.5. Financials (Based on Availability)
- 16.2.13 LG Chem
- 16.2.13.1. Overview
- 16.2.13.2. Products
- 16.2.13.3. SWOT Analysis
- 16.2.13.4. Recent Developments
- 16.2.13.5. Financials (Based on Availability)
- 16.2.14 Royal Dutch Shell PLC
- 16.2.14.1. Overview
- 16.2.14.2. Products
- 16.2.14.3. SWOT Analysis
- 16.2.14.4. Recent Developments
- 16.2.14.5. Financials (Based on Availability)
- 16.2.15 BP PLC
- 16.2.15.1. Overview
- 16.2.15.2. Products
- 16.2.15.3. SWOT Analysis
- 16.2.15.4. Recent Developments
- 16.2.15.5. Financials (Based on Availability)
- 16.2.16 China Petroleum & Chemical Corporation (SINOPEC)
- 16.2.16.1. Overview
- 16.2.16.2. Products
- 16.2.16.3. SWOT Analysis
- 16.2.16.4. Recent Developments
- 16.2.16.5. Financials (Based on Availability)
- 16.2.1 China National Petroleum Corporation (CNPC)
List of Figures
- Figure 1: Global Naphtha Industry Revenue Breakdown (Million, %) by Region 2024 & 2032
- Figure 2: Asia Pacific Naphtha Industry Revenue (Million), by Country 2024 & 2032
- Figure 3: Asia Pacific Naphtha Industry Revenue Share (%), by Country 2024 & 2032
- Figure 4: North America Naphtha Industry Revenue (Million), by Country 2024 & 2032
- Figure 5: North America Naphtha Industry Revenue Share (%), by Country 2024 & 2032
- Figure 6: Europe Naphtha Industry Revenue (Million), by Country 2024 & 2032
- Figure 7: Europe Naphtha Industry Revenue Share (%), by Country 2024 & 2032
- Figure 8: South America Naphtha Industry Revenue (Million), by Country 2024 & 2032
- Figure 9: South America Naphtha Industry Revenue Share (%), by Country 2024 & 2032
- Figure 10: Middle East and Africa Naphtha Industry Revenue (Million), by Country 2024 & 2032
- Figure 11: Middle East and Africa Naphtha Industry Revenue Share (%), by Country 2024 & 2032
- Figure 12: Asia Pacific Naphtha Industry Revenue (Million), by Type 2024 & 2032
- Figure 13: Asia Pacific Naphtha Industry Revenue Share (%), by Type 2024 & 2032
- Figure 14: Asia Pacific Naphtha Industry Revenue (Million), by End-user Industry 2024 & 2032
- Figure 15: Asia Pacific Naphtha Industry Revenue Share (%), by End-user Industry 2024 & 2032
- Figure 16: Asia Pacific Naphtha Industry Revenue (Million), by Country 2024 & 2032
- Figure 17: Asia Pacific Naphtha Industry Revenue Share (%), by Country 2024 & 2032
- Figure 18: North America Naphtha Industry Revenue (Million), by Type 2024 & 2032
- Figure 19: North America Naphtha Industry Revenue Share (%), by Type 2024 & 2032
- Figure 20: North America Naphtha Industry Revenue (Million), by End-user Industry 2024 & 2032
- Figure 21: North America Naphtha Industry Revenue Share (%), by End-user Industry 2024 & 2032
- Figure 22: North America Naphtha Industry Revenue (Million), by Country 2024 & 2032
- Figure 23: North America Naphtha Industry Revenue Share (%), by Country 2024 & 2032
- Figure 24: Europe Naphtha Industry Revenue (Million), by Type 2024 & 2032
- Figure 25: Europe Naphtha Industry Revenue Share (%), by Type 2024 & 2032
- Figure 26: Europe Naphtha Industry Revenue (Million), by End-user Industry 2024 & 2032
- Figure 27: Europe Naphtha Industry Revenue Share (%), by End-user Industry 2024 & 2032
- Figure 28: Europe Naphtha Industry Revenue (Million), by Country 2024 & 2032
- Figure 29: Europe Naphtha Industry Revenue Share (%), by Country 2024 & 2032
- Figure 30: South America Naphtha Industry Revenue (Million), by Type 2024 & 2032
- Figure 31: South America Naphtha Industry Revenue Share (%), by Type 2024 & 2032
- Figure 32: South America Naphtha Industry Revenue (Million), by End-user Industry 2024 & 2032
- Figure 33: South America Naphtha Industry Revenue Share (%), by End-user Industry 2024 & 2032
- Figure 34: South America Naphtha Industry Revenue (Million), by Country 2024 & 2032
- Figure 35: South America Naphtha Industry Revenue Share (%), by Country 2024 & 2032
- Figure 36: Middle East and Africa Naphtha Industry Revenue (Million), by Type 2024 & 2032
- Figure 37: Middle East and Africa Naphtha Industry Revenue Share (%), by Type 2024 & 2032
- Figure 38: Middle East and Africa Naphtha Industry Revenue (Million), by End-user Industry 2024 & 2032
- Figure 39: Middle East and Africa Naphtha Industry Revenue Share (%), by End-user Industry 2024 & 2032
- Figure 40: Middle East and Africa Naphtha Industry Revenue (Million), by Country 2024 & 2032
- Figure 41: Middle East and Africa Naphtha Industry Revenue Share (%), by Country 2024 & 2032
List of Tables
- Table 1: Global Naphtha Industry Revenue Million Forecast, by Region 2019 & 2032
- Table 2: Global Naphtha Industry Revenue Million Forecast, by Type 2019 & 2032
- Table 3: Global Naphtha Industry Revenue Million Forecast, by End-user Industry 2019 & 2032
- Table 4: Global Naphtha Industry Revenue Million Forecast, by Region 2019 & 2032
- Table 5: Global Naphtha Industry Revenue Million Forecast, by Country 2019 & 2032
- Table 6: China Naphtha Industry Revenue (Million) Forecast, by Application 2019 & 2032
- Table 7: India Naphtha Industry Revenue (Million) Forecast, by Application 2019 & 2032
- Table 8: Japan Naphtha Industry Revenue (Million) Forecast, by Application 2019 & 2032
- Table 9: South Korea Naphtha Industry Revenue (Million) Forecast, by Application 2019 & 2032
- Table 10: Rest of Asia Pacific Naphtha Industry Revenue (Million) Forecast, by Application 2019 & 2032
- Table 11: Global Naphtha Industry Revenue Million Forecast, by Country 2019 & 2032
- Table 12: United States Naphtha Industry Revenue (Million) Forecast, by Application 2019 & 2032
- Table 13: Canada Naphtha Industry Revenue (Million) Forecast, by Application 2019 & 2032
- Table 14: Mexico Naphtha Industry Revenue (Million) Forecast, by Application 2019 & 2032
- Table 15: Global Naphtha Industry Revenue Million Forecast, by Country 2019 & 2032
- Table 16: Germany Naphtha Industry Revenue (Million) Forecast, by Application 2019 & 2032
- Table 17: United Kingdom Naphtha Industry Revenue (Million) Forecast, by Application 2019 & 2032
- Table 18: Italy Naphtha Industry Revenue (Million) Forecast, by Application 2019 & 2032
- Table 19: France Naphtha Industry Revenue (Million) Forecast, by Application 2019 & 2032
- Table 20: Rest of Europe Naphtha Industry Revenue (Million) Forecast, by Application 2019 & 2032
- Table 21: Global Naphtha Industry Revenue Million Forecast, by Country 2019 & 2032
- Table 22: Brazil Naphtha Industry Revenue (Million) Forecast, by Application 2019 & 2032
- Table 23: Argentina Naphtha Industry Revenue (Million) Forecast, by Application 2019 & 2032
- Table 24: Rest of South America Naphtha Industry Revenue (Million) Forecast, by Application 2019 & 2032
- Table 25: Global Naphtha Industry Revenue Million Forecast, by Country 2019 & 2032
- Table 26: Saudi Arabia Naphtha Industry Revenue (Million) Forecast, by Application 2019 & 2032
- Table 27: South Africa Naphtha Industry Revenue (Million) Forecast, by Application 2019 & 2032
- Table 28: Rest of Middle East and Africa Naphtha Industry Revenue (Million) Forecast, by Application 2019 & 2032
- Table 29: Global Naphtha Industry Revenue Million Forecast, by Type 2019 & 2032
- Table 30: Global Naphtha Industry Revenue Million Forecast, by End-user Industry 2019 & 2032
- Table 31: Global Naphtha Industry Revenue Million Forecast, by Country 2019 & 2032
- Table 32: China Naphtha Industry Revenue (Million) Forecast, by Application 2019 & 2032
- Table 33: India Naphtha Industry Revenue (Million) Forecast, by Application 2019 & 2032
- Table 34: Japan Naphtha Industry Revenue (Million) Forecast, by Application 2019 & 2032
- Table 35: South Korea Naphtha Industry Revenue (Million) Forecast, by Application 2019 & 2032
- Table 36: Rest of Asia Pacific Naphtha Industry Revenue (Million) Forecast, by Application 2019 & 2032
- Table 37: Global Naphtha Industry Revenue Million Forecast, by Type 2019 & 2032
- Table 38: Global Naphtha Industry Revenue Million Forecast, by End-user Industry 2019 & 2032
- Table 39: Global Naphtha Industry Revenue Million Forecast, by Country 2019 & 2032
- Table 40: United States Naphtha Industry Revenue (Million) Forecast, by Application 2019 & 2032
- Table 41: Canada Naphtha Industry Revenue (Million) Forecast, by Application 2019 & 2032
- Table 42: Mexico Naphtha Industry Revenue (Million) Forecast, by Application 2019 & 2032
- Table 43: Global Naphtha Industry Revenue Million Forecast, by Type 2019 & 2032
- Table 44: Global Naphtha Industry Revenue Million Forecast, by End-user Industry 2019 & 2032
- Table 45: Global Naphtha Industry Revenue Million Forecast, by Country 2019 & 2032
- Table 46: Germany Naphtha Industry Revenue (Million) Forecast, by Application 2019 & 2032
- Table 47: United Kingdom Naphtha Industry Revenue (Million) Forecast, by Application 2019 & 2032
- Table 48: Italy Naphtha Industry Revenue (Million) Forecast, by Application 2019 & 2032
- Table 49: France Naphtha Industry Revenue (Million) Forecast, by Application 2019 & 2032
- Table 50: Rest of Europe Naphtha Industry Revenue (Million) Forecast, by Application 2019 & 2032
- Table 51: Global Naphtha Industry Revenue Million Forecast, by Type 2019 & 2032
- Table 52: Global Naphtha Industry Revenue Million Forecast, by End-user Industry 2019 & 2032
- Table 53: Global Naphtha Industry Revenue Million Forecast, by Country 2019 & 2032
- Table 54: Brazil Naphtha Industry Revenue (Million) Forecast, by Application 2019 & 2032
- Table 55: Argentina Naphtha Industry Revenue (Million) Forecast, by Application 2019 & 2032
- Table 56: Rest of South America Naphtha Industry Revenue (Million) Forecast, by Application 2019 & 2032
- Table 57: Global Naphtha Industry Revenue Million Forecast, by Type 2019 & 2032
- Table 58: Global Naphtha Industry Revenue Million Forecast, by End-user Industry 2019 & 2032
- Table 59: Global Naphtha Industry Revenue Million Forecast, by Country 2019 & 2032
- Table 60: Saudi Arabia Naphtha Industry Revenue (Million) Forecast, by Application 2019 & 2032
- Table 61: South Africa Naphtha Industry Revenue (Million) Forecast, by Application 2019 & 2032
- Table 62: Rest of Middle East and Africa Naphtha Industry Revenue (Million) Forecast, by Application 2019 & 2032
Frequently Asked Questions
1. What is the projected Compound Annual Growth Rate (CAGR) of the Naphtha Industry?
The projected CAGR is approximately > 4.00%.
2. Which companies are prominent players in the Naphtha Industry?
Key companies in the market include China National Petroleum Corporation (CNPC), SASOL, MGTPetroil com, Formosa Petrochemical Corporation, Exxon Mobil Corporation, Chevron Phillips Chemical Company LLC, Reliance Industries Limited, PetroChina Company Limited, AMOC (Alexandria Mineral Oils Co ), SABIC, Petroleos Mexicanos, Saudi Arabian Oil Co (Saudi Aramco)*List Not Exhaustive, LG Chem, Royal Dutch Shell PLC, BP PLC, China Petroleum & Chemical Corporation (SINOPEC).
3. What are the main segments of the Naphtha Industry?
The market segments include Type, End-user Industry.
4. Can you provide details about the market size?
The market size is estimated to be USD XX Million as of 2022.
5. What are some drivers contributing to market growth?
Increasing Demand for Petrochemicals in Asia Pacific; Rising Demand for Fertilizers in India.
6. What are the notable trends driving market growth?
Rising Demand from Petrochemical Industry.
7. Are there any restraints impacting market growth?
Natural Gas Liquid Demand in the United States.
8. Can you provide examples of recent developments in the market?
October 2022: LG Chem shuts down its naphtha crackers in South Korea for maintenance for seven weeks. It will affect the supply of petrochemicals in the region during maintenance.
9. What pricing options are available for accessing the report?
Pricing options include single-user, multi-user, and enterprise licenses priced at USD 4750, USD 5250, and USD 8750 respectively.
10. Is the market size provided in terms of value or volume?
The market size is provided in terms of value, measured in Million.
11. Are there any specific market keywords associated with the report?
Yes, the market keyword associated with the report is "Naphtha Industry," which aids in identifying and referencing the specific market segment covered.
12. How do I determine which pricing option suits my needs best?
The pricing options vary based on user requirements and access needs. Individual users may opt for single-user licenses, while businesses requiring broader access may choose multi-user or enterprise licenses for cost-effective access to the report.
13. Are there any additional resources or data provided in the Naphtha Industry report?
While the report offers comprehensive insights, it's advisable to review the specific contents or supplementary materials provided to ascertain if additional resources or data are available.
14. How can I stay updated on further developments or reports in the Naphtha Industry?
To stay informed about further developments, trends, and reports in the Naphtha Industry, consider subscribing to industry newsletters, following relevant companies and organizations, or regularly checking reputable industry news sources and publications.
Methodology
Step 1 - Identification of Relevant Samples Size from Population Database


Step 2 - Approaches for Defining Global Market Size (Value, Volume* & Price*)

Note*: In applicable scenarios
Step 3 - Data Sources
Primary Research
- Web Analytics
- Survey Reports
- Research Institute
- Latest Research Reports
- Opinion Leaders
Secondary Research
- Annual Reports
- White Paper
- Latest Press Release
- Industry Association
- Paid Database
- Investor Presentations

Step 4 - Data Triangulation
Involves using different sources of information in order to increase the validity of a study
These sources are likely to be stakeholders in a program - participants, other researchers, program staff, other community members, and so on.
Then we put all data in single framework & apply various statistical tools to find out the dynamic on the market.
During the analysis stage, feedback from the stakeholder groups would be compared to determine areas of agreement as well as areas of divergence


