

Key Insights
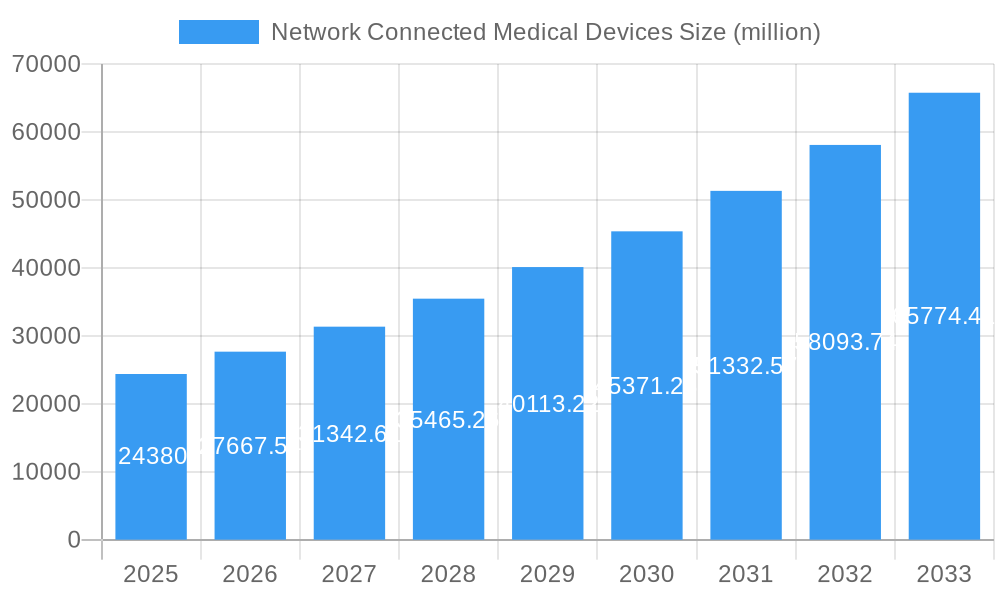
The global market for network-connected medical devices is experiencing robust growth, projected to reach $24.38 billion in 2025 and exhibiting a Compound Annual Growth Rate (CAGR) of 13.3% from 2019 to 2033. This expansion is driven by several key factors. Firstly, the increasing prevalence of chronic diseases necessitates continuous remote patient monitoring, creating a strong demand for these devices. Secondly, advancements in wireless technologies, miniaturization, and data analytics are enabling more sophisticated and user-friendly devices. Furthermore, the rising adoption of telehealth and remote patient care models, especially accelerated by recent global health crises, fuels market growth. The integration of these devices into existing healthcare infrastructure and the development of interoperable systems further contribute to this upward trend. Finally, government initiatives promoting digital health and the increasing availability of affordable high-speed internet access are facilitating wider adoption across various regions.
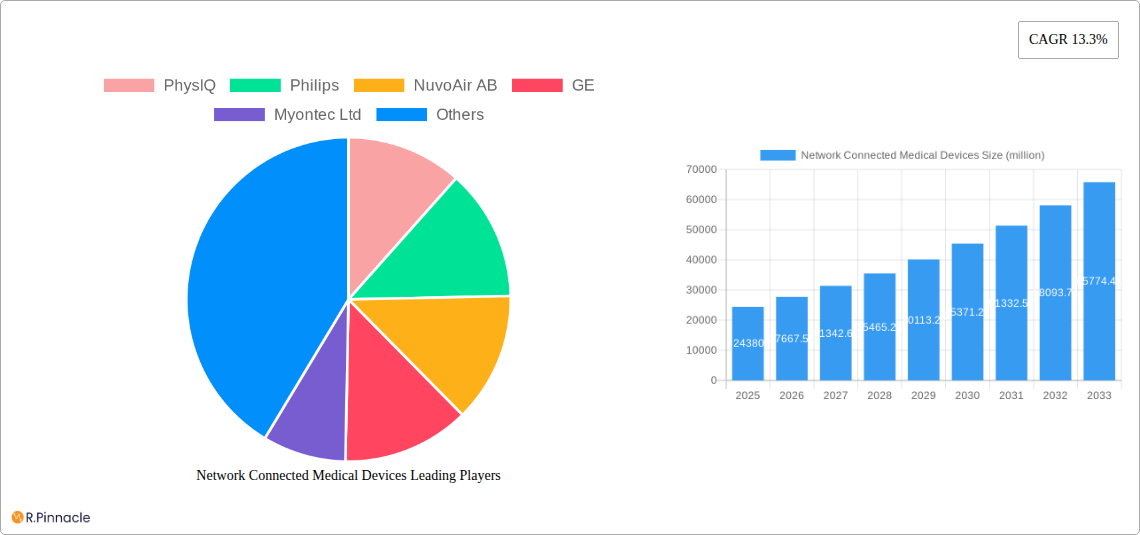
Network Connected Medical Devices Market Size (In Billion)
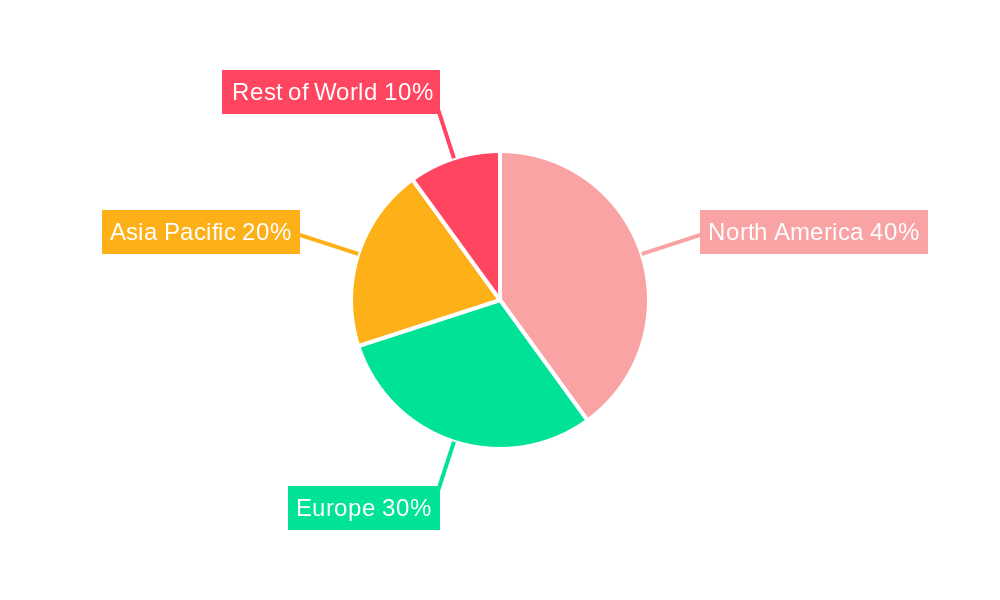
Market segmentation reveals significant opportunities within specific application areas. Cardiac monitoring devices maintain a substantial market share, followed by neuro and respiratory monitoring. While hospitals and clinics are major users, the "other" segment, encompassing home care and ambulatory settings, is experiencing the fastest growth, reflecting the shift towards decentralized care models. Key players like Philips, Medtronic, and GE Healthcare are investing heavily in research and development, driving innovation and competition. Geographical analysis indicates that North America currently holds the largest market share due to advanced healthcare infrastructure and high adoption rates. However, the Asia-Pacific region is expected to exhibit the highest growth rate in the forecast period driven by expanding healthcare infrastructure and increasing healthcare expenditure in rapidly developing economies like India and China. The continued evolution of network connected medical devices will focus on improved data security, enhanced interoperability, and the development of AI-powered diagnostic tools.
Network Connected Medical Devices Company Market Share
Network Connected Medical Devices Market Report: 2019-2033
This comprehensive report provides an in-depth analysis of the Network Connected Medical Devices market, projecting a market value exceeding $XX million by 2033. It offers actionable insights for industry professionals, investors, and strategic decision-makers, covering market structure, dynamics, leading players, and future growth opportunities. The study period spans 2019-2033, with 2025 serving as the base and estimated year. The forecast period is 2025-2033, and the historical period covers 2019-2024.
Network Connected Medical Devices Market Structure & Innovation Trends
The Network Connected Medical Devices market exhibits a moderately concentrated structure, with key players like Medtronic, Philips, and GE holding significant market share. However, smaller, specialized companies like NuvoAir AB and Myontec Ltd are also making substantial contributions through innovation. The market share of these top players is estimated to be around 60% in 2025, with the remaining 40% distributed among numerous smaller companies. Innovation is driven by advancements in wireless technologies, miniaturization, artificial intelligence (AI), and the increasing demand for remote patient monitoring. Regulatory frameworks, such as FDA approvals and cybersecurity standards, play a crucial role in shaping market dynamics. Product substitutes, while limited, include traditional wired medical devices, but their market penetration is declining due to the advantages offered by connected devices. End-user demographics are shifting towards an aging population with increasing chronic diseases, thereby fueling demand. M&A activity is moderate; notable deals in the last five years involved a total value of approximately $XX million, indicating ongoing consolidation within the market.
- Market Concentration: Moderately Concentrated (Top 3 players holding ~60% market share in 2025)
- Innovation Drivers: Wireless technologies, AI, Miniaturization, Remote patient monitoring
- Regulatory Framework: FDA approvals, Cybersecurity standards
- M&A Activity: Total deal value of approximately $XX million in the past five years.
Network Connected Medical Devices Market Dynamics & Trends
The Network Connected Medical Devices market is experiencing robust growth, with a projected Compound Annual Growth Rate (CAGR) of XX% during the forecast period (2025-2033). This growth is driven by several factors, including the rising prevalence of chronic diseases globally, increasing healthcare expenditure, and the growing adoption of telehealth solutions. Technological disruptions, such as the integration of IoT and cloud computing, are further accelerating market expansion. Consumer preferences are shifting towards convenient, personalized, and proactive healthcare solutions, leading to increased demand for connected devices. Competitive dynamics are characterized by both intense competition and strategic collaborations among market players. Market penetration is high in developed economies but is still expanding rapidly in developing countries.
Dominant Regions & Segments in Network Connected Medical Devices
North America currently holds the largest market share for Network Connected Medical Devices due to factors such as advanced healthcare infrastructure, high adoption rates of new technologies, and favorable regulatory environment. Within this region, the United States is the dominant market.
- Key Drivers in North America:
- Advanced healthcare infrastructure
- High adoption of new technologies
- Favorable regulatory environment
- High prevalence of chronic diseases
The Hospital segment dominates the application-based market, accounting for approximately 60% of total revenue in 2025, primarily due to higher device utilization and investment capacity. Among device types, Cardiac Monitoring Devices represent the largest segment, driven by the growing prevalence of cardiovascular diseases.
- Dominant Segment: Hospital (Application), Cardiac Monitoring Devices (Type)
- Key Drivers for Hospital Segment: Higher device utilization, investment capacity.
- Key Drivers for Cardiac Monitoring Devices: High prevalence of cardiovascular diseases, early detection and intervention capabilities.
Network Connected Medical Devices Product Innovations
Recent product innovations focus on enhancing device functionality, improving connectivity, and integrating advanced analytics capabilities. Miniaturization, improved battery life, and seamless integration with electronic health records (EHRs) are key technological trends. These improvements address market needs for enhanced patient convenience, improved data accuracy, and efficient clinical workflows. The competitive advantage lies in superior data analytics, user-friendly interfaces, and comprehensive data security measures.
Report Scope & Segmentation Analysis
This report segments the Network Connected Medical Devices market based on application (Hospital, Clinic, Other) and device type (Cardiac Monitoring Devices, Neuro Monitoring Devices, Respiratory Monitoring Devices). Each segment's growth trajectory, market size, and competitive landscape are analyzed. For instance, the Hospital segment is projected to maintain the highest growth rate due to increased investments in advanced medical technologies. The Cardiac Monitoring Devices segment demonstrates substantial growth potential driven by the increasing prevalence of cardiovascular diseases. The "Other" application segment shows slower growth compared to Hospital and Clinic but offers significant niche opportunities. The Neuro Monitoring Devices and Respiratory Monitoring Devices are showing steady growth with potential for accelerated growth through technological advancements.
Key Drivers of Network Connected Medical Devices Growth
The growth of the Network Connected Medical Devices market is primarily driven by several factors: the increasing prevalence of chronic diseases leading to higher demand for remote patient monitoring, advancements in wireless technologies, and increasing healthcare expenditure. Government initiatives promoting telehealth and digital health are also contributing to market expansion. Moreover, the rising adoption of sophisticated data analytics capabilities for improved patient care is a significant factor.
Challenges in the Network Connected Medical Devices Sector
Challenges include stringent regulatory hurdles for device approval and cybersecurity concerns related to data breaches and privacy violations. Supply chain disruptions can also impact production and availability. Furthermore, intense competition among established players and the emergence of new entrants create competitive pressures. These factors combined are estimated to impact market growth by approximately XX% in 2025.
Emerging Opportunities in Network Connected Medical Devices
Emerging opportunities exist in the integration of AI and machine learning for predictive diagnostics, the expansion into untapped markets in developing countries, and the development of personalized medicine solutions. The development of new wireless technologies and improved data security measures also offer exciting prospects. The expansion into wearable technologies also presents a significant opportunity.
Leading Players in the Network Connected Medical Devices Market
- PhysIQ
- Philips
- NuvoAir AB
- GE
- Myontec Ltd
- Nonin Medical
- Drägerwerk
- OMRON
- Medtronic
- Proteus Digital Health
- Roche
- Aerotel Medical Systems
- Fresenius Medical Care
- OxyGo LLC
- Aero Healthcare
- Hill-Rom
Key Developments in Network Connected Medical Devices Industry
- Jan 2023: Medtronic launches a new generation of connected cardiac monitors.
- May 2022: Philips announces a strategic partnership with a leading AI company for improved data analytics.
- Oct 2021: NuvoAir AB secures significant funding for expansion into new markets.
- Feb 2020: A major merger occurs between two smaller companies in the respiratory monitoring segment.
Future Outlook for Network Connected Medical Devices Market
The future outlook for the Network Connected Medical Devices market is highly promising. Continued technological advancements, coupled with growing demand for remote patient monitoring and the increasing adoption of telehealth solutions, will drive substantial growth in the coming years. Strategic partnerships, mergers, and acquisitions will continue to reshape the market landscape. Focus on improving data security and addressing regulatory challenges will be crucial for sustained growth and success. The market is poised for significant expansion, with potential for exceeding $XX million by 2033.
Network Connected Medical Devices Segmentation
-
1. Application
- 1.1. Hospital
- 1.2. Clinic
- 1.3. Other
-
2. Types
- 2.1. Cardiac Monitoring Devices
- 2.2. Neuro Monitoring Devices
- 2.3. Respiratory Monitoring Devices
Network Connected Medical Devices Segmentation By Geography
-
1. North America
- 1.1. United States
- 1.2. Canada
- 1.3. Mexico
-
2. South America
- 2.1. Brazil
- 2.2. Argentina
- 2.3. Rest of South America
-
3. Europe
- 3.1. United Kingdom
- 3.2. Germany
- 3.3. France
- 3.4. Italy
- 3.5. Spain
- 3.6. Russia
- 3.7. Benelux
- 3.8. Nordics
- 3.9. Rest of Europe
-
4. Middle East & Africa
- 4.1. Turkey
- 4.2. Israel
- 4.3. GCC
- 4.4. North Africa
- 4.5. South Africa
- 4.6. Rest of Middle East & Africa
-
5. Asia Pacific
- 5.1. China
- 5.2. India
- 5.3. Japan
- 5.4. South Korea
- 5.5. ASEAN
- 5.6. Oceania
- 5.7. Rest of Asia Pacific
Network Connected Medical Devices Regional Market Share
Geographic Coverage of Network Connected Medical Devices
Network Connected Medical Devices REPORT HIGHLIGHTS
| Aspects | Details |
|---|---|
| Study Period | 2020-2034 |
| Base Year | 2025 |
| Estimated Year | 2026 |
| Forecast Period | 2026-2034 |
| Historical Period | 2020-2025 |
| Growth Rate | CAGR of 13.3% from 2020-2034 |
| Segmentation |
|
Table of Contents
- 1. Introduction
- 1.1. Research Scope
- 1.2. Market Segmentation
- 1.3. Research Objective
- 1.4. Definitions and Assumptions
- 2. Executive Summary
- 2.1. Market Snapshot
- 3. Market Dynamics
- 3.1. Market Drivers
- 3.2. Market Restrains
- 3.3. Market Trends
- 3.4. Market Opportunities
- 4. Market Factor Analysis
- 4.1. Porters Five Forces
- 4.1.1. Bargaining Power of Suppliers
- 4.1.2. Bargaining Power of Buyers
- 4.1.3. Threat of New Entrants
- 4.1.4. Threat of Substitutes
- 4.1.5. Competitive Rivalry
- 4.2. PESTEL analysis
- 4.3. BCG Analysis
- 4.3.1. Stars (High Growth, High Market Share)
- 4.3.2. Cash Cows (Low Growth, High Market Share)
- 4.3.3. Question Mark (High Growth, Low Market Share)
- 4.3.4. Dogs (Low Growth, Low Market Share)
- 4.4. Ansoff Matrix Analysis
- 4.5. Supply Chain Analysis
- 4.6. Regulatory Landscape
- 4.7. Current Market Potential and Opportunity Assessment (TAM–SAM–SOM Framework)
- 4.8. PRI Analyst Note
- 4.1. Porters Five Forces
- 5. Market Analysis, Insights and Forecast 2021-2033
- 5.1. Market Analysis, Insights and Forecast - by Application
- 5.1.1. Hospital
- 5.1.2. Clinic
- 5.1.3. Other
- 5.2. Market Analysis, Insights and Forecast - by Types
- 5.2.1. Cardiac Monitoring Devices
- 5.2.2. Neuro Monitoring Devices
- 5.2.3. Respiratory Monitoring Devices
- 5.3. Market Analysis, Insights and Forecast - by Region
- 5.3.1. North America
- 5.3.2. South America
- 5.3.3. Europe
- 5.3.4. Middle East & Africa
- 5.3.5. Asia Pacific
- 5.1. Market Analysis, Insights and Forecast - by Application
- 6. Global Network Connected Medical Devices Analysis, Insights and Forecast, 2021-2033
- 6.1. Market Analysis, Insights and Forecast - by Application
- 6.1.1. Hospital
- 6.1.2. Clinic
- 6.1.3. Other
- 6.2. Market Analysis, Insights and Forecast - by Types
- 6.2.1. Cardiac Monitoring Devices
- 6.2.2. Neuro Monitoring Devices
- 6.2.3. Respiratory Monitoring Devices
- 6.1. Market Analysis, Insights and Forecast - by Application
- 7. North America Network Connected Medical Devices Analysis, Insights and Forecast, 2020-2032
- 7.1. Market Analysis, Insights and Forecast - by Application
- 7.1.1. Hospital
- 7.1.2. Clinic
- 7.1.3. Other
- 7.2. Market Analysis, Insights and Forecast - by Types
- 7.2.1. Cardiac Monitoring Devices
- 7.2.2. Neuro Monitoring Devices
- 7.2.3. Respiratory Monitoring Devices
- 7.1. Market Analysis, Insights and Forecast - by Application
- 8. South America Network Connected Medical Devices Analysis, Insights and Forecast, 2020-2032
- 8.1. Market Analysis, Insights and Forecast - by Application
- 8.1.1. Hospital
- 8.1.2. Clinic
- 8.1.3. Other
- 8.2. Market Analysis, Insights and Forecast - by Types
- 8.2.1. Cardiac Monitoring Devices
- 8.2.2. Neuro Monitoring Devices
- 8.2.3. Respiratory Monitoring Devices
- 8.1. Market Analysis, Insights and Forecast - by Application
- 9. Europe Network Connected Medical Devices Analysis, Insights and Forecast, 2020-2032
- 9.1. Market Analysis, Insights and Forecast - by Application
- 9.1.1. Hospital
- 9.1.2. Clinic
- 9.1.3. Other
- 9.2. Market Analysis, Insights and Forecast - by Types
- 9.2.1. Cardiac Monitoring Devices
- 9.2.2. Neuro Monitoring Devices
- 9.2.3. Respiratory Monitoring Devices
- 9.1. Market Analysis, Insights and Forecast - by Application
- 10. Middle East & Africa Network Connected Medical Devices Analysis, Insights and Forecast, 2020-2032
- 10.1. Market Analysis, Insights and Forecast - by Application
- 10.1.1. Hospital
- 10.1.2. Clinic
- 10.1.3. Other
- 10.2. Market Analysis, Insights and Forecast - by Types
- 10.2.1. Cardiac Monitoring Devices
- 10.2.2. Neuro Monitoring Devices
- 10.2.3. Respiratory Monitoring Devices
- 10.1. Market Analysis, Insights and Forecast - by Application
- 11. Asia Pacific Network Connected Medical Devices Analysis, Insights and Forecast, 2020-2032
- 11.1. Market Analysis, Insights and Forecast - by Application
- 11.1.1. Hospital
- 11.1.2. Clinic
- 11.1.3. Other
- 11.2. Market Analysis, Insights and Forecast - by Types
- 11.2.1. Cardiac Monitoring Devices
- 11.2.2. Neuro Monitoring Devices
- 11.2.3. Respiratory Monitoring Devices
- 11.1. Market Analysis, Insights and Forecast - by Application
- 12. Competitive Analysis
- 12.1. Company Profiles
- 12.1.1 PhysIQ
- 12.1.1.1. Company Overview
- 12.1.1.2. Products
- 12.1.1.3. Company Financials
- 12.1.1.4. SWOT Analysis
- 12.1.2 Philips
- 12.1.2.1. Company Overview
- 12.1.2.2. Products
- 12.1.2.3. Company Financials
- 12.1.2.4. SWOT Analysis
- 12.1.3 NuvoAir AB
- 12.1.3.1. Company Overview
- 12.1.3.2. Products
- 12.1.3.3. Company Financials
- 12.1.3.4. SWOT Analysis
- 12.1.4 GE
- 12.1.4.1. Company Overview
- 12.1.4.2. Products
- 12.1.4.3. Company Financials
- 12.1.4.4. SWOT Analysis
- 12.1.5 Myontec Ltd
- 12.1.5.1. Company Overview
- 12.1.5.2. Products
- 12.1.5.3. Company Financials
- 12.1.5.4. SWOT Analysis
- 12.1.6 Nonin Medical
- 12.1.6.1. Company Overview
- 12.1.6.2. Products
- 12.1.6.3. Company Financials
- 12.1.6.4. SWOT Analysis
- 12.1.7 Drgerwerk
- 12.1.7.1. Company Overview
- 12.1.7.2. Products
- 12.1.7.3. Company Financials
- 12.1.7.4. SWOT Analysis
- 12.1.8 OMRON
- 12.1.8.1. Company Overview
- 12.1.8.2. Products
- 12.1.8.3. Company Financials
- 12.1.8.4. SWOT Analysis
- 12.1.9 Medtronic
- 12.1.9.1. Company Overview
- 12.1.9.2. Products
- 12.1.9.3. Company Financials
- 12.1.9.4. SWOT Analysis
- 12.1.10 Proteus Digital Health
- 12.1.10.1. Company Overview
- 12.1.10.2. Products
- 12.1.10.3. Company Financials
- 12.1.10.4. SWOT Analysis
- 12.1.11 Roche
- 12.1.11.1. Company Overview
- 12.1.11.2. Products
- 12.1.11.3. Company Financials
- 12.1.11.4. SWOT Analysis
- 12.1.12 Aerotel Medical Systems
- 12.1.12.1. Company Overview
- 12.1.12.2. Products
- 12.1.12.3. Company Financials
- 12.1.12.4. SWOT Analysis
- 12.1.13 Fresenius Medical Care
- 12.1.13.1. Company Overview
- 12.1.13.2. Products
- 12.1.13.3. Company Financials
- 12.1.13.4. SWOT Analysis
- 12.1.14 OxyGo LLC
- 12.1.14.1. Company Overview
- 12.1.14.2. Products
- 12.1.14.3. Company Financials
- 12.1.14.4. SWOT Analysis
- 12.1.15 Aero Healthcare
- 12.1.15.1. Company Overview
- 12.1.15.2. Products
- 12.1.15.3. Company Financials
- 12.1.15.4. SWOT Analysis
- 12.1.16 Hill-Rom
- 12.1.16.1. Company Overview
- 12.1.16.2. Products
- 12.1.16.3. Company Financials
- 12.1.16.4. SWOT Analysis
- 12.1.1 PhysIQ
- 12.2. Market Entropy
- 12.2.1 Company's Key Areas Served
- 12.2.2 Recent Developments
- 12.3. Company Market Share Analysis 2025
- 12.3.1 Top 5 Companies Market Share Analysis
- 12.3.2 Top 3 Companies Market Share Analysis
- 12.4. List of Potential Customers
- 13. Research Methodology
List of Figures
- Figure 1: Global Network Connected Medical Devices Revenue Breakdown (million, %) by Region 2025 & 2033
- Figure 2: Global Network Connected Medical Devices Volume Breakdown (K, %) by Region 2025 & 2033
- Figure 3: North America Network Connected Medical Devices Revenue (million), by Application 2025 & 2033
- Figure 4: North America Network Connected Medical Devices Volume (K), by Application 2025 & 2033
- Figure 5: North America Network Connected Medical Devices Revenue Share (%), by Application 2025 & 2033
- Figure 6: North America Network Connected Medical Devices Volume Share (%), by Application 2025 & 2033
- Figure 7: North America Network Connected Medical Devices Revenue (million), by Types 2025 & 2033
- Figure 8: North America Network Connected Medical Devices Volume (K), by Types 2025 & 2033
- Figure 9: North America Network Connected Medical Devices Revenue Share (%), by Types 2025 & 2033
- Figure 10: North America Network Connected Medical Devices Volume Share (%), by Types 2025 & 2033
- Figure 11: North America Network Connected Medical Devices Revenue (million), by Country 2025 & 2033
- Figure 12: North America Network Connected Medical Devices Volume (K), by Country 2025 & 2033
- Figure 13: North America Network Connected Medical Devices Revenue Share (%), by Country 2025 & 2033
- Figure 14: North America Network Connected Medical Devices Volume Share (%), by Country 2025 & 2033
- Figure 15: South America Network Connected Medical Devices Revenue (million), by Application 2025 & 2033
- Figure 16: South America Network Connected Medical Devices Volume (K), by Application 2025 & 2033
- Figure 17: South America Network Connected Medical Devices Revenue Share (%), by Application 2025 & 2033
- Figure 18: South America Network Connected Medical Devices Volume Share (%), by Application 2025 & 2033
- Figure 19: South America Network Connected Medical Devices Revenue (million), by Types 2025 & 2033
- Figure 20: South America Network Connected Medical Devices Volume (K), by Types 2025 & 2033
- Figure 21: South America Network Connected Medical Devices Revenue Share (%), by Types 2025 & 2033
- Figure 22: South America Network Connected Medical Devices Volume Share (%), by Types 2025 & 2033
- Figure 23: South America Network Connected Medical Devices Revenue (million), by Country 2025 & 2033
- Figure 24: South America Network Connected Medical Devices Volume (K), by Country 2025 & 2033
- Figure 25: South America Network Connected Medical Devices Revenue Share (%), by Country 2025 & 2033
- Figure 26: South America Network Connected Medical Devices Volume Share (%), by Country 2025 & 2033
- Figure 27: Europe Network Connected Medical Devices Revenue (million), by Application 2025 & 2033
- Figure 28: Europe Network Connected Medical Devices Volume (K), by Application 2025 & 2033
- Figure 29: Europe Network Connected Medical Devices Revenue Share (%), by Application 2025 & 2033
- Figure 30: Europe Network Connected Medical Devices Volume Share (%), by Application 2025 & 2033
- Figure 31: Europe Network Connected Medical Devices Revenue (million), by Types 2025 & 2033
- Figure 32: Europe Network Connected Medical Devices Volume (K), by Types 2025 & 2033
- Figure 33: Europe Network Connected Medical Devices Revenue Share (%), by Types 2025 & 2033
- Figure 34: Europe Network Connected Medical Devices Volume Share (%), by Types 2025 & 2033
- Figure 35: Europe Network Connected Medical Devices Revenue (million), by Country 2025 & 2033
- Figure 36: Europe Network Connected Medical Devices Volume (K), by Country 2025 & 2033
- Figure 37: Europe Network Connected Medical Devices Revenue Share (%), by Country 2025 & 2033
- Figure 38: Europe Network Connected Medical Devices Volume Share (%), by Country 2025 & 2033
- Figure 39: Middle East & Africa Network Connected Medical Devices Revenue (million), by Application 2025 & 2033
- Figure 40: Middle East & Africa Network Connected Medical Devices Volume (K), by Application 2025 & 2033
- Figure 41: Middle East & Africa Network Connected Medical Devices Revenue Share (%), by Application 2025 & 2033
- Figure 42: Middle East & Africa Network Connected Medical Devices Volume Share (%), by Application 2025 & 2033
- Figure 43: Middle East & Africa Network Connected Medical Devices Revenue (million), by Types 2025 & 2033
- Figure 44: Middle East & Africa Network Connected Medical Devices Volume (K), by Types 2025 & 2033
- Figure 45: Middle East & Africa Network Connected Medical Devices Revenue Share (%), by Types 2025 & 2033
- Figure 46: Middle East & Africa Network Connected Medical Devices Volume Share (%), by Types 2025 & 2033
- Figure 47: Middle East & Africa Network Connected Medical Devices Revenue (million), by Country 2025 & 2033
- Figure 48: Middle East & Africa Network Connected Medical Devices Volume (K), by Country 2025 & 2033
- Figure 49: Middle East & Africa Network Connected Medical Devices Revenue Share (%), by Country 2025 & 2033
- Figure 50: Middle East & Africa Network Connected Medical Devices Volume Share (%), by Country 2025 & 2033
- Figure 51: Asia Pacific Network Connected Medical Devices Revenue (million), by Application 2025 & 2033
- Figure 52: Asia Pacific Network Connected Medical Devices Volume (K), by Application 2025 & 2033
- Figure 53: Asia Pacific Network Connected Medical Devices Revenue Share (%), by Application 2025 & 2033
- Figure 54: Asia Pacific Network Connected Medical Devices Volume Share (%), by Application 2025 & 2033
- Figure 55: Asia Pacific Network Connected Medical Devices Revenue (million), by Types 2025 & 2033
- Figure 56: Asia Pacific Network Connected Medical Devices Volume (K), by Types 2025 & 2033
- Figure 57: Asia Pacific Network Connected Medical Devices Revenue Share (%), by Types 2025 & 2033
- Figure 58: Asia Pacific Network Connected Medical Devices Volume Share (%), by Types 2025 & 2033
- Figure 59: Asia Pacific Network Connected Medical Devices Revenue (million), by Country 2025 & 2033
- Figure 60: Asia Pacific Network Connected Medical Devices Volume (K), by Country 2025 & 2033
- Figure 61: Asia Pacific Network Connected Medical Devices Revenue Share (%), by Country 2025 & 2033
- Figure 62: Asia Pacific Network Connected Medical Devices Volume Share (%), by Country 2025 & 2033
List of Tables
- Table 1: Global Network Connected Medical Devices Revenue million Forecast, by Application 2020 & 2033
- Table 2: Global Network Connected Medical Devices Volume K Forecast, by Application 2020 & 2033
- Table 3: Global Network Connected Medical Devices Revenue million Forecast, by Types 2020 & 2033
- Table 4: Global Network Connected Medical Devices Volume K Forecast, by Types 2020 & 2033
- Table 5: Global Network Connected Medical Devices Revenue million Forecast, by Region 2020 & 2033
- Table 6: Global Network Connected Medical Devices Volume K Forecast, by Region 2020 & 2033
- Table 7: Global Network Connected Medical Devices Revenue million Forecast, by Application 2020 & 2033
- Table 8: Global Network Connected Medical Devices Volume K Forecast, by Application 2020 & 2033
- Table 9: Global Network Connected Medical Devices Revenue million Forecast, by Types 2020 & 2033
- Table 10: Global Network Connected Medical Devices Volume K Forecast, by Types 2020 & 2033
- Table 11: Global Network Connected Medical Devices Revenue million Forecast, by Country 2020 & 2033
- Table 12: Global Network Connected Medical Devices Volume K Forecast, by Country 2020 & 2033
- Table 13: United States Network Connected Medical Devices Revenue (million) Forecast, by Application 2020 & 2033
- Table 14: United States Network Connected Medical Devices Volume (K) Forecast, by Application 2020 & 2033
- Table 15: Canada Network Connected Medical Devices Revenue (million) Forecast, by Application 2020 & 2033
- Table 16: Canada Network Connected Medical Devices Volume (K) Forecast, by Application 2020 & 2033
- Table 17: Mexico Network Connected Medical Devices Revenue (million) Forecast, by Application 2020 & 2033
- Table 18: Mexico Network Connected Medical Devices Volume (K) Forecast, by Application 2020 & 2033
- Table 19: Global Network Connected Medical Devices Revenue million Forecast, by Application 2020 & 2033
- Table 20: Global Network Connected Medical Devices Volume K Forecast, by Application 2020 & 2033
- Table 21: Global Network Connected Medical Devices Revenue million Forecast, by Types 2020 & 2033
- Table 22: Global Network Connected Medical Devices Volume K Forecast, by Types 2020 & 2033
- Table 23: Global Network Connected Medical Devices Revenue million Forecast, by Country 2020 & 2033
- Table 24: Global Network Connected Medical Devices Volume K Forecast, by Country 2020 & 2033
- Table 25: Brazil Network Connected Medical Devices Revenue (million) Forecast, by Application 2020 & 2033
- Table 26: Brazil Network Connected Medical Devices Volume (K) Forecast, by Application 2020 & 2033
- Table 27: Argentina Network Connected Medical Devices Revenue (million) Forecast, by Application 2020 & 2033
- Table 28: Argentina Network Connected Medical Devices Volume (K) Forecast, by Application 2020 & 2033
- Table 29: Rest of South America Network Connected Medical Devices Revenue (million) Forecast, by Application 2020 & 2033
- Table 30: Rest of South America Network Connected Medical Devices Volume (K) Forecast, by Application 2020 & 2033
- Table 31: Global Network Connected Medical Devices Revenue million Forecast, by Application 2020 & 2033
- Table 32: Global Network Connected Medical Devices Volume K Forecast, by Application 2020 & 2033
- Table 33: Global Network Connected Medical Devices Revenue million Forecast, by Types 2020 & 2033
- Table 34: Global Network Connected Medical Devices Volume K Forecast, by Types 2020 & 2033
- Table 35: Global Network Connected Medical Devices Revenue million Forecast, by Country 2020 & 2033
- Table 36: Global Network Connected Medical Devices Volume K Forecast, by Country 2020 & 2033
- Table 37: United Kingdom Network Connected Medical Devices Revenue (million) Forecast, by Application 2020 & 2033
- Table 38: United Kingdom Network Connected Medical Devices Volume (K) Forecast, by Application 2020 & 2033
- Table 39: Germany Network Connected Medical Devices Revenue (million) Forecast, by Application 2020 & 2033
- Table 40: Germany Network Connected Medical Devices Volume (K) Forecast, by Application 2020 & 2033
- Table 41: France Network Connected Medical Devices Revenue (million) Forecast, by Application 2020 & 2033
- Table 42: France Network Connected Medical Devices Volume (K) Forecast, by Application 2020 & 2033
- Table 43: Italy Network Connected Medical Devices Revenue (million) Forecast, by Application 2020 & 2033
- Table 44: Italy Network Connected Medical Devices Volume (K) Forecast, by Application 2020 & 2033
- Table 45: Spain Network Connected Medical Devices Revenue (million) Forecast, by Application 2020 & 2033
- Table 46: Spain Network Connected Medical Devices Volume (K) Forecast, by Application 2020 & 2033
- Table 47: Russia Network Connected Medical Devices Revenue (million) Forecast, by Application 2020 & 2033
- Table 48: Russia Network Connected Medical Devices Volume (K) Forecast, by Application 2020 & 2033
- Table 49: Benelux Network Connected Medical Devices Revenue (million) Forecast, by Application 2020 & 2033
- Table 50: Benelux Network Connected Medical Devices Volume (K) Forecast, by Application 2020 & 2033
- Table 51: Nordics Network Connected Medical Devices Revenue (million) Forecast, by Application 2020 & 2033
- Table 52: Nordics Network Connected Medical Devices Volume (K) Forecast, by Application 2020 & 2033
- Table 53: Rest of Europe Network Connected Medical Devices Revenue (million) Forecast, by Application 2020 & 2033
- Table 54: Rest of Europe Network Connected Medical Devices Volume (K) Forecast, by Application 2020 & 2033
- Table 55: Global Network Connected Medical Devices Revenue million Forecast, by Application 2020 & 2033
- Table 56: Global Network Connected Medical Devices Volume K Forecast, by Application 2020 & 2033
- Table 57: Global Network Connected Medical Devices Revenue million Forecast, by Types 2020 & 2033
- Table 58: Global Network Connected Medical Devices Volume K Forecast, by Types 2020 & 2033
- Table 59: Global Network Connected Medical Devices Revenue million Forecast, by Country 2020 & 2033
- Table 60: Global Network Connected Medical Devices Volume K Forecast, by Country 2020 & 2033
- Table 61: Turkey Network Connected Medical Devices Revenue (million) Forecast, by Application 2020 & 2033
- Table 62: Turkey Network Connected Medical Devices Volume (K) Forecast, by Application 2020 & 2033
- Table 63: Israel Network Connected Medical Devices Revenue (million) Forecast, by Application 2020 & 2033
- Table 64: Israel Network Connected Medical Devices Volume (K) Forecast, by Application 2020 & 2033
- Table 65: GCC Network Connected Medical Devices Revenue (million) Forecast, by Application 2020 & 2033
- Table 66: GCC Network Connected Medical Devices Volume (K) Forecast, by Application 2020 & 2033
- Table 67: North Africa Network Connected Medical Devices Revenue (million) Forecast, by Application 2020 & 2033
- Table 68: North Africa Network Connected Medical Devices Volume (K) Forecast, by Application 2020 & 2033
- Table 69: South Africa Network Connected Medical Devices Revenue (million) Forecast, by Application 2020 & 2033
- Table 70: South Africa Network Connected Medical Devices Volume (K) Forecast, by Application 2020 & 2033
- Table 71: Rest of Middle East & Africa Network Connected Medical Devices Revenue (million) Forecast, by Application 2020 & 2033
- Table 72: Rest of Middle East & Africa Network Connected Medical Devices Volume (K) Forecast, by Application 2020 & 2033
- Table 73: Global Network Connected Medical Devices Revenue million Forecast, by Application 2020 & 2033
- Table 74: Global Network Connected Medical Devices Volume K Forecast, by Application 2020 & 2033
- Table 75: Global Network Connected Medical Devices Revenue million Forecast, by Types 2020 & 2033
- Table 76: Global Network Connected Medical Devices Volume K Forecast, by Types 2020 & 2033
- Table 77: Global Network Connected Medical Devices Revenue million Forecast, by Country 2020 & 2033
- Table 78: Global Network Connected Medical Devices Volume K Forecast, by Country 2020 & 2033
- Table 79: China Network Connected Medical Devices Revenue (million) Forecast, by Application 2020 & 2033
- Table 80: China Network Connected Medical Devices Volume (K) Forecast, by Application 2020 & 2033
- Table 81: India Network Connected Medical Devices Revenue (million) Forecast, by Application 2020 & 2033
- Table 82: India Network Connected Medical Devices Volume (K) Forecast, by Application 2020 & 2033
- Table 83: Japan Network Connected Medical Devices Revenue (million) Forecast, by Application 2020 & 2033
- Table 84: Japan Network Connected Medical Devices Volume (K) Forecast, by Application 2020 & 2033
- Table 85: South Korea Network Connected Medical Devices Revenue (million) Forecast, by Application 2020 & 2033
- Table 86: South Korea Network Connected Medical Devices Volume (K) Forecast, by Application 2020 & 2033
- Table 87: ASEAN Network Connected Medical Devices Revenue (million) Forecast, by Application 2020 & 2033
- Table 88: ASEAN Network Connected Medical Devices Volume (K) Forecast, by Application 2020 & 2033
- Table 89: Oceania Network Connected Medical Devices Revenue (million) Forecast, by Application 2020 & 2033
- Table 90: Oceania Network Connected Medical Devices Volume (K) Forecast, by Application 2020 & 2033
- Table 91: Rest of Asia Pacific Network Connected Medical Devices Revenue (million) Forecast, by Application 2020 & 2033
- Table 92: Rest of Asia Pacific Network Connected Medical Devices Volume (K) Forecast, by Application 2020 & 2033
Frequently Asked Questions
1. What is the projected Compound Annual Growth Rate (CAGR) of the Network Connected Medical Devices?
The projected CAGR is approximately 13.3%.
2. Which companies are prominent players in the Network Connected Medical Devices?
Key companies in the market include PhysIQ, Philips, NuvoAir AB, GE, Myontec Ltd, Nonin Medical, Drgerwerk, OMRON, Medtronic, Proteus Digital Health, Roche, Aerotel Medical Systems, Fresenius Medical Care, OxyGo LLC, Aero Healthcare, Hill-Rom.
3. What are the main segments of the Network Connected Medical Devices?
The market segments include Application, Types.
4. Can you provide details about the market size?
The market size is estimated to be USD 24380 million as of 2022.
5. What are some drivers contributing to market growth?
N/A
6. What are the notable trends driving market growth?
N/A
7. Are there any restraints impacting market growth?
N/A
8. Can you provide examples of recent developments in the market?
N/A
9. What pricing options are available for accessing the report?
Pricing options include single-user, multi-user, and enterprise licenses priced at USD 3950.00, USD 5925.00, and USD 7900.00 respectively.
10. Is the market size provided in terms of value or volume?
The market size is provided in terms of value, measured in million and volume, measured in K.
11. Are there any specific market keywords associated with the report?
Yes, the market keyword associated with the report is "Network Connected Medical Devices," which aids in identifying and referencing the specific market segment covered.
12. How do I determine which pricing option suits my needs best?
The pricing options vary based on user requirements and access needs. Individual users may opt for single-user licenses, while businesses requiring broader access may choose multi-user or enterprise licenses for cost-effective access to the report.
13. Are there any additional resources or data provided in the Network Connected Medical Devices report?
While the report offers comprehensive insights, it's advisable to review the specific contents or supplementary materials provided to ascertain if additional resources or data are available.
14. How can I stay updated on further developments or reports in the Network Connected Medical Devices?
To stay informed about further developments, trends, and reports in the Network Connected Medical Devices, consider subscribing to industry newsletters, following relevant companies and organizations, or regularly checking reputable industry news sources and publications.
Methodology
Step 1 - Identification of Relevant Samples Size from Population Database


Step 2 - Approaches for Defining Global Market Size (Value, Volume* & Price*)

Note*: In applicable scenarios
Step 3 - Data Sources
Primary Research
- Web Analytics
- Survey Reports
- Research Institute
- Latest Research Reports
- Opinion Leaders
Secondary Research
- Annual Reports
- White Paper
- Latest Press Release
- Industry Association
- Paid Database
- Investor Presentations

Step 4 - Data Triangulation
Involves using different sources of information in order to increase the validity of a study
These sources are likely to be stakeholders in a program - participants, other researchers, program staff, other community members, and so on.
Then we put all data in single framework & apply various statistical tools to find out the dynamic on the market.
During the analysis stage, feedback from the stakeholder groups would be compared to determine areas of agreement as well as areas of divergence