

Key Insights
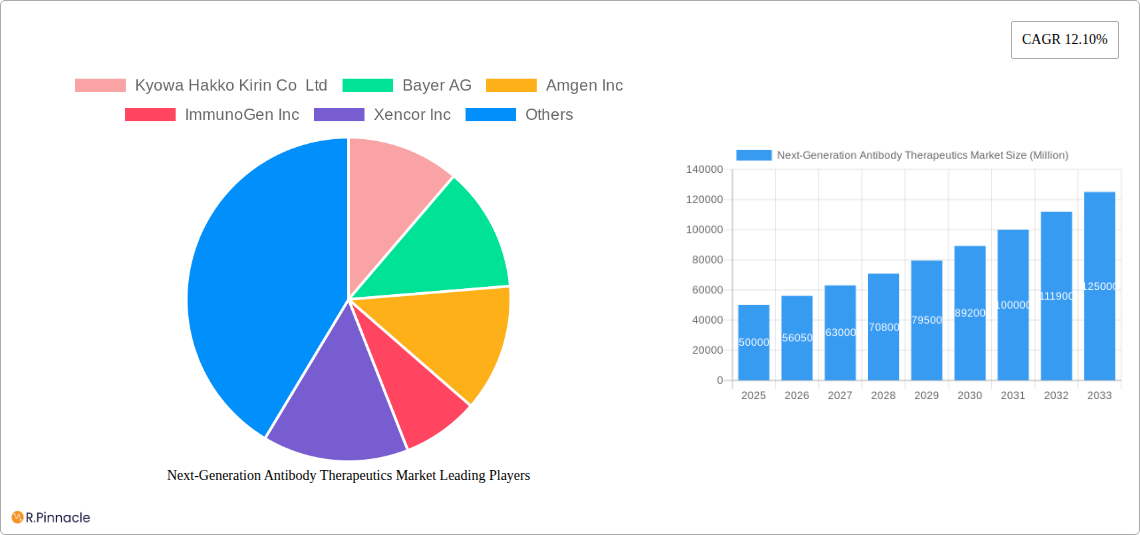
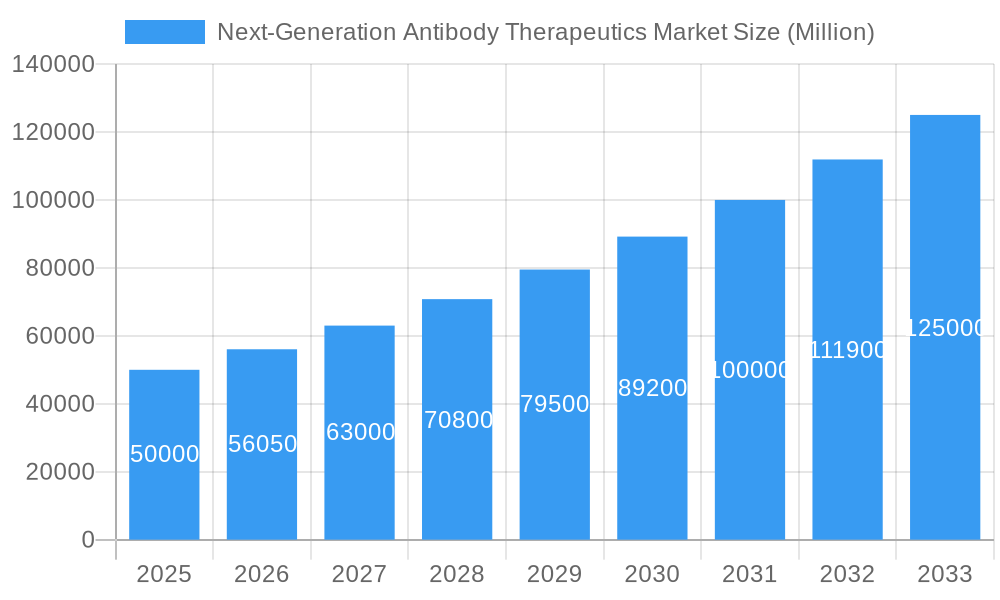
The Next-Generation Antibody Therapeutics market is poised for significant expansion, with a projected market size of 7.63 billion by 2025. This growth is underpinned by a robust Compound Annual Growth Rate (CAGR) of 10.9%, driven by the rising incidence of chronic conditions such as cancer and autoimmune disorders. Advancements in antibody engineering, including Antibody-Drug Conjugates (ADCs) and Bispecific Antibodies (BsAbs), are enabling the development of more effective and targeted treatments. Substantial R&D investments by leading biopharmaceutical companies are further accelerating market momentum. Key therapeutic areas driving demand include Oncology and Autoimmune/Inflammatory diseases. North America and Europe currently lead the market, with Asia Pacific exhibiting substantial growth potential due to increasing healthcare expenditure and adoption of advanced therapies.
Next-Generation Antibody Therapeutics Market Market Size (In Billion)
Continued innovation and strategic investments are crucial for navigating the dynamic competitive landscape of next-generation antibody therapeutics. While regulatory pathways and development costs present challenges, the promise of improved patient outcomes and the addressing of significant unmet medical needs attract substantial capital. Emerging biotech firms and established pharmaceutical giants are actively pursuing market share through collaborations and acquisitions. The trend towards personalized medicine and targeted therapies, focusing on enhanced drug delivery and reduced side effects, will continue to fuel market expansion and attract significant investment, solidifying the sector's role in revolutionizing complex disease treatment.
Next-Generation Antibody Therapeutics Market Company Market Share
Next-Generation Antibody Therapeutics Market: A Comprehensive Report (2019-2033)
This comprehensive report provides an in-depth analysis of the Next-Generation Antibody Therapeutics market, offering actionable insights for industry professionals, investors, and researchers. With a study period spanning 2019-2033, a base year of 2025, and a forecast period of 2025-2033, this report leverages rigorous data analysis to predict future market trends and opportunities. The market is segmented by therapeutic area (Oncology, Autoimmune/Inflammatory) and technology (Antibody-Drug Conjugates (ADCs), Bispecific Antibodies (BsAbs), Fc-Engineered Antibodies, Antibody Fragments and Antibody-Like Proteins (AF & ALPs), Biosimilar Antibody Products), providing a granular understanding of market dynamics. Key players analyzed include Kyowa Hakko Kirin Co Ltd, Bayer AG, Amgen Inc, ImmunoGen Inc, Xencor Inc, F Hoffmann-La Roche Ltd, GlaxoSmithKline Plc, Biogen, AstraZeneca Plc, Seagen Inc, Bristol-Myers Squibb Company, and Pfizer Inc.
Next-Generation Antibody Therapeutics Market Market Structure & Innovation Trends
The Next-Generation Antibody Therapeutics market is characterized by a moderately concentrated structure, with a few large multinational pharmaceutical companies holding significant market share. The market share distribution amongst the top players is dynamic, with ongoing mergers and acquisitions (M&A) influencing the competitive landscape. Innovation is a key driver, fueled by advancements in antibody engineering technologies and a growing need for more effective and targeted therapies. Stringent regulatory frameworks, particularly in regions like the US and Europe, influence product development and market entry. The market faces competition from traditional therapeutic approaches, but the superior efficacy and targeted nature of next-generation antibodies are driving market penetration. M&A activity has been substantial, with deals valued at xx Million in the past five years, primarily driven by the desire to expand therapeutic portfolios and access innovative technologies. For example, the consolidation of smaller biotech firms by larger pharmaceutical companies is a prevalent trend.
- Market Concentration: Moderately concentrated, with top 10 players holding approximately xx% market share.
- Innovation Drivers: Advances in antibody engineering, unmet medical needs, and increased R&D investments.
- Regulatory Landscape: Stringent regulatory approvals in key markets drive high development costs.
- M&A Activity: Significant activity with deals exceeding xx Million over the past five years.
- Product Substitutes: Traditional therapies, but next-generation antibodies offer superior efficacy.
Next-Generation Antibody Therapeutics Market Market Dynamics & Trends
The Next-Generation Antibody Therapeutics market is experiencing robust growth, driven by several factors. The increasing prevalence of chronic diseases such as cancer and autoimmune disorders fuels demand for more effective therapies. Technological advancements in antibody engineering, such as the development of ADCs, BsAbs, and Fc-engineered antibodies, are expanding therapeutic options. Consumer preferences are shifting towards personalized medicine, with a focus on targeted therapies that minimize side effects. The competitive dynamics are intense, with leading pharmaceutical companies investing heavily in R&D and strategic partnerships to maintain a competitive edge. The market is expected to exhibit a Compound Annual Growth Rate (CAGR) of xx% during the forecast period (2025-2033). Market penetration is increasing, with a significant uptake of next-generation antibody therapies across various therapeutic areas. The rising cost of healthcare is a significant challenge, but the long-term cost-effectiveness of targeted therapies is expected to drive market expansion.
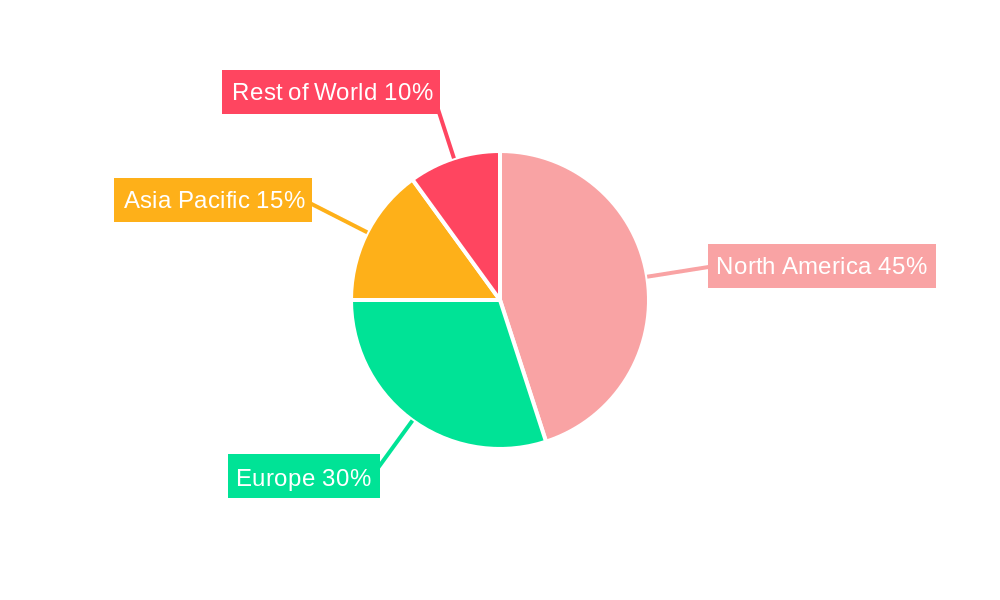
Dominant Regions & Segments in Next-Generation Antibody Therapeutics Market
North America currently dominates the Next-Generation Antibody Therapeutics market, driven by strong R&D investments, early adoption of innovative therapies, and favorable regulatory environments. Within North America, the United States holds the largest market share. Europe holds a significant second position.
- Leading Region: North America (United States)
- Key Drivers in North America:
- High R&D spending and early adoption of new technologies.
- Strong regulatory framework supporting the rapid development and launch of novel therapies.
- Large patient population for target diseases.
- Leading Therapeutic Area: Oncology represents the largest market segment, primarily due to the high prevalence of various cancers and the significant unmet medical needs in this area.
- Leading Technology: Antibody-Drug Conjugates (ADCs) dominate the market due to their demonstrated success in treating various types of cancers.
Within therapeutic areas, Oncology is the largest segment, followed by Autoimmune/Inflammatory diseases. Within technologies, ADCs currently hold the largest market share due to their proven efficacy in oncology. However, BsAbs are gaining traction due to their potential for improved therapeutic outcomes.
Next-Generation Antibody Therapeutics Market Product Innovations
Recent years have witnessed significant advancements in next-generation antibody therapeutics, primarily driven by technological innovations in antibody engineering. New products offer superior efficacy, improved safety profiles, and enhanced targeting capabilities compared to traditional antibody therapies. The market is witnessing a trend towards personalized medicine, with increasing focus on developing targeted therapies tailored to specific patient populations and cancer types. This focus aims to maximize therapeutic benefits while minimizing adverse effects. The successful market fit of innovative antibody therapies will depend on demonstrating superior efficacy and safety profiles in clinical trials, securing regulatory approvals, and establishing cost-effective manufacturing processes.
Report Scope & Segmentation Analysis
This report provides a detailed analysis of the Next-Generation Antibody Therapeutics market, segmented by therapeutic area and technology.
Therapeutic Area: Oncology and Autoimmune/Inflammatory diseases are the key segments, with Oncology expected to maintain the largest market share. Oncology shows a projected CAGR of xx% during the forecast period, driven by an increasing prevalence of cancer and a high unmet medical need. The Autoimmune/Inflammatory segment is expected to exhibit growth at xx%, owing to the rising prevalence of autoimmune diseases globally.
Technology: Antibody-Drug Conjugates (ADCs) hold a significant market share, while Bispecific Antibodies (BsAbs), Fc-Engineered Antibodies, Antibody Fragments and Antibody-Like Proteins (AF & ALPs), and Biosimilar Antibody Products are also experiencing growth. ADCs are projected to grow at xx% CAGR, fueled by their successful clinical applications in cancer treatment. BsAbs are projected to demonstrate a high CAGR of xx%, due to their potential for improved efficacy and specificity.
Key Drivers of Next-Generation Antibody Therapeutics Market Growth
Several key factors contribute to the growth of the Next-Generation Antibody Therapeutics market. Technological advancements in antibody engineering, leading to the development of more effective and targeted therapies, are a primary driver. The increasing prevalence of chronic diseases, including cancer and autoimmune disorders, creates a significant unmet medical need. Favorable regulatory environments in key markets, supporting the development and approval of innovative therapies, also contribute to market growth. Furthermore, substantial investments in research and development by pharmaceutical companies are fueling innovation and expanding the market.
Challenges in the Next-Generation Antibody Therapeutics Market Sector
The Next-Generation Antibody Therapeutics market faces several challenges. The high cost of drug development and manufacturing, coupled with stringent regulatory requirements, can limit market entry for smaller companies. Supply chain disruptions and competition from established therapies are potential constraints to market expansion. The complexity of clinical trials and the need for robust clinical data to demonstrate efficacy and safety present hurdles to approval and market access. Pricing pressures and reimbursement policies in various healthcare systems may also impact market growth. These factors can lead to reduced profitability, which impacts the willingness to invest in developing new therapies.
Emerging Opportunities in Next-Generation Antibody Therapeutics Market
Several emerging trends and opportunities exist in the Next-Generation Antibody Therapeutics market. The development of innovative antibody technologies, such as bispecific antibodies and antibody-drug conjugates with improved efficacy and safety profiles, represents a significant opportunity. The growing adoption of personalized medicine approaches is expected to drive demand for targeted therapies tailored to specific patient populations. Expansion into emerging markets with a high prevalence of chronic diseases will create new growth opportunities. The increasing focus on early detection and prevention of diseases may foster the development of antibody-based diagnostic tools and prophylactic therapies, thereby expanding the overall market.
Leading Players in the Next-Generation Antibody Therapeutics Market Market
Key Developments in Next-Generation Antibody Therapeutics Market Industry
- July 2022: Byondis received biologics license application acceptance from the U.S. FDA for Vic-Trastuzumab Duocarmazine (SYD985), an antibody-drug conjugate, as a treatment for patients with HER2-positive advanced breast cancer. This approval signifies a significant advancement in ADC therapy for breast cancer, driving market expansion.
- December 2022: Sorrento Therapeutics, Inc. received clearance from the U.S. FDA to initiate clinical trials with its next-generation mRNA (STI-1557) vaccine against SARS-CoV-2 Omicron variants. While not directly a next-generation antibody, this development highlights the broader landscape of advanced therapeutics and their impact on the market's overall growth.
Future Outlook for Next-Generation Antibody Therapeutics Market Market
The Next-Generation Antibody Therapeutics market is poised for continued robust growth, driven by ongoing technological advancements, increasing prevalence of chronic diseases, and substantial investments in R&D. The development of novel antibody technologies, expansion into new therapeutic areas, and the increasing adoption of personalized medicine approaches will further fuel market expansion. Strategic collaborations and partnerships between pharmaceutical companies and biotech firms will accelerate innovation and expedite the development of next-generation antibody therapies. The market presents significant opportunities for companies with innovative technologies and a strong focus on clinical development and regulatory strategy.
Next-Generation Antibody Therapeutics Market Segmentation
-
1. Therapeutic Area
- 1.1. Oncology
- 1.2. Autoimmune/Inflammatory
-
2. Technology
- 2.1. Antibody-Drug Conjugates (ADCs)
- 2.2. Bispecific Antibodies (BsAbs)
- 2.3. Fc-Engineered Antibodies
- 2.4. Antibody
- 2.5. Biosimilar Antibody Products
Next-Generation Antibody Therapeutics Market Segmentation By Geography
-
1. North America
- 1.1. United States
- 1.2. Canada
- 1.3. Mexico
-
2. Europe
- 2.1. Germany
- 2.2. United Kingdom
- 2.3. France
- 2.4. Italy
- 2.5. Spain
- 2.6. Rest of Europe
-
3. Asia Pacific
- 3.1. China
- 3.2. Japan
- 3.3. India
- 3.4. Australia
- 3.5. South Korea
- 3.6. Rest of Asia Pacific
-
4. Middle East and Africa
- 4.1. GCC
- 4.2. South Africa
- 4.3. Rest of Middle East and Africa
-
5. South America
- 5.1. Brazil
- 5.2. Argentina
- 5.3. Rest of South America
Next-Generation Antibody Therapeutics Market Regional Market Share
Geographic Coverage of Next-Generation Antibody Therapeutics Market
Next-Generation Antibody Therapeutics Market REPORT HIGHLIGHTS
| Aspects | Details |
|---|---|
| Study Period | 2020-2034 |
| Base Year | 2025 |
| Estimated Year | 2026 |
| Forecast Period | 2026-2034 |
| Historical Period | 2020-2025 |
| Growth Rate | CAGR of 10.9% from 2020-2034 |
| Segmentation |
|
Table of Contents
- 1. Introduction
- 1.1. Research Scope
- 1.2. Market Segmentation
- 1.3. Research Objective
- 1.4. Definitions and Assumptions
- 2. Executive Summary
- 2.1. Market Snapshot
- 3. Market Dynamics
- 3.1. Market Drivers
- 3.2. Market Restrains
- 3.3. Market Trends
- 3.4. Market Opportunities
- 4. Market Factor Analysis
- 4.1. Porters Five Forces
- 4.1.1. Bargaining Power of Suppliers
- 4.1.2. Bargaining Power of Buyers
- 4.1.3. Threat of New Entrants
- 4.1.4. Threat of Substitutes
- 4.1.5. Competitive Rivalry
- 4.2. PESTEL analysis
- 4.3. BCG Analysis
- 4.3.1. Stars (High Growth, High Market Share)
- 4.3.2. Cash Cows (Low Growth, High Market Share)
- 4.3.3. Question Mark (High Growth, Low Market Share)
- 4.3.4. Dogs (Low Growth, Low Market Share)
- 4.4. Ansoff Matrix Analysis
- 4.5. Supply Chain Analysis
- 4.6. Regulatory Landscape
- 4.7. Current Market Potential and Opportunity Assessment (TAM–SAM–SOM Framework)
- 4.8. PRI Analyst Note
- 4.1. Porters Five Forces
- 5. Market Analysis, Insights and Forecast 2021-2033
- 5.1. Market Analysis, Insights and Forecast - by Therapeutic Area
- 5.1.1. Oncology
- 5.1.2. Autoimmune/Inflammatory
- 5.2. Market Analysis, Insights and Forecast - by Technology
- 5.2.1. Antibody-Drug Conjugates (ADCs)
- 5.2.2. Bispecific Antibodies (BsAbs)
- 5.2.3. Fc-Engineered Antibodies
- 5.2.4. Antibody
- 5.2.5. Biosimilar Antibody Products
- 5.3. Market Analysis, Insights and Forecast - by Region
- 5.3.1. North America
- 5.3.2. Europe
- 5.3.3. Asia Pacific
- 5.3.4. Middle East and Africa
- 5.3.5. South America
- 5.1. Market Analysis, Insights and Forecast - by Therapeutic Area
- 6. Global Next-Generation Antibody Therapeutics Market Analysis, Insights and Forecast, 2021-2033
- 6.1. Market Analysis, Insights and Forecast - by Therapeutic Area
- 6.1.1. Oncology
- 6.1.2. Autoimmune/Inflammatory
- 6.2. Market Analysis, Insights and Forecast - by Technology
- 6.2.1. Antibody-Drug Conjugates (ADCs)
- 6.2.2. Bispecific Antibodies (BsAbs)
- 6.2.3. Fc-Engineered Antibodies
- 6.2.4. Antibody
- 6.2.5. Biosimilar Antibody Products
- 6.1. Market Analysis, Insights and Forecast - by Therapeutic Area
- 7. North America Next-Generation Antibody Therapeutics Market Analysis, Insights and Forecast, 2020-2032
- 7.1. Market Analysis, Insights and Forecast - by Therapeutic Area
- 7.1.1. Oncology
- 7.1.2. Autoimmune/Inflammatory
- 7.2. Market Analysis, Insights and Forecast - by Technology
- 7.2.1. Antibody-Drug Conjugates (ADCs)
- 7.2.2. Bispecific Antibodies (BsAbs)
- 7.2.3. Fc-Engineered Antibodies
- 7.2.4. Antibody
- 7.2.5. Biosimilar Antibody Products
- 7.1. Market Analysis, Insights and Forecast - by Therapeutic Area
- 8. Europe Next-Generation Antibody Therapeutics Market Analysis, Insights and Forecast, 2020-2032
- 8.1. Market Analysis, Insights and Forecast - by Therapeutic Area
- 8.1.1. Oncology
- 8.1.2. Autoimmune/Inflammatory
- 8.2. Market Analysis, Insights and Forecast - by Technology
- 8.2.1. Antibody-Drug Conjugates (ADCs)
- 8.2.2. Bispecific Antibodies (BsAbs)
- 8.2.3. Fc-Engineered Antibodies
- 8.2.4. Antibody
- 8.2.5. Biosimilar Antibody Products
- 8.1. Market Analysis, Insights and Forecast - by Therapeutic Area
- 9. Asia Pacific Next-Generation Antibody Therapeutics Market Analysis, Insights and Forecast, 2020-2032
- 9.1. Market Analysis, Insights and Forecast - by Therapeutic Area
- 9.1.1. Oncology
- 9.1.2. Autoimmune/Inflammatory
- 9.2. Market Analysis, Insights and Forecast - by Technology
- 9.2.1. Antibody-Drug Conjugates (ADCs)
- 9.2.2. Bispecific Antibodies (BsAbs)
- 9.2.3. Fc-Engineered Antibodies
- 9.2.4. Antibody
- 9.2.5. Biosimilar Antibody Products
- 9.1. Market Analysis, Insights and Forecast - by Therapeutic Area
- 10. Middle East and Africa Next-Generation Antibody Therapeutics Market Analysis, Insights and Forecast, 2020-2032
- 10.1. Market Analysis, Insights and Forecast - by Therapeutic Area
- 10.1.1. Oncology
- 10.1.2. Autoimmune/Inflammatory
- 10.2. Market Analysis, Insights and Forecast - by Technology
- 10.2.1. Antibody-Drug Conjugates (ADCs)
- 10.2.2. Bispecific Antibodies (BsAbs)
- 10.2.3. Fc-Engineered Antibodies
- 10.2.4. Antibody
- 10.2.5. Biosimilar Antibody Products
- 10.1. Market Analysis, Insights and Forecast - by Therapeutic Area
- 11. South America Next-Generation Antibody Therapeutics Market Analysis, Insights and Forecast, 2020-2032
- 11.1. Market Analysis, Insights and Forecast - by Therapeutic Area
- 11.1.1. Oncology
- 11.1.2. Autoimmune/Inflammatory
- 11.2. Market Analysis, Insights and Forecast - by Technology
- 11.2.1. Antibody-Drug Conjugates (ADCs)
- 11.2.2. Bispecific Antibodies (BsAbs)
- 11.2.3. Fc-Engineered Antibodies
- 11.2.4. Antibody
- 11.2.5. Biosimilar Antibody Products
- 11.1. Market Analysis, Insights and Forecast - by Therapeutic Area
- 12. Competitive Analysis
- 12.1. Company Profiles
- 12.1.1 Kyowa Hakko Kirin Co Ltd
- 12.1.1.1. Company Overview
- 12.1.1.2. Products
- 12.1.1.3. Company Financials
- 12.1.1.4. SWOT Analysis
- 12.1.2 Bayer AG
- 12.1.2.1. Company Overview
- 12.1.2.2. Products
- 12.1.2.3. Company Financials
- 12.1.2.4. SWOT Analysis
- 12.1.3 Amgen Inc
- 12.1.3.1. Company Overview
- 12.1.3.2. Products
- 12.1.3.3. Company Financials
- 12.1.3.4. SWOT Analysis
- 12.1.4 ImmunoGen Inc
- 12.1.4.1. Company Overview
- 12.1.4.2. Products
- 12.1.4.3. Company Financials
- 12.1.4.4. SWOT Analysis
- 12.1.5 Xencor Inc
- 12.1.5.1. Company Overview
- 12.1.5.2. Products
- 12.1.5.3. Company Financials
- 12.1.5.4. SWOT Analysis
- 12.1.6 F Hoffmann-La Roche Ltd
- 12.1.6.1. Company Overview
- 12.1.6.2. Products
- 12.1.6.3. Company Financials
- 12.1.6.4. SWOT Analysis
- 12.1.7 GlaxoSmithKline Plc
- 12.1.7.1. Company Overview
- 12.1.7.2. Products
- 12.1.7.3. Company Financials
- 12.1.7.4. SWOT Analysis
- 12.1.8 Biogen
- 12.1.8.1. Company Overview
- 12.1.8.2. Products
- 12.1.8.3. Company Financials
- 12.1.8.4. SWOT Analysis
- 12.1.9 AstraZeneca Plc
- 12.1.9.1. Company Overview
- 12.1.9.2. Products
- 12.1.9.3. Company Financials
- 12.1.9.4. SWOT Analysis
- 12.1.10 Seagen Inc
- 12.1.10.1. Company Overview
- 12.1.10.2. Products
- 12.1.10.3. Company Financials
- 12.1.10.4. SWOT Analysis
- 12.1.11 Bristol-Myers Squibb Company
- 12.1.11.1. Company Overview
- 12.1.11.2. Products
- 12.1.11.3. Company Financials
- 12.1.11.4. SWOT Analysis
- 12.1.12 Pfizer Inc
- 12.1.12.1. Company Overview
- 12.1.12.2. Products
- 12.1.12.3. Company Financials
- 12.1.12.4. SWOT Analysis
- 12.1.1 Kyowa Hakko Kirin Co Ltd
- 12.2. Market Entropy
- 12.2.1 Company's Key Areas Served
- 12.2.2 Recent Developments
- 12.3. Company Market Share Analysis 2025
- 12.3.1 Top 5 Companies Market Share Analysis
- 12.3.2 Top 3 Companies Market Share Analysis
- 12.4. List of Potential Customers
- 13. Research Methodology
List of Figures
- Figure 1: Global Next-Generation Antibody Therapeutics Market Revenue Breakdown (billion, %) by Region 2025 & 2033
- Figure 2: Global Next-Generation Antibody Therapeutics Market Volume Breakdown (K Unit, %) by Region 2025 & 2033
- Figure 3: North America Next-Generation Antibody Therapeutics Market Revenue (billion), by Therapeutic Area 2025 & 2033
- Figure 4: North America Next-Generation Antibody Therapeutics Market Volume (K Unit), by Therapeutic Area 2025 & 2033
- Figure 5: North America Next-Generation Antibody Therapeutics Market Revenue Share (%), by Therapeutic Area 2025 & 2033
- Figure 6: North America Next-Generation Antibody Therapeutics Market Volume Share (%), by Therapeutic Area 2025 & 2033
- Figure 7: North America Next-Generation Antibody Therapeutics Market Revenue (billion), by Technology 2025 & 2033
- Figure 8: North America Next-Generation Antibody Therapeutics Market Volume (K Unit), by Technology 2025 & 2033
- Figure 9: North America Next-Generation Antibody Therapeutics Market Revenue Share (%), by Technology 2025 & 2033
- Figure 10: North America Next-Generation Antibody Therapeutics Market Volume Share (%), by Technology 2025 & 2033
- Figure 11: North America Next-Generation Antibody Therapeutics Market Revenue (billion), by Country 2025 & 2033
- Figure 12: North America Next-Generation Antibody Therapeutics Market Volume (K Unit), by Country 2025 & 2033
- Figure 13: North America Next-Generation Antibody Therapeutics Market Revenue Share (%), by Country 2025 & 2033
- Figure 14: North America Next-Generation Antibody Therapeutics Market Volume Share (%), by Country 2025 & 2033
- Figure 15: Europe Next-Generation Antibody Therapeutics Market Revenue (billion), by Therapeutic Area 2025 & 2033
- Figure 16: Europe Next-Generation Antibody Therapeutics Market Volume (K Unit), by Therapeutic Area 2025 & 2033
- Figure 17: Europe Next-Generation Antibody Therapeutics Market Revenue Share (%), by Therapeutic Area 2025 & 2033
- Figure 18: Europe Next-Generation Antibody Therapeutics Market Volume Share (%), by Therapeutic Area 2025 & 2033
- Figure 19: Europe Next-Generation Antibody Therapeutics Market Revenue (billion), by Technology 2025 & 2033
- Figure 20: Europe Next-Generation Antibody Therapeutics Market Volume (K Unit), by Technology 2025 & 2033
- Figure 21: Europe Next-Generation Antibody Therapeutics Market Revenue Share (%), by Technology 2025 & 2033
- Figure 22: Europe Next-Generation Antibody Therapeutics Market Volume Share (%), by Technology 2025 & 2033
- Figure 23: Europe Next-Generation Antibody Therapeutics Market Revenue (billion), by Country 2025 & 2033
- Figure 24: Europe Next-Generation Antibody Therapeutics Market Volume (K Unit), by Country 2025 & 2033
- Figure 25: Europe Next-Generation Antibody Therapeutics Market Revenue Share (%), by Country 2025 & 2033
- Figure 26: Europe Next-Generation Antibody Therapeutics Market Volume Share (%), by Country 2025 & 2033
- Figure 27: Asia Pacific Next-Generation Antibody Therapeutics Market Revenue (billion), by Therapeutic Area 2025 & 2033
- Figure 28: Asia Pacific Next-Generation Antibody Therapeutics Market Volume (K Unit), by Therapeutic Area 2025 & 2033
- Figure 29: Asia Pacific Next-Generation Antibody Therapeutics Market Revenue Share (%), by Therapeutic Area 2025 & 2033
- Figure 30: Asia Pacific Next-Generation Antibody Therapeutics Market Volume Share (%), by Therapeutic Area 2025 & 2033
- Figure 31: Asia Pacific Next-Generation Antibody Therapeutics Market Revenue (billion), by Technology 2025 & 2033
- Figure 32: Asia Pacific Next-Generation Antibody Therapeutics Market Volume (K Unit), by Technology 2025 & 2033
- Figure 33: Asia Pacific Next-Generation Antibody Therapeutics Market Revenue Share (%), by Technology 2025 & 2033
- Figure 34: Asia Pacific Next-Generation Antibody Therapeutics Market Volume Share (%), by Technology 2025 & 2033
- Figure 35: Asia Pacific Next-Generation Antibody Therapeutics Market Revenue (billion), by Country 2025 & 2033
- Figure 36: Asia Pacific Next-Generation Antibody Therapeutics Market Volume (K Unit), by Country 2025 & 2033
- Figure 37: Asia Pacific Next-Generation Antibody Therapeutics Market Revenue Share (%), by Country 2025 & 2033
- Figure 38: Asia Pacific Next-Generation Antibody Therapeutics Market Volume Share (%), by Country 2025 & 2033
- Figure 39: Middle East and Africa Next-Generation Antibody Therapeutics Market Revenue (billion), by Therapeutic Area 2025 & 2033
- Figure 40: Middle East and Africa Next-Generation Antibody Therapeutics Market Volume (K Unit), by Therapeutic Area 2025 & 2033
- Figure 41: Middle East and Africa Next-Generation Antibody Therapeutics Market Revenue Share (%), by Therapeutic Area 2025 & 2033
- Figure 42: Middle East and Africa Next-Generation Antibody Therapeutics Market Volume Share (%), by Therapeutic Area 2025 & 2033
- Figure 43: Middle East and Africa Next-Generation Antibody Therapeutics Market Revenue (billion), by Technology 2025 & 2033
- Figure 44: Middle East and Africa Next-Generation Antibody Therapeutics Market Volume (K Unit), by Technology 2025 & 2033
- Figure 45: Middle East and Africa Next-Generation Antibody Therapeutics Market Revenue Share (%), by Technology 2025 & 2033
- Figure 46: Middle East and Africa Next-Generation Antibody Therapeutics Market Volume Share (%), by Technology 2025 & 2033
- Figure 47: Middle East and Africa Next-Generation Antibody Therapeutics Market Revenue (billion), by Country 2025 & 2033
- Figure 48: Middle East and Africa Next-Generation Antibody Therapeutics Market Volume (K Unit), by Country 2025 & 2033
- Figure 49: Middle East and Africa Next-Generation Antibody Therapeutics Market Revenue Share (%), by Country 2025 & 2033
- Figure 50: Middle East and Africa Next-Generation Antibody Therapeutics Market Volume Share (%), by Country 2025 & 2033
- Figure 51: South America Next-Generation Antibody Therapeutics Market Revenue (billion), by Therapeutic Area 2025 & 2033
- Figure 52: South America Next-Generation Antibody Therapeutics Market Volume (K Unit), by Therapeutic Area 2025 & 2033
- Figure 53: South America Next-Generation Antibody Therapeutics Market Revenue Share (%), by Therapeutic Area 2025 & 2033
- Figure 54: South America Next-Generation Antibody Therapeutics Market Volume Share (%), by Therapeutic Area 2025 & 2033
- Figure 55: South America Next-Generation Antibody Therapeutics Market Revenue (billion), by Technology 2025 & 2033
- Figure 56: South America Next-Generation Antibody Therapeutics Market Volume (K Unit), by Technology 2025 & 2033
- Figure 57: South America Next-Generation Antibody Therapeutics Market Revenue Share (%), by Technology 2025 & 2033
- Figure 58: South America Next-Generation Antibody Therapeutics Market Volume Share (%), by Technology 2025 & 2033
- Figure 59: South America Next-Generation Antibody Therapeutics Market Revenue (billion), by Country 2025 & 2033
- Figure 60: South America Next-Generation Antibody Therapeutics Market Volume (K Unit), by Country 2025 & 2033
- Figure 61: South America Next-Generation Antibody Therapeutics Market Revenue Share (%), by Country 2025 & 2033
- Figure 62: South America Next-Generation Antibody Therapeutics Market Volume Share (%), by Country 2025 & 2033
List of Tables
- Table 1: Global Next-Generation Antibody Therapeutics Market Revenue billion Forecast, by Therapeutic Area 2020 & 2033
- Table 2: Global Next-Generation Antibody Therapeutics Market Volume K Unit Forecast, by Therapeutic Area 2020 & 2033
- Table 3: Global Next-Generation Antibody Therapeutics Market Revenue billion Forecast, by Technology 2020 & 2033
- Table 4: Global Next-Generation Antibody Therapeutics Market Volume K Unit Forecast, by Technology 2020 & 2033
- Table 5: Global Next-Generation Antibody Therapeutics Market Revenue billion Forecast, by Region 2020 & 2033
- Table 6: Global Next-Generation Antibody Therapeutics Market Volume K Unit Forecast, by Region 2020 & 2033
- Table 7: Global Next-Generation Antibody Therapeutics Market Revenue billion Forecast, by Therapeutic Area 2020 & 2033
- Table 8: Global Next-Generation Antibody Therapeutics Market Volume K Unit Forecast, by Therapeutic Area 2020 & 2033
- Table 9: Global Next-Generation Antibody Therapeutics Market Revenue billion Forecast, by Technology 2020 & 2033
- Table 10: Global Next-Generation Antibody Therapeutics Market Volume K Unit Forecast, by Technology 2020 & 2033
- Table 11: Global Next-Generation Antibody Therapeutics Market Revenue billion Forecast, by Country 2020 & 2033
- Table 12: Global Next-Generation Antibody Therapeutics Market Volume K Unit Forecast, by Country 2020 & 2033
- Table 13: United States Next-Generation Antibody Therapeutics Market Revenue (billion) Forecast, by Application 2020 & 2033
- Table 14: United States Next-Generation Antibody Therapeutics Market Volume (K Unit) Forecast, by Application 2020 & 2033
- Table 15: Canada Next-Generation Antibody Therapeutics Market Revenue (billion) Forecast, by Application 2020 & 2033
- Table 16: Canada Next-Generation Antibody Therapeutics Market Volume (K Unit) Forecast, by Application 2020 & 2033
- Table 17: Mexico Next-Generation Antibody Therapeutics Market Revenue (billion) Forecast, by Application 2020 & 2033
- Table 18: Mexico Next-Generation Antibody Therapeutics Market Volume (K Unit) Forecast, by Application 2020 & 2033
- Table 19: Global Next-Generation Antibody Therapeutics Market Revenue billion Forecast, by Therapeutic Area 2020 & 2033
- Table 20: Global Next-Generation Antibody Therapeutics Market Volume K Unit Forecast, by Therapeutic Area 2020 & 2033
- Table 21: Global Next-Generation Antibody Therapeutics Market Revenue billion Forecast, by Technology 2020 & 2033
- Table 22: Global Next-Generation Antibody Therapeutics Market Volume K Unit Forecast, by Technology 2020 & 2033
- Table 23: Global Next-Generation Antibody Therapeutics Market Revenue billion Forecast, by Country 2020 & 2033
- Table 24: Global Next-Generation Antibody Therapeutics Market Volume K Unit Forecast, by Country 2020 & 2033
- Table 25: Germany Next-Generation Antibody Therapeutics Market Revenue (billion) Forecast, by Application 2020 & 2033
- Table 26: Germany Next-Generation Antibody Therapeutics Market Volume (K Unit) Forecast, by Application 2020 & 2033
- Table 27: United Kingdom Next-Generation Antibody Therapeutics Market Revenue (billion) Forecast, by Application 2020 & 2033
- Table 28: United Kingdom Next-Generation Antibody Therapeutics Market Volume (K Unit) Forecast, by Application 2020 & 2033
- Table 29: France Next-Generation Antibody Therapeutics Market Revenue (billion) Forecast, by Application 2020 & 2033
- Table 30: France Next-Generation Antibody Therapeutics Market Volume (K Unit) Forecast, by Application 2020 & 2033
- Table 31: Italy Next-Generation Antibody Therapeutics Market Revenue (billion) Forecast, by Application 2020 & 2033
- Table 32: Italy Next-Generation Antibody Therapeutics Market Volume (K Unit) Forecast, by Application 2020 & 2033
- Table 33: Spain Next-Generation Antibody Therapeutics Market Revenue (billion) Forecast, by Application 2020 & 2033
- Table 34: Spain Next-Generation Antibody Therapeutics Market Volume (K Unit) Forecast, by Application 2020 & 2033
- Table 35: Rest of Europe Next-Generation Antibody Therapeutics Market Revenue (billion) Forecast, by Application 2020 & 2033
- Table 36: Rest of Europe Next-Generation Antibody Therapeutics Market Volume (K Unit) Forecast, by Application 2020 & 2033
- Table 37: Global Next-Generation Antibody Therapeutics Market Revenue billion Forecast, by Therapeutic Area 2020 & 2033
- Table 38: Global Next-Generation Antibody Therapeutics Market Volume K Unit Forecast, by Therapeutic Area 2020 & 2033
- Table 39: Global Next-Generation Antibody Therapeutics Market Revenue billion Forecast, by Technology 2020 & 2033
- Table 40: Global Next-Generation Antibody Therapeutics Market Volume K Unit Forecast, by Technology 2020 & 2033
- Table 41: Global Next-Generation Antibody Therapeutics Market Revenue billion Forecast, by Country 2020 & 2033
- Table 42: Global Next-Generation Antibody Therapeutics Market Volume K Unit Forecast, by Country 2020 & 2033
- Table 43: China Next-Generation Antibody Therapeutics Market Revenue (billion) Forecast, by Application 2020 & 2033
- Table 44: China Next-Generation Antibody Therapeutics Market Volume (K Unit) Forecast, by Application 2020 & 2033
- Table 45: Japan Next-Generation Antibody Therapeutics Market Revenue (billion) Forecast, by Application 2020 & 2033
- Table 46: Japan Next-Generation Antibody Therapeutics Market Volume (K Unit) Forecast, by Application 2020 & 2033
- Table 47: India Next-Generation Antibody Therapeutics Market Revenue (billion) Forecast, by Application 2020 & 2033
- Table 48: India Next-Generation Antibody Therapeutics Market Volume (K Unit) Forecast, by Application 2020 & 2033
- Table 49: Australia Next-Generation Antibody Therapeutics Market Revenue (billion) Forecast, by Application 2020 & 2033
- Table 50: Australia Next-Generation Antibody Therapeutics Market Volume (K Unit) Forecast, by Application 2020 & 2033
- Table 51: South Korea Next-Generation Antibody Therapeutics Market Revenue (billion) Forecast, by Application 2020 & 2033
- Table 52: South Korea Next-Generation Antibody Therapeutics Market Volume (K Unit) Forecast, by Application 2020 & 2033
- Table 53: Rest of Asia Pacific Next-Generation Antibody Therapeutics Market Revenue (billion) Forecast, by Application 2020 & 2033
- Table 54: Rest of Asia Pacific Next-Generation Antibody Therapeutics Market Volume (K Unit) Forecast, by Application 2020 & 2033
- Table 55: Global Next-Generation Antibody Therapeutics Market Revenue billion Forecast, by Therapeutic Area 2020 & 2033
- Table 56: Global Next-Generation Antibody Therapeutics Market Volume K Unit Forecast, by Therapeutic Area 2020 & 2033
- Table 57: Global Next-Generation Antibody Therapeutics Market Revenue billion Forecast, by Technology 2020 & 2033
- Table 58: Global Next-Generation Antibody Therapeutics Market Volume K Unit Forecast, by Technology 2020 & 2033
- Table 59: Global Next-Generation Antibody Therapeutics Market Revenue billion Forecast, by Country 2020 & 2033
- Table 60: Global Next-Generation Antibody Therapeutics Market Volume K Unit Forecast, by Country 2020 & 2033
- Table 61: GCC Next-Generation Antibody Therapeutics Market Revenue (billion) Forecast, by Application 2020 & 2033
- Table 62: GCC Next-Generation Antibody Therapeutics Market Volume (K Unit) Forecast, by Application 2020 & 2033
- Table 63: South Africa Next-Generation Antibody Therapeutics Market Revenue (billion) Forecast, by Application 2020 & 2033
- Table 64: South Africa Next-Generation Antibody Therapeutics Market Volume (K Unit) Forecast, by Application 2020 & 2033
- Table 65: Rest of Middle East and Africa Next-Generation Antibody Therapeutics Market Revenue (billion) Forecast, by Application 2020 & 2033
- Table 66: Rest of Middle East and Africa Next-Generation Antibody Therapeutics Market Volume (K Unit) Forecast, by Application 2020 & 2033
- Table 67: Global Next-Generation Antibody Therapeutics Market Revenue billion Forecast, by Therapeutic Area 2020 & 2033
- Table 68: Global Next-Generation Antibody Therapeutics Market Volume K Unit Forecast, by Therapeutic Area 2020 & 2033
- Table 69: Global Next-Generation Antibody Therapeutics Market Revenue billion Forecast, by Technology 2020 & 2033
- Table 70: Global Next-Generation Antibody Therapeutics Market Volume K Unit Forecast, by Technology 2020 & 2033
- Table 71: Global Next-Generation Antibody Therapeutics Market Revenue billion Forecast, by Country 2020 & 2033
- Table 72: Global Next-Generation Antibody Therapeutics Market Volume K Unit Forecast, by Country 2020 & 2033
- Table 73: Brazil Next-Generation Antibody Therapeutics Market Revenue (billion) Forecast, by Application 2020 & 2033
- Table 74: Brazil Next-Generation Antibody Therapeutics Market Volume (K Unit) Forecast, by Application 2020 & 2033
- Table 75: Argentina Next-Generation Antibody Therapeutics Market Revenue (billion) Forecast, by Application 2020 & 2033
- Table 76: Argentina Next-Generation Antibody Therapeutics Market Volume (K Unit) Forecast, by Application 2020 & 2033
- Table 77: Rest of South America Next-Generation Antibody Therapeutics Market Revenue (billion) Forecast, by Application 2020 & 2033
- Table 78: Rest of South America Next-Generation Antibody Therapeutics Market Volume (K Unit) Forecast, by Application 2020 & 2033
Frequently Asked Questions
1. What is the projected Compound Annual Growth Rate (CAGR) of the Next-Generation Antibody Therapeutics Market?
The projected CAGR is approximately 10.9%.
2. Which companies are prominent players in the Next-Generation Antibody Therapeutics Market?
Key companies in the market include Kyowa Hakko Kirin Co Ltd, Bayer AG, Amgen Inc, ImmunoGen Inc, Xencor Inc, F Hoffmann-La Roche Ltd, GlaxoSmithKline Plc, Biogen, AstraZeneca Plc, Seagen Inc, Bristol-Myers Squibb Company, Pfizer Inc.
3. What are the main segments of the Next-Generation Antibody Therapeutics Market?
The market segments include Therapeutic Area, Technology.
4. Can you provide details about the market size?
The market size is estimated to be USD 7.63 billion as of 2022.
5. What are some drivers contributing to market growth?
Increasing Incidence of Cancer; Rising Prevalence of Autoimmune Diseases; Technological Progressions in Antibody Therapeutics.
6. What are the notable trends driving market growth?
Antibody-Drug Conjugates Segment is Expected to Hold the Largest Market Share in the Next-Generation Antibody Therapeutics Market.
7. Are there any restraints impacting market growth?
Stringent Regulatory Framework; High costs of Next-Generation Antibody Therapeutics.
8. Can you provide examples of recent developments in the market?
December 2022: Sorrento Therapeutics, Inc. received clearance from the U.S. FDA to initiate clinical trials with its next-generation mRNA (STI-1557) vaccine against SARS-CoV-2 Omicron variants.
9. What pricing options are available for accessing the report?
Pricing options include single-user, multi-user, and enterprise licenses priced at USD 4750, USD 5250, and USD 8750 respectively.
10. Is the market size provided in terms of value or volume?
The market size is provided in terms of value, measured in billion and volume, measured in K Unit.
11. Are there any specific market keywords associated with the report?
Yes, the market keyword associated with the report is "Next-Generation Antibody Therapeutics Market," which aids in identifying and referencing the specific market segment covered.
12. How do I determine which pricing option suits my needs best?
The pricing options vary based on user requirements and access needs. Individual users may opt for single-user licenses, while businesses requiring broader access may choose multi-user or enterprise licenses for cost-effective access to the report.
13. Are there any additional resources or data provided in the Next-Generation Antibody Therapeutics Market report?
While the report offers comprehensive insights, it's advisable to review the specific contents or supplementary materials provided to ascertain if additional resources or data are available.
14. How can I stay updated on further developments or reports in the Next-Generation Antibody Therapeutics Market?
To stay informed about further developments, trends, and reports in the Next-Generation Antibody Therapeutics Market, consider subscribing to industry newsletters, following relevant companies and organizations, or regularly checking reputable industry news sources and publications.
Methodology
Step 1 - Identification of Relevant Samples Size from Population Database


Step 2 - Approaches for Defining Global Market Size (Value, Volume* & Price*)

Note*: In applicable scenarios
Step 3 - Data Sources
Primary Research
- Web Analytics
- Survey Reports
- Research Institute
- Latest Research Reports
- Opinion Leaders
Secondary Research
- Annual Reports
- White Paper
- Latest Press Release
- Industry Association
- Paid Database
- Investor Presentations

Step 4 - Data Triangulation
Involves using different sources of information in order to increase the validity of a study
These sources are likely to be stakeholders in a program - participants, other researchers, program staff, other community members, and so on.
Then we put all data in single framework & apply various statistical tools to find out the dynamic on the market.
During the analysis stage, feedback from the stakeholder groups would be compared to determine areas of agreement as well as areas of divergence