

Key Insights
The North American energy drink market is projected to reach $23.9 billion by 2025, with a Compound Annual Growth Rate (CAGR) of 9.7% from 2025 to 2033. This growth is propelled by increasingly demanding lifestyles and a growing consumer preference for convenient energy solutions. The market is also experiencing a shift towards healthier alternatives, including natural, organic, and low-calorie options, though traditional formulations remain popular. Innovations in packaging, such as sleek cans and single-serve formats, are further enhancing market appeal. A competitive landscape featuring major players like Monster Beverage Corporation, PepsiCo, and The Coca-Cola Company, alongside agile niche brands focusing on specific consumer needs (e.g., organic, functional ingredients), drives continuous innovation and market expansion.
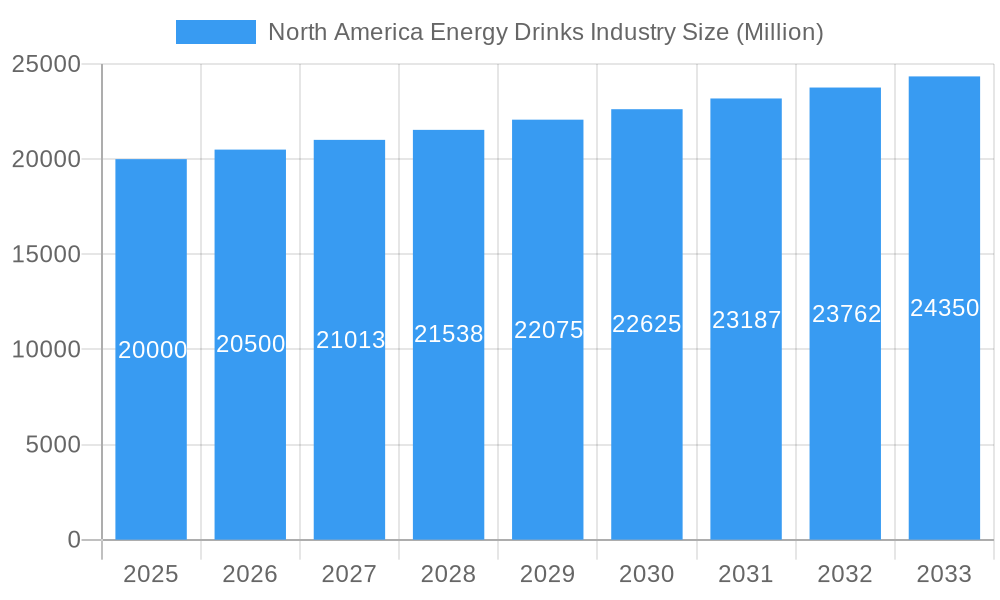
North America Energy Drinks Industry Market Size (In Billion)
Key challenges include rising consumer concerns about sugar content and potential health implications of excessive consumption. Evolving regulations concerning sugar levels and marketing practices could also influence market trajectory. Intense competition necessitates ongoing product development and robust branding strategies for sustained market presence. Fluctuations in raw material costs and broader economic conditions also present dynamic market influences. Despite these hurdles, the sustained demand for accessible energy boosts and persistent industry innovation indicate a promising future for the North American energy drink market, with opportunities for accelerated growth through strategic product diversification and targeted consumer engagement.
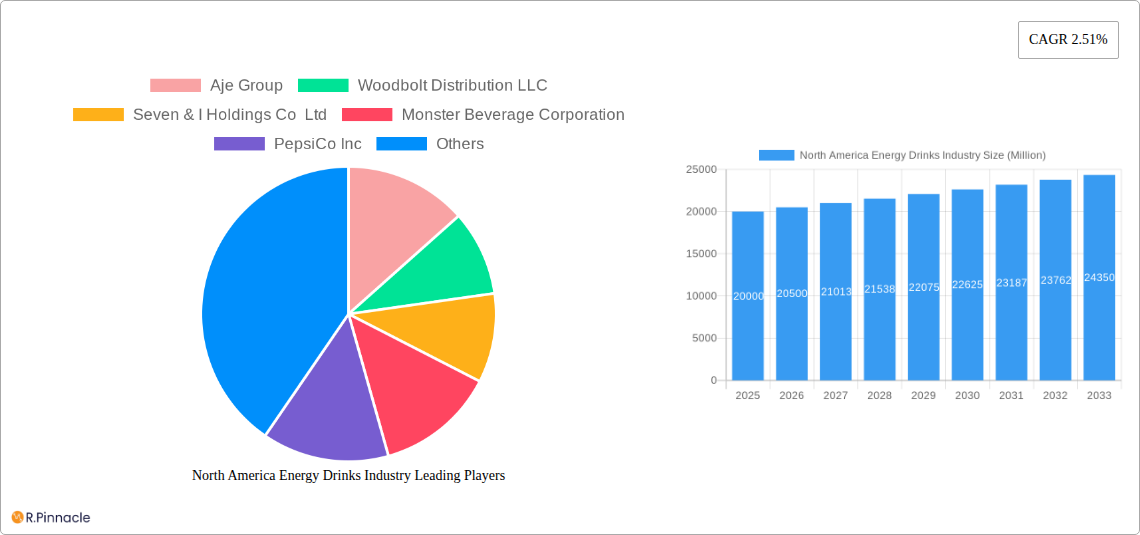
North America Energy Drinks Industry Company Market Share
North America Energy Drinks Industry Report: 2019-2033
This comprehensive report provides an in-depth analysis of the North America energy drinks market, offering valuable insights for industry professionals, investors, and stakeholders. Covering the period 2019-2033, with a focus on 2025, this report unveils market dynamics, growth drivers, and future trends. The analysis encompasses key segments, including various drink types, packaging, and distribution channels across the United States, Canada, Mexico, and the Rest of North America. Expect detailed competitive landscape analysis featuring key players like Monster Beverage Corporation, Red Bull GmbH, PepsiCo Inc., and more.
North America Energy Drinks Industry Market Structure & Innovation Trends
This section analyzes the North American energy drink market structure, highlighting market concentration, innovation drivers, regulatory frameworks, and M&A activities. The historical period (2019-2024) and the forecast period (2025-2033) are considered, with 2025 serving as the base year and estimated year.
Market Concentration: The North American energy drink market is moderately concentrated, with a few major players holding significant market share. Red Bull and Monster Beverage Corporation collectively hold an estimated xx% of the market, while PepsiCo and Coca-Cola also command substantial shares. Smaller players, including Aje Group, Living Essentials LLC, and Zevia LLC, compete through niche strategies and innovation.
Innovation Drivers: Consumer demand for healthier options (sugar-free, natural, organic) and functional benefits fuels innovation. Companies are developing new formulations, packaging, and flavors to cater to evolving preferences. Technological advancements in production and distribution also drive innovation.
Regulatory Frameworks: Government regulations on sugar content, labeling, and marketing impact the industry. These regulations vary across North American countries, influencing product formulations and marketing strategies.
Product Substitutes: Other beverages, such as sports drinks, functional waters, and coffee, compete with energy drinks. The market faces pressure to differentiate itself through unique formulations and health-focused positioning.
End-User Demographics: The primary consumers are young adults (18-35 years old), driven by energy needs and lifestyle preferences. However, the market is expanding to include older consumers seeking functional benefits.
M&A Activities: Recent mergers and acquisitions, such as Monster Beverage Corporation's acquisition of Bang Energy for approximately USD 362 Million in July 2023, indicate industry consolidation and expansion strategies. These deals often involve significant investments and reshape the competitive landscape. The total value of M&A deals in the period 2019-2024 is estimated at xx Million USD.
North America Energy Drinks Industry Market Dynamics & Trends
This section explores the market dynamics, including growth drivers, technological disruptions, consumer preferences, and competitive dynamics. The analysis incorporates key performance indicators (KPIs) such as compound annual growth rate (CAGR) and market penetration.
The North American energy drink market is experiencing robust growth, driven by factors such as increasing consumer demand for convenient energy sources, the rise of health-conscious consumers seeking functional benefits, and the introduction of innovative products. The market is predicted to witness a CAGR of xx% during the forecast period (2025-2033). This growth is fueled by increasing disposable incomes, particularly among young adults, and a growing preference for on-the-go consumption. Technological advancements, such as improved production processes and innovative packaging solutions, are further contributing to the market's expansion. Consumer preferences are shifting toward healthier options, such as sugar-free and natural energy drinks, creating new opportunities for innovative product development. Competitive dynamics are intense, with established players and new entrants vying for market share through product differentiation, branding, and marketing strategies. The market penetration of energy drinks in various consumer segments continues to grow, fueled by effective marketing campaigns and increasing availability across diverse channels. However, concerns regarding health and safety may pose potential challenges to market growth.
Dominant Regions & Segments in North America Energy Drinks Industry
This section identifies the leading regions and segments within the North American energy drink market.
Leading Region: The United States dominates the North American energy drinks market, accounting for the largest market share due to high consumer spending and a large population base.
Leading Countries: The United States, Canada, and Mexico are the key contributors to the regional market.
Leading Segments:
- Soft Drink Type: Traditional energy drinks hold the largest market share, but the segment of sugar-free or low-calorie energy drinks is experiencing rapid growth driven by health concerns.
- Packaging Type: Metal cans are the dominant packaging type due to convenience, durability, and cost-effectiveness. However, PET bottles are gaining popularity due to their recyclability and lighter weight.
- Distribution Channel: Off-trade channels (retail stores, supermarkets, convenience stores) hold the majority of the market share. On-trade channels (restaurants, bars, cafes) contribute to market demand but represent a smaller share.
Key Drivers:
- United States: Strong consumer demand, established distribution networks, and a high concentration of key players.
- Canada: Growing consumer awareness of health and wellness, increased disposable incomes, and a favorable regulatory environment.
- Mexico: Rising middle class with increased spending power and favorable demographics.
North America Energy Drinks Industry Product Innovations
The energy drink market witnesses continuous product innovation. Companies are introducing new flavors, functional ingredients, and packaging to cater to diverse consumer preferences and health concerns. Technological advancements such as enhanced production processes and sustainable packaging are also influencing product development. These innovations enable companies to offer unique selling propositions, enhance product differentiation, and strengthen their competitive positions. This includes a growing focus on natural ingredients, functional benefits beyond energy enhancement, and sustainable packaging alternatives.
Report Scope & Segmentation Analysis
This report segments the North American energy drinks market based on country (United States, Canada, Mexico, Rest of North America), soft drink type (Energy Shots, Natural/Organic Energy Drinks, Sugar-free or Low-calories Energy Drinks, Traditional Energy Drinks, Other Energy Drinks), packaging type (Glass Bottles, Metal Can, PET Bottles), and distribution channel (Off-trade, On-trade). Each segment's growth projection, market size (in millions), and competitive dynamics are analyzed.
Key Drivers of North America Energy Drinks Industry Growth
Several factors drive the growth of the North American energy drink market. These include changing consumer lifestyles, increasing demand for convenient energy sources, health consciousness (leading to the growth of sugar-free options), and ongoing product innovation. Furthermore, effective marketing campaigns and expanding distribution networks contribute significantly to market growth. Government regulations, while sometimes posing challenges, also shape product innovation and market dynamics.
Challenges in the North America Energy Drinks Industry Sector
The North American energy drinks industry faces challenges like intense competition, fluctuating raw material costs, and concerns regarding health and safety. The market experiences pressure from changing consumer preferences, shifting towards healthier options. Regulations regarding sugar content and labeling requirements pose ongoing challenges, impacting product formulation and marketing strategies. Supply chain disruptions and the increasing costs of raw materials further add to the operational challenges.
Emerging Opportunities in North America Energy Drinks Industry
Emerging opportunities lie in the expansion of healthier options, functional energy drinks, innovative packaging, and strategic partnerships. There is growing demand for natural and organic energy drinks, alongside functional beverages that cater to specific health needs. Sustainable packaging solutions and eco-friendly initiatives are becoming increasingly important. Strategic alliances and collaborations create opportunities for market expansion and product diversification.
Leading Players in the North America Energy Drinks Industry Market
- Aje Group
- Woodbolt Distribution LLC
- Seven & I Holdings Co Ltd
- Monster Beverage Corporation
- PepsiCo Inc
- DAS Labs LLC
- Red Bull GmbH
- Living Essentials LLC
- Zevia LLC
- The Coca-Cola Company
- N V E Pharmaceuticals
- Congo Brands
Key Developments in North America Energy Drinks Industry Industry
- July 2023: Monster Beverage Corporation acquired Bang Energy for approximately USD 362 Million, significantly impacting market share and competitive dynamics.
- July 2023: WWE and Nutrabolt launched a co-branded energy drink, expanding their partnership and creating a new product line.
- July 2023: Zevia LLC explored new distribution partnerships to expand into the single-serve cold beverage market.
Future Outlook for North America Energy Drinks Industry Market
The North American energy drink market is poised for continued growth, driven by innovation, changing consumer preferences, and the expansion of distribution channels. The market will likely witness increasing demand for healthier and functional energy drinks, leading to further product diversification and competition. The emphasis on sustainability and ethical sourcing will also shape future market trends. Companies will need to adapt to changing regulations and consumer demands to maintain their competitive edge and capitalize on emerging market opportunities. The market is expected to experience substantial growth throughout the forecast period, driven by these factors and the evolving demands of the consumer base.
North America Energy Drinks Industry Segmentation
-
1. Soft Drink Type
- 1.1. Energy Shots
- 1.2. Natural/Organic Energy Drinks
- 1.3. Sugar-free or Low-calories Energy Drinks
- 1.4. Traditional Energy Drinks
- 1.5. Other Energy Drinks
-
2. Packaging Type
- 2.1. Glass Bottles
- 2.2. Metal Can
- 2.3. PET Bottles
-
3. Distribution Channel
-
3.1. Off-trade
- 3.1.1. Convenience Stores
- 3.1.2. Online Retail
- 3.1.3. Supermarket/Hypermarket
- 3.1.4. Others
- 3.2. On-trade
-
3.1. Off-trade
North America Energy Drinks Industry Segmentation By Geography
-
1. North America
- 1.1. United States
- 1.2. Canada
- 1.3. Mexico
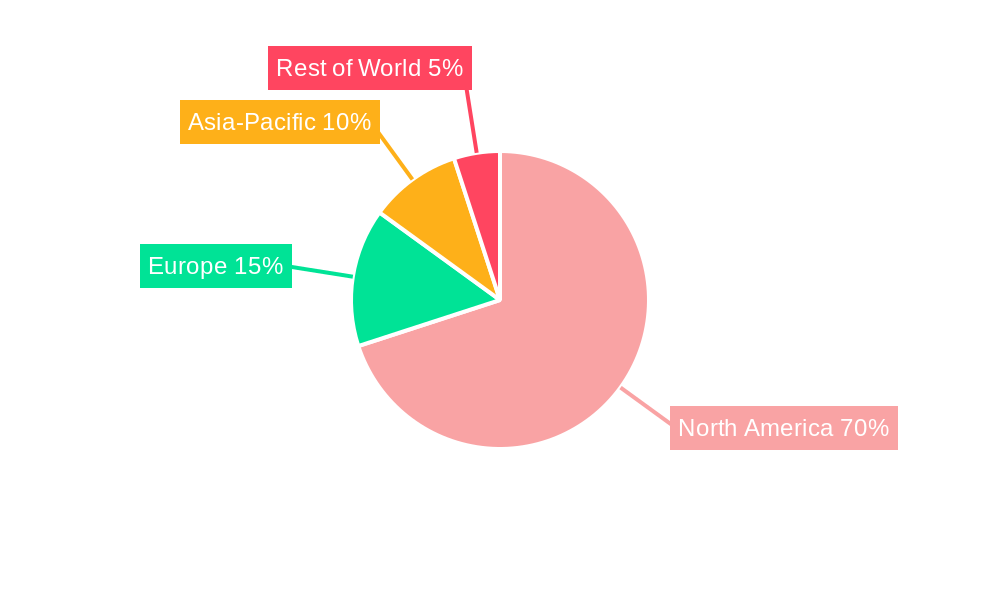
North America Energy Drinks Industry Regional Market Share
Geographic Coverage of North America Energy Drinks Industry
North America Energy Drinks Industry REPORT HIGHLIGHTS
| Aspects | Details |
|---|---|
| Study Period | 2020-2034 |
| Base Year | 2025 |
| Estimated Year | 2026 |
| Forecast Period | 2026-2034 |
| Historical Period | 2020-2025 |
| Growth Rate | CAGR of 9.7% from 2020-2034 |
| Segmentation |
|
Table of Contents
- 1. Introduction
- 1.1. Research Scope
- 1.2. Market Segmentation
- 1.3. Research Objective
- 1.4. Definitions and Assumptions
- 2. Executive Summary
- 2.1. Market Snapshot
- 3. Market Dynamics
- 3.1. Market Drivers
- 3.2. Market Restrains
- 3.3. Market Trends
- 3.4. Market Opportunities
- 4. Market Factor Analysis
- 4.1. Porters Five Forces
- 4.1.1. Bargaining Power of Suppliers
- 4.1.2. Bargaining Power of Buyers
- 4.1.3. Threat of New Entrants
- 4.1.4. Threat of Substitutes
- 4.1.5. Competitive Rivalry
- 4.2. PESTEL analysis
- 4.3. BCG Analysis
- 4.3.1. Stars (High Growth, High Market Share)
- 4.3.2. Cash Cows (Low Growth, High Market Share)
- 4.3.3. Question Mark (High Growth, Low Market Share)
- 4.3.4. Dogs (Low Growth, Low Market Share)
- 4.4. Ansoff Matrix Analysis
- 4.5. Supply Chain Analysis
- 4.6. Regulatory Landscape
- 4.7. Current Market Potential and Opportunity Assessment (TAM–SAM–SOM Framework)
- 4.8. PRI Analyst Note
- 4.1. Porters Five Forces
- 5. Market Analysis, Insights and Forecast 2021-2033
- 5.1. Market Analysis, Insights and Forecast - by Soft Drink Type
- 5.1.1. Energy Shots
- 5.1.2. Natural/Organic Energy Drinks
- 5.1.3. Sugar-free or Low-calories Energy Drinks
- 5.1.4. Traditional Energy Drinks
- 5.1.5. Other Energy Drinks
- 5.2. Market Analysis, Insights and Forecast - by Packaging Type
- 5.2.1. Glass Bottles
- 5.2.2. Metal Can
- 5.2.3. PET Bottles
- 5.3. Market Analysis, Insights and Forecast - by Distribution Channel
- 5.3.1. Off-trade
- 5.3.1.1. Convenience Stores
- 5.3.1.2. Online Retail
- 5.3.1.3. Supermarket/Hypermarket
- 5.3.1.4. Others
- 5.3.2. On-trade
- 5.3.1. Off-trade
- 5.4. Market Analysis, Insights and Forecast - by Region
- 5.4.1. North America
- 5.1. Market Analysis, Insights and Forecast - by Soft Drink Type
- 6. North America Energy Drinks Industry Analysis, Insights and Forecast, 2021-2033
- 6.1. Market Analysis, Insights and Forecast - by Soft Drink Type
- 6.1.1. Energy Shots
- 6.1.2. Natural/Organic Energy Drinks
- 6.1.3. Sugar-free or Low-calories Energy Drinks
- 6.1.4. Traditional Energy Drinks
- 6.1.5. Other Energy Drinks
- 6.2. Market Analysis, Insights and Forecast - by Packaging Type
- 6.2.1. Glass Bottles
- 6.2.2. Metal Can
- 6.2.3. PET Bottles
- 6.3. Market Analysis, Insights and Forecast - by Distribution Channel
- 6.3.1. Off-trade
- 6.3.1.1. Convenience Stores
- 6.3.1.2. Online Retail
- 6.3.1.3. Supermarket/Hypermarket
- 6.3.1.4. Others
- 6.3.2. On-trade
- 6.3.1. Off-trade
- 6.1. Market Analysis, Insights and Forecast - by Soft Drink Type
- 7. Competitive Analysis
- 7.1. Company Profiles
- 7.1.1 Aje Group
- 7.1.1.1. Company Overview
- 7.1.1.2. Products
- 7.1.1.3. Company Financials
- 7.1.1.4. SWOT Analysis
- 7.1.2 Woodbolt Distribution LLC
- 7.1.2.1. Company Overview
- 7.1.2.2. Products
- 7.1.2.3. Company Financials
- 7.1.2.4. SWOT Analysis
- 7.1.3 Seven & I Holdings Co Ltd
- 7.1.3.1. Company Overview
- 7.1.3.2. Products
- 7.1.3.3. Company Financials
- 7.1.3.4. SWOT Analysis
- 7.1.4 Monster Beverage Corporation
- 7.1.4.1. Company Overview
- 7.1.4.2. Products
- 7.1.4.3. Company Financials
- 7.1.4.4. SWOT Analysis
- 7.1.5 PepsiCo Inc
- 7.1.5.1. Company Overview
- 7.1.5.2. Products
- 7.1.5.3. Company Financials
- 7.1.5.4. SWOT Analysis
- 7.1.6 DAS Labs LLC
- 7.1.6.1. Company Overview
- 7.1.6.2. Products
- 7.1.6.3. Company Financials
- 7.1.6.4. SWOT Analysis
- 7.1.7 Red Bull GmbH
- 7.1.7.1. Company Overview
- 7.1.7.2. Products
- 7.1.7.3. Company Financials
- 7.1.7.4. SWOT Analysis
- 7.1.8 Living Essentials LLC
- 7.1.8.1. Company Overview
- 7.1.8.2. Products
- 7.1.8.3. Company Financials
- 7.1.8.4. SWOT Analysis
- 7.1.9 Zevia LL
- 7.1.9.1. Company Overview
- 7.1.9.2. Products
- 7.1.9.3. Company Financials
- 7.1.9.4. SWOT Analysis
- 7.1.10 The Coca-Cola Company
- 7.1.10.1. Company Overview
- 7.1.10.2. Products
- 7.1.10.3. Company Financials
- 7.1.10.4. SWOT Analysis
- 7.1.11 N V E Pharmaceuticals
- 7.1.11.1. Company Overview
- 7.1.11.2. Products
- 7.1.11.3. Company Financials
- 7.1.11.4. SWOT Analysis
- 7.1.12 Congo Brands
- 7.1.12.1. Company Overview
- 7.1.12.2. Products
- 7.1.12.3. Company Financials
- 7.1.12.4. SWOT Analysis
- 7.1.1 Aje Group
- 7.2. Market Entropy
- 7.2.1 Company's Key Areas Served
- 7.2.2 Recent Developments
- 7.3. Company Market Share Analysis 2025
- 7.3.1 Top 5 Companies Market Share Analysis
- 7.3.2 Top 3 Companies Market Share Analysis
- 7.4. List of Potential Customers
- 8. Research Methodology
List of Figures
- Figure 1: North America Energy Drinks Industry Revenue Breakdown (billion, %) by Product 2025 & 2033
- Figure 2: North America Energy Drinks Industry Share (%) by Company 2025
List of Tables
- Table 1: North America Energy Drinks Industry Revenue billion Forecast, by Soft Drink Type 2020 & 2033
- Table 2: North America Energy Drinks Industry Revenue billion Forecast, by Packaging Type 2020 & 2033
- Table 3: North America Energy Drinks Industry Revenue billion Forecast, by Distribution Channel 2020 & 2033
- Table 4: North America Energy Drinks Industry Revenue billion Forecast, by Region 2020 & 2033
- Table 5: North America Energy Drinks Industry Revenue billion Forecast, by Soft Drink Type 2020 & 2033
- Table 6: North America Energy Drinks Industry Revenue billion Forecast, by Packaging Type 2020 & 2033
- Table 7: North America Energy Drinks Industry Revenue billion Forecast, by Distribution Channel 2020 & 2033
- Table 8: North America Energy Drinks Industry Revenue billion Forecast, by Country 2020 & 2033
- Table 9: United States North America Energy Drinks Industry Revenue (billion) Forecast, by Application 2020 & 2033
- Table 10: Canada North America Energy Drinks Industry Revenue (billion) Forecast, by Application 2020 & 2033
- Table 11: Mexico North America Energy Drinks Industry Revenue (billion) Forecast, by Application 2020 & 2033
Frequently Asked Questions
1. What is the projected Compound Annual Growth Rate (CAGR) of the North America Energy Drinks Industry?
The projected CAGR is approximately 9.7%.
2. Which companies are prominent players in the North America Energy Drinks Industry?
Key companies in the market include Aje Group, Woodbolt Distribution LLC, Seven & I Holdings Co Ltd, Monster Beverage Corporation, PepsiCo Inc, DAS Labs LLC, Red Bull GmbH, Living Essentials LLC, Zevia LL, The Coca-Cola Company, N V E Pharmaceuticals, Congo Brands.
3. What are the main segments of the North America Energy Drinks Industry?
The market segments include Soft Drink Type, Packaging Type, Distribution Channel.
4. Can you provide details about the market size?
The market size is estimated to be USD 23.9 billion as of 2022.
5. What are some drivers contributing to market growth?
Increasing Demand for Functional and Fortified Food; Multi-functionality and Wide Application of Riboflavin.
6. What are the notable trends driving market growth?
OTHER KEY INDUSTRY TRENDS COVERED IN THE REPORT.
7. Are there any restraints impacting market growth?
Low Stability of Riboflavin on Exposure to Light and Heat.
8. Can you provide examples of recent developments in the market?
July 2023: Monster Beverage Corporation announced that its subsidiary, Blast Asset Acquisition LLC, completed its acquisition of substantially all of the assets of Vital Pharmaceuticals, Inc. and certain of its affiliates (collectively, “Bang Energy”) for approximately USD 362 million. The acquired assets include Bang Energy beverages and a beverage production facility in Phoenix, Arizona.July 2023: WWE and Nutrabolt, owner of the C4 brand, announced an expansion to their multi-year partnership with the launch of their first-ever co-branded product collaboration: WWE-inspired flavors of C4 Ultimate Pre-Workout Powder and C4 Ultimate Energy Drink.July 2023: The Los Angeles-based company Zevia LLC is considering getting a new distribution partner to expand its base business from selling multi-packs in grocery stores to selling single-serve cold beverages in c-stores.
9. What pricing options are available for accessing the report?
Pricing options include single-user, multi-user, and enterprise licenses priced at USD 3800, USD 4500, and USD 5800 respectively.
10. Is the market size provided in terms of value or volume?
The market size is provided in terms of value, measured in billion.
11. Are there any specific market keywords associated with the report?
Yes, the market keyword associated with the report is "North America Energy Drinks Industry," which aids in identifying and referencing the specific market segment covered.
12. How do I determine which pricing option suits my needs best?
The pricing options vary based on user requirements and access needs. Individual users may opt for single-user licenses, while businesses requiring broader access may choose multi-user or enterprise licenses for cost-effective access to the report.
13. Are there any additional resources or data provided in the North America Energy Drinks Industry report?
While the report offers comprehensive insights, it's advisable to review the specific contents or supplementary materials provided to ascertain if additional resources or data are available.
14. How can I stay updated on further developments or reports in the North America Energy Drinks Industry?
To stay informed about further developments, trends, and reports in the North America Energy Drinks Industry, consider subscribing to industry newsletters, following relevant companies and organizations, or regularly checking reputable industry news sources and publications.
Methodology
Step 1 - Identification of Relevant Samples Size from Population Database


Step 2 - Approaches for Defining Global Market Size (Value, Volume* & Price*)

Note*: In applicable scenarios
Step 3 - Data Sources
Primary Research
- Web Analytics
- Survey Reports
- Research Institute
- Latest Research Reports
- Opinion Leaders
Secondary Research
- Annual Reports
- White Paper
- Latest Press Release
- Industry Association
- Paid Database
- Investor Presentations

Step 4 - Data Triangulation
Involves using different sources of information in order to increase the validity of a study
These sources are likely to be stakeholders in a program - participants, other researchers, program staff, other community members, and so on.
Then we put all data in single framework & apply various statistical tools to find out the dynamic on the market.
During the analysis stage, feedback from the stakeholder groups would be compared to determine areas of agreement as well as areas of divergence