

Key Insights
The Nucleic Acid Amplification (NAA) market is projected for substantial expansion, propelled by the increasing incidence of infectious diseases, a growing need for rapid diagnostic solutions, and broadening applications in scientific research and development. The market is forecast to grow at a Compound Annual Growth Rate (CAGR) of 9.3%, with an estimated market size of 10.31 billion in 2025. This upward trajectory is further supported by advancements in isothermal amplification technologies, such as LAMP and NEAR, which offer more efficient and cost-effective diagnostic capabilities compared to traditional PCR methods. The NAA market is segmented by technology (including HDA, NEAR, LAMP, SDA, NASBA, TMA, SPIA), product types (instruments and reagents), and end-users (hospitals, research laboratories). North America currently leads the market due to its sophisticated healthcare infrastructure and significant R&D investments. However, the Asia-Pacific region is expected to experience considerable growth, driven by escalating healthcare expenditures and rising disease prevalence. Leading companies like Qiagen NV, Becton Dickinson, and BioMerieux SA are key contributors to innovation and market penetration within this sector.
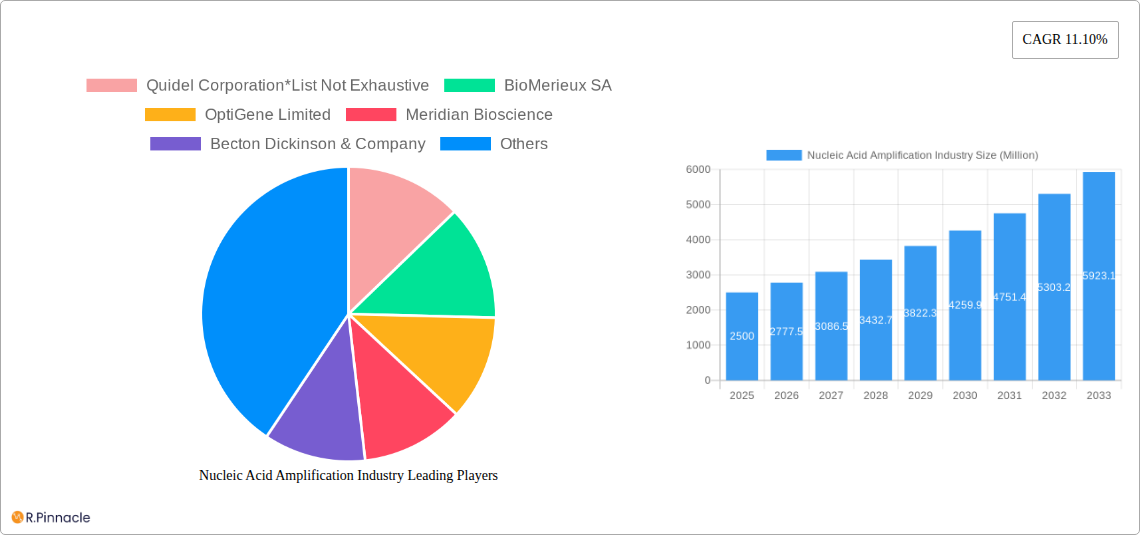
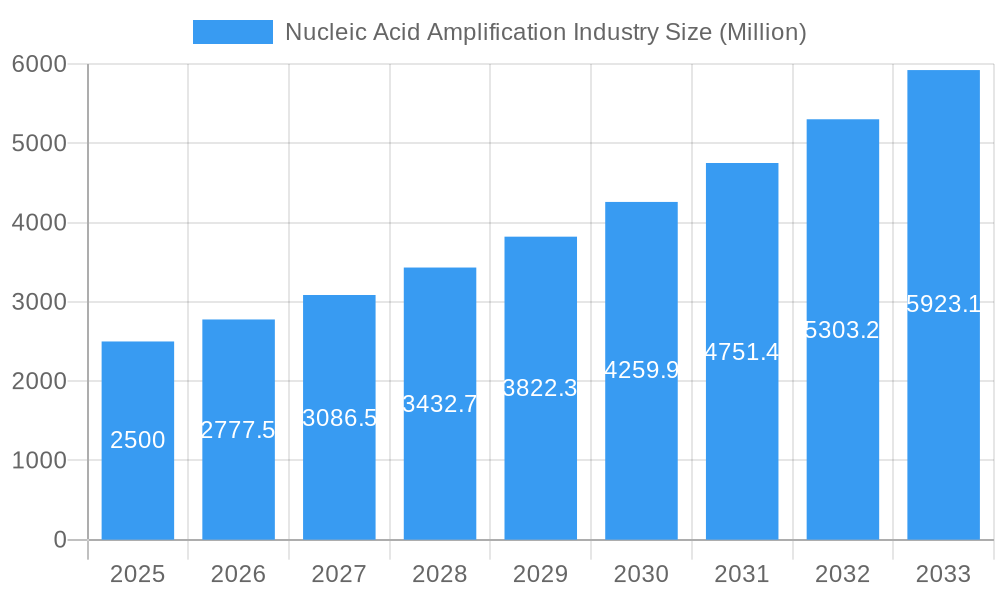
Nucleic Acid Amplification Industry Market Size (In Billion)
The competitive environment is marked by established companies and emerging players focused on developing innovative amplification techniques and intuitive instruments. Key market challenges include the substantial initial investment required for advanced technologies and regulatory complexities in obtaining new product approvals. Nevertheless, ongoing technological innovations and increasing government support for diagnostic development are expected to offset these restraints. A significant trend is the development of portable, point-of-care diagnostic platforms, enhancing accessibility to rapid and accurate NAA testing, particularly in underserved regions. This trend, combined with the growing demand for personalized medicine and advanced research applications, will continue to drive market growth and create significant opportunities for stakeholders.
Nucleic Acid Amplification Industry Company Market Share
Nucleic Acid Amplification Industry Market Report: 2019-2033
This comprehensive report provides a detailed analysis of the Nucleic Acid Amplification industry, covering market size, growth drivers, technological advancements, competitive landscape, and future outlook. The study period spans from 2019 to 2033, with 2025 serving as the base and estimated year. The report offers actionable insights for industry professionals, investors, and researchers seeking to understand and navigate this dynamic market. The global market size is projected to reach xx Million by 2033.
Nucleic Acid Amplification Industry Market Structure & Innovation Trends
The Nucleic Acid Amplification market is moderately consolidated, with key players such as Quidel Corporation, BioMerieux SA, Qiagen NV, and Meridian Bioscience holding significant market share. However, the presence of numerous smaller companies and startups indicates a competitive landscape. Innovation is driven by the need for faster, more sensitive, and portable amplification technologies, particularly for point-of-care diagnostics. Regulatory frameworks, such as those set by the FDA and other international bodies, significantly impact product development and market entry. The market witnesses continuous M&A activity, with deal values varying significantly depending on the size and strategic importance of the acquired company. For example, recent deals have ranged from xx Million to xx Million, reflecting consolidation and expansion strategies.
- Market Concentration: Moderately consolidated, with a few major players holding a significant share.
- Innovation Drivers: Demand for faster, more sensitive, and portable technologies; advancements in isothermal amplification techniques.
- Regulatory Landscape: Stringent regulatory approvals influence product development and market access.
- Product Substitutes: Limited direct substitutes, but alternative diagnostic methods pose indirect competition.
- End-User Demographics: Primarily hospitals and research laboratories, with growing demand from other end-users.
- M&A Activity: Ongoing mergers and acquisitions drive consolidation and market expansion. Recent deal values range from xx Million to xx Million.
Nucleic Acid Amplification Industry Market Dynamics & Trends
The Nucleic Acid Amplification market exhibits robust growth, driven primarily by the increasing prevalence of infectious diseases, the rising demand for rapid diagnostics, and the growing adoption of molecular diagnostic techniques in healthcare. The Compound Annual Growth Rate (CAGR) during the forecast period (2025-2033) is projected to be xx%, with market penetration steadily increasing across various healthcare settings. Technological advancements, such as the development of isothermal amplification methods, are significantly impacting the market by offering faster and more cost-effective solutions. Consumer preferences are shifting towards point-of-care diagnostics that provide rapid results, driving innovation in portable and user-friendly devices. Competitive dynamics are marked by both innovation and strategic partnerships, with companies focusing on expanding their product portfolios and geographical reach.
Dominant Regions & Segments in Nucleic Acid Amplification Industry
The North American region currently dominates the Nucleic Acid Amplification market, driven by high healthcare expenditure, robust research infrastructure, and early adoption of advanced technologies. However, the Asia-Pacific region shows significant growth potential due to rising infectious disease prevalence and increasing healthcare investments.
By Technology:
- LAMP (Loop-mediated Isothermal Amplification): High growth due to its simplicity, speed, and cost-effectiveness.
- Other Technologies: This segment includes emerging technologies with high potential for future growth.
By Product:
- Instruments: High initial investment but essential for large-scale testing.
- Reagents: Constitute a larger market share due to recurring demand.
By End-User:
- Hospitals: Largest end-user segment, driven by increasing diagnostic needs.
- Research Laboratories: Significant demand for research and development activities.
Key drivers include supportive government policies, robust healthcare infrastructure, and high healthcare expenditure in the dominant regions.
Nucleic Acid Amplification Industry Product Innovations
Recent product innovations include the development of more sensitive and specific assays, portable and user-friendly devices, and integrated systems that combine amplification with detection. These innovations address the market demand for faster, more accurate, and cost-effective diagnostic solutions. The focus is on point-of-care diagnostics, isothermal amplification methods, and multiplex assays that allow simultaneous detection of multiple targets.
Report Scope & Segmentation Analysis
This report segments the Nucleic Acid Amplification market by technology (HDA, NEAR, LAMP, SDA, NASBA, TMA, SPIA, Other Technologies), product (Instruments, Reagents), and end-user (Hospitals, Research Laboratories, Other End-Users). Each segment's growth projections, market size, and competitive dynamics are analyzed in detail. For instance, the LAMP technology segment is experiencing rapid growth due to its ease of use and cost-effectiveness. The reagents segment holds a larger market share compared to the instrument segment, due to the continuous demand for reagents in diagnostic assays.
Key Drivers of Nucleic Acid Amplification Industry Growth
Several factors drive growth, including: increasing prevalence of infectious diseases demanding rapid diagnostics, advancements in isothermal amplification technologies offering faster and simpler assays, rising healthcare expenditure, and government initiatives promoting early disease detection. The development of portable and user-friendly devices facilitates point-of-care testing, contributing significantly to market expansion.
Challenges in the Nucleic Acid Amplification Industry Sector
Challenges include stringent regulatory approvals, the high cost of advanced technologies limiting accessibility in resource-constrained settings, and the potential for supply chain disruptions impacting reagent availability. The competitive landscape also presents challenges, with companies continuously innovating to maintain a competitive edge. For example, the xx Million spent annually on regulatory compliance represents a substantial market challenge.
Emerging Opportunities in Nucleic Acid Amplification Industry
Emerging opportunities include the development of next-generation sequencing (NGS)-based amplification techniques, the integration of artificial intelligence (AI) for data analysis and disease prediction, and the expansion into new and underserved markets. The increasing focus on personalized medicine opens new avenues for developing targeted diagnostic solutions. Moreover, the rising prevalence of chronic diseases creates opportunities for developing advanced diagnostic assays.
Leading Players in the Nucleic Acid Amplification Industry Market
- Quidel Corporation
- BioMerieux SA
- OptiGene Limited
- Meridian Bioscience
- Becton Dickinson & Company
- Tecan Genomics Inc
- Lucigen
- Qiagen NV
- Eiken Chemical Co Ltd
Key Developments in Nucleic Acid Amplification Industry Industry
- August 2022: LGC Clinical Diagnostics extends its collaboration with Stanford Medicine, supporting global genetic and metabolic diagnostic testing.
- May 2022: Meridian Bioscience launches two new isothermal amplification products for point-of-care diagnostics.
Future Outlook for Nucleic Acid Amplification Industry Market
The Nucleic Acid Amplification market is poised for continued growth, driven by technological advancements, increasing healthcare spending, and the rising prevalence of infectious and chronic diseases. Strategic partnerships, acquisitions, and the development of novel diagnostic platforms will shape the future competitive landscape. The focus on point-of-care diagnostics and personalized medicine offers significant growth potential in the coming years.
Nucleic Acid Amplification Industry Segmentation
-
1. Technology
- 1.1. Helicase-dependent Amplification (HDA)
- 1.2. Nicking Enzyme Amplification Reaction (NEAR)
- 1.3. Loop-mediated Isothermal Amplification (LAMP)
- 1.4. Strand Displacement Amplification (SDA)
- 1.5. Nucleic Acid Sequence-based Amplification (NASBA)
- 1.6. Transcription Mediated Amplification (TMA)
- 1.7. Single Primer Isothermal Amplification (SPIA)
- 1.8. Other Technologies
-
2. Product
- 2.1. Instruments
- 2.2. Reagents
-
3. End-User
- 3.1. Hospitals
- 3.2. Research Laboratories
- 3.3. Other End-Users
Nucleic Acid Amplification Industry Segmentation By Geography
-
1. North America
- 1.1. United States
- 1.2. Canada
- 1.3. Mexico
-
2. Europe
- 2.1. Germany
- 2.2. United Kingdom
- 2.3. France
- 2.4. Italy
- 2.5. Spain
- 2.6. Rest of Europe
-
3. Asia Pacific
- 3.1. China
- 3.2. Japan
- 3.3. India
- 3.4. Australia
- 3.5. South Korea
- 3.6. Rest of Asia Pacific
-
4. Middle East and Africa
- 4.1. GCC
- 4.2. South Africa
- 4.3. Rest of Middle East and Africa
-
5. South America
- 5.1. Brazil
- 5.2. Argentina
- 5.3. Rest of South America
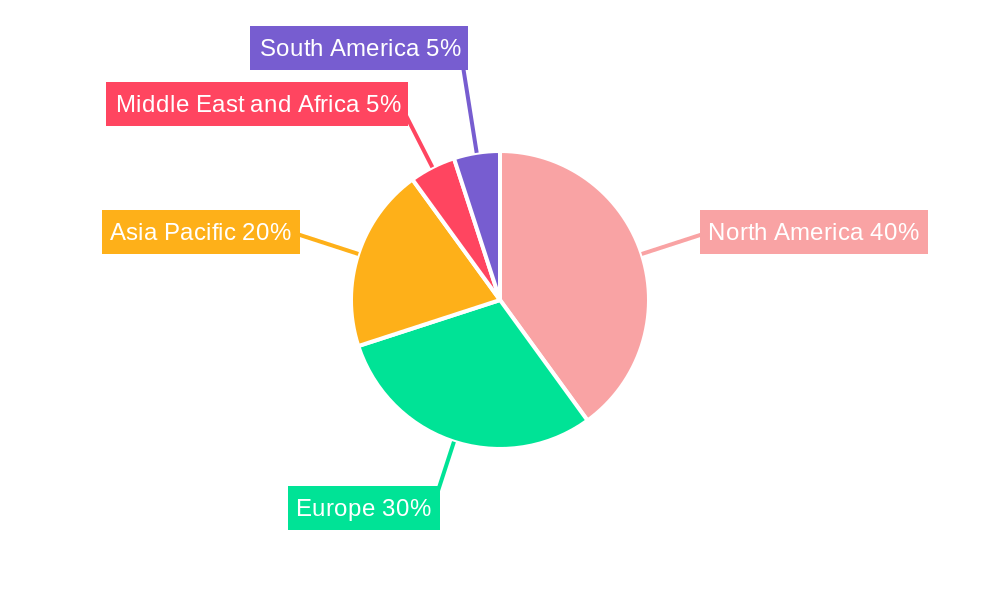
Nucleic Acid Amplification Industry Regional Market Share
Geographic Coverage of Nucleic Acid Amplification Industry
Nucleic Acid Amplification Industry REPORT HIGHLIGHTS
| Aspects | Details |
|---|---|
| Study Period | 2020-2034 |
| Base Year | 2025 |
| Estimated Year | 2026 |
| Forecast Period | 2026-2034 |
| Historical Period | 2020-2025 |
| Growth Rate | CAGR of 9.3% from 2020-2034 |
| Segmentation |
|
Table of Contents
- 1. Introduction
- 1.1. Research Scope
- 1.2. Market Segmentation
- 1.3. Research Objective
- 1.4. Definitions and Assumptions
- 2. Executive Summary
- 2.1. Market Snapshot
- 3. Market Dynamics
- 3.1. Market Drivers
- 3.2. Market Restrains
- 3.3. Market Trends
- 3.4. Market Opportunities
- 4. Market Factor Analysis
- 4.1. Porters Five Forces
- 4.1.1. Bargaining Power of Suppliers
- 4.1.2. Bargaining Power of Buyers
- 4.1.3. Threat of New Entrants
- 4.1.4. Threat of Substitutes
- 4.1.5. Competitive Rivalry
- 4.2. PESTEL analysis
- 4.3. BCG Analysis
- 4.3.1. Stars (High Growth, High Market Share)
- 4.3.2. Cash Cows (Low Growth, High Market Share)
- 4.3.3. Question Mark (High Growth, Low Market Share)
- 4.3.4. Dogs (Low Growth, Low Market Share)
- 4.4. Ansoff Matrix Analysis
- 4.5. Supply Chain Analysis
- 4.6. Regulatory Landscape
- 4.7. Current Market Potential and Opportunity Assessment (TAM–SAM–SOM Framework)
- 4.8. PRI Analyst Note
- 4.1. Porters Five Forces
- 5. Market Analysis, Insights and Forecast 2021-2033
- 5.1. Market Analysis, Insights and Forecast - by Technology
- 5.1.1. Helicase-dependent Amplification (HDA)
- 5.1.2. Nicking Enzyme Amplification Reaction (NEAR)
- 5.1.3. Loop-mediated Isothermal Amplification (LAMP)
- 5.1.4. Strand Displacement Amplification (SDA)
- 5.1.5. Nucleic Acid Sequence-based Amplification (NASBA)
- 5.1.6. Transcription Mediated Amplification (TMA)
- 5.1.7. Single Primer Isothermal Amplification (SPIA)
- 5.1.8. Other Technologies
- 5.2. Market Analysis, Insights and Forecast - by Product
- 5.2.1. Instruments
- 5.2.2. Reagents
- 5.3. Market Analysis, Insights and Forecast - by End-User
- 5.3.1. Hospitals
- 5.3.2. Research Laboratories
- 5.3.3. Other End-Users
- 5.4. Market Analysis, Insights and Forecast - by Region
- 5.4.1. North America
- 5.4.2. Europe
- 5.4.3. Asia Pacific
- 5.4.4. Middle East and Africa
- 5.4.5. South America
- 5.1. Market Analysis, Insights and Forecast - by Technology
- 6. Global Nucleic Acid Amplification Industry Analysis, Insights and Forecast, 2021-2033
- 6.1. Market Analysis, Insights and Forecast - by Technology
- 6.1.1. Helicase-dependent Amplification (HDA)
- 6.1.2. Nicking Enzyme Amplification Reaction (NEAR)
- 6.1.3. Loop-mediated Isothermal Amplification (LAMP)
- 6.1.4. Strand Displacement Amplification (SDA)
- 6.1.5. Nucleic Acid Sequence-based Amplification (NASBA)
- 6.1.6. Transcription Mediated Amplification (TMA)
- 6.1.7. Single Primer Isothermal Amplification (SPIA)
- 6.1.8. Other Technologies
- 6.2. Market Analysis, Insights and Forecast - by Product
- 6.2.1. Instruments
- 6.2.2. Reagents
- 6.3. Market Analysis, Insights and Forecast - by End-User
- 6.3.1. Hospitals
- 6.3.2. Research Laboratories
- 6.3.3. Other End-Users
- 6.1. Market Analysis, Insights and Forecast - by Technology
- 7. North America Nucleic Acid Amplification Industry Analysis, Insights and Forecast, 2020-2032
- 7.1. Market Analysis, Insights and Forecast - by Technology
- 7.1.1. Helicase-dependent Amplification (HDA)
- 7.1.2. Nicking Enzyme Amplification Reaction (NEAR)
- 7.1.3. Loop-mediated Isothermal Amplification (LAMP)
- 7.1.4. Strand Displacement Amplification (SDA)
- 7.1.5. Nucleic Acid Sequence-based Amplification (NASBA)
- 7.1.6. Transcription Mediated Amplification (TMA)
- 7.1.7. Single Primer Isothermal Amplification (SPIA)
- 7.1.8. Other Technologies
- 7.2. Market Analysis, Insights and Forecast - by Product
- 7.2.1. Instruments
- 7.2.2. Reagents
- 7.3. Market Analysis, Insights and Forecast - by End-User
- 7.3.1. Hospitals
- 7.3.2. Research Laboratories
- 7.3.3. Other End-Users
- 7.1. Market Analysis, Insights and Forecast - by Technology
- 8. Europe Nucleic Acid Amplification Industry Analysis, Insights and Forecast, 2020-2032
- 8.1. Market Analysis, Insights and Forecast - by Technology
- 8.1.1. Helicase-dependent Amplification (HDA)
- 8.1.2. Nicking Enzyme Amplification Reaction (NEAR)
- 8.1.3. Loop-mediated Isothermal Amplification (LAMP)
- 8.1.4. Strand Displacement Amplification (SDA)
- 8.1.5. Nucleic Acid Sequence-based Amplification (NASBA)
- 8.1.6. Transcription Mediated Amplification (TMA)
- 8.1.7. Single Primer Isothermal Amplification (SPIA)
- 8.1.8. Other Technologies
- 8.2. Market Analysis, Insights and Forecast - by Product
- 8.2.1. Instruments
- 8.2.2. Reagents
- 8.3. Market Analysis, Insights and Forecast - by End-User
- 8.3.1. Hospitals
- 8.3.2. Research Laboratories
- 8.3.3. Other End-Users
- 8.1. Market Analysis, Insights and Forecast - by Technology
- 9. Asia Pacific Nucleic Acid Amplification Industry Analysis, Insights and Forecast, 2020-2032
- 9.1. Market Analysis, Insights and Forecast - by Technology
- 9.1.1. Helicase-dependent Amplification (HDA)
- 9.1.2. Nicking Enzyme Amplification Reaction (NEAR)
- 9.1.3. Loop-mediated Isothermal Amplification (LAMP)
- 9.1.4. Strand Displacement Amplification (SDA)
- 9.1.5. Nucleic Acid Sequence-based Amplification (NASBA)
- 9.1.6. Transcription Mediated Amplification (TMA)
- 9.1.7. Single Primer Isothermal Amplification (SPIA)
- 9.1.8. Other Technologies
- 9.2. Market Analysis, Insights and Forecast - by Product
- 9.2.1. Instruments
- 9.2.2. Reagents
- 9.3. Market Analysis, Insights and Forecast - by End-User
- 9.3.1. Hospitals
- 9.3.2. Research Laboratories
- 9.3.3. Other End-Users
- 9.1. Market Analysis, Insights and Forecast - by Technology
- 10. Middle East and Africa Nucleic Acid Amplification Industry Analysis, Insights and Forecast, 2020-2032
- 10.1. Market Analysis, Insights and Forecast - by Technology
- 10.1.1. Helicase-dependent Amplification (HDA)
- 10.1.2. Nicking Enzyme Amplification Reaction (NEAR)
- 10.1.3. Loop-mediated Isothermal Amplification (LAMP)
- 10.1.4. Strand Displacement Amplification (SDA)
- 10.1.5. Nucleic Acid Sequence-based Amplification (NASBA)
- 10.1.6. Transcription Mediated Amplification (TMA)
- 10.1.7. Single Primer Isothermal Amplification (SPIA)
- 10.1.8. Other Technologies
- 10.2. Market Analysis, Insights and Forecast - by Product
- 10.2.1. Instruments
- 10.2.2. Reagents
- 10.3. Market Analysis, Insights and Forecast - by End-User
- 10.3.1. Hospitals
- 10.3.2. Research Laboratories
- 10.3.3. Other End-Users
- 10.1. Market Analysis, Insights and Forecast - by Technology
- 11. South America Nucleic Acid Amplification Industry Analysis, Insights and Forecast, 2020-2032
- 11.1. Market Analysis, Insights and Forecast - by Technology
- 11.1.1. Helicase-dependent Amplification (HDA)
- 11.1.2. Nicking Enzyme Amplification Reaction (NEAR)
- 11.1.3. Loop-mediated Isothermal Amplification (LAMP)
- 11.1.4. Strand Displacement Amplification (SDA)
- 11.1.5. Nucleic Acid Sequence-based Amplification (NASBA)
- 11.1.6. Transcription Mediated Amplification (TMA)
- 11.1.7. Single Primer Isothermal Amplification (SPIA)
- 11.1.8. Other Technologies
- 11.2. Market Analysis, Insights and Forecast - by Product
- 11.2.1. Instruments
- 11.2.2. Reagents
- 11.3. Market Analysis, Insights and Forecast - by End-User
- 11.3.1. Hospitals
- 11.3.2. Research Laboratories
- 11.3.3. Other End-Users
- 11.1. Market Analysis, Insights and Forecast - by Technology
- 12. Competitive Analysis
- 12.1. Company Profiles
- 12.1.1 Quidel Corporation*List Not Exhaustive
- 12.1.1.1. Company Overview
- 12.1.1.2. Products
- 12.1.1.3. Company Financials
- 12.1.1.4. SWOT Analysis
- 12.1.2 BioMerieux SA
- 12.1.2.1. Company Overview
- 12.1.2.2. Products
- 12.1.2.3. Company Financials
- 12.1.2.4. SWOT Analysis
- 12.1.3 OptiGene Limited
- 12.1.3.1. Company Overview
- 12.1.3.2. Products
- 12.1.3.3. Company Financials
- 12.1.3.4. SWOT Analysis
- 12.1.4 Meridian Bioscience
- 12.1.4.1. Company Overview
- 12.1.4.2. Products
- 12.1.4.3. Company Financials
- 12.1.4.4. SWOT Analysis
- 12.1.5 Becton Dickinson & Company
- 12.1.5.1. Company Overview
- 12.1.5.2. Products
- 12.1.5.3. Company Financials
- 12.1.5.4. SWOT Analysis
- 12.1.6 Tecan Genomics Inc
- 12.1.6.1. Company Overview
- 12.1.6.2. Products
- 12.1.6.3. Company Financials
- 12.1.6.4. SWOT Analysis
- 12.1.7 Lucigen
- 12.1.7.1. Company Overview
- 12.1.7.2. Products
- 12.1.7.3. Company Financials
- 12.1.7.4. SWOT Analysis
- 12.1.8 Qiagen NV
- 12.1.8.1. Company Overview
- 12.1.8.2. Products
- 12.1.8.3. Company Financials
- 12.1.8.4. SWOT Analysis
- 12.1.9 Eiken Chemical Co Ltd
- 12.1.9.1. Company Overview
- 12.1.9.2. Products
- 12.1.9.3. Company Financials
- 12.1.9.4. SWOT Analysis
- 12.1.1 Quidel Corporation*List Not Exhaustive
- 12.2. Market Entropy
- 12.2.1 Company's Key Areas Served
- 12.2.2 Recent Developments
- 12.3. Company Market Share Analysis 2025
- 12.3.1 Top 5 Companies Market Share Analysis
- 12.3.2 Top 3 Companies Market Share Analysis
- 12.4. List of Potential Customers
- 13. Research Methodology
List of Figures
- Figure 1: Global Nucleic Acid Amplification Industry Revenue Breakdown (billion, %) by Region 2025 & 2033
- Figure 2: North America Nucleic Acid Amplification Industry Revenue (billion), by Technology 2025 & 2033
- Figure 3: North America Nucleic Acid Amplification Industry Revenue Share (%), by Technology 2025 & 2033
- Figure 4: North America Nucleic Acid Amplification Industry Revenue (billion), by Product 2025 & 2033
- Figure 5: North America Nucleic Acid Amplification Industry Revenue Share (%), by Product 2025 & 2033
- Figure 6: North America Nucleic Acid Amplification Industry Revenue (billion), by End-User 2025 & 2033
- Figure 7: North America Nucleic Acid Amplification Industry Revenue Share (%), by End-User 2025 & 2033
- Figure 8: North America Nucleic Acid Amplification Industry Revenue (billion), by Country 2025 & 2033
- Figure 9: North America Nucleic Acid Amplification Industry Revenue Share (%), by Country 2025 & 2033
- Figure 10: Europe Nucleic Acid Amplification Industry Revenue (billion), by Technology 2025 & 2033
- Figure 11: Europe Nucleic Acid Amplification Industry Revenue Share (%), by Technology 2025 & 2033
- Figure 12: Europe Nucleic Acid Amplification Industry Revenue (billion), by Product 2025 & 2033
- Figure 13: Europe Nucleic Acid Amplification Industry Revenue Share (%), by Product 2025 & 2033
- Figure 14: Europe Nucleic Acid Amplification Industry Revenue (billion), by End-User 2025 & 2033
- Figure 15: Europe Nucleic Acid Amplification Industry Revenue Share (%), by End-User 2025 & 2033
- Figure 16: Europe Nucleic Acid Amplification Industry Revenue (billion), by Country 2025 & 2033
- Figure 17: Europe Nucleic Acid Amplification Industry Revenue Share (%), by Country 2025 & 2033
- Figure 18: Asia Pacific Nucleic Acid Amplification Industry Revenue (billion), by Technology 2025 & 2033
- Figure 19: Asia Pacific Nucleic Acid Amplification Industry Revenue Share (%), by Technology 2025 & 2033
- Figure 20: Asia Pacific Nucleic Acid Amplification Industry Revenue (billion), by Product 2025 & 2033
- Figure 21: Asia Pacific Nucleic Acid Amplification Industry Revenue Share (%), by Product 2025 & 2033
- Figure 22: Asia Pacific Nucleic Acid Amplification Industry Revenue (billion), by End-User 2025 & 2033
- Figure 23: Asia Pacific Nucleic Acid Amplification Industry Revenue Share (%), by End-User 2025 & 2033
- Figure 24: Asia Pacific Nucleic Acid Amplification Industry Revenue (billion), by Country 2025 & 2033
- Figure 25: Asia Pacific Nucleic Acid Amplification Industry Revenue Share (%), by Country 2025 & 2033
- Figure 26: Middle East and Africa Nucleic Acid Amplification Industry Revenue (billion), by Technology 2025 & 2033
- Figure 27: Middle East and Africa Nucleic Acid Amplification Industry Revenue Share (%), by Technology 2025 & 2033
- Figure 28: Middle East and Africa Nucleic Acid Amplification Industry Revenue (billion), by Product 2025 & 2033
- Figure 29: Middle East and Africa Nucleic Acid Amplification Industry Revenue Share (%), by Product 2025 & 2033
- Figure 30: Middle East and Africa Nucleic Acid Amplification Industry Revenue (billion), by End-User 2025 & 2033
- Figure 31: Middle East and Africa Nucleic Acid Amplification Industry Revenue Share (%), by End-User 2025 & 2033
- Figure 32: Middle East and Africa Nucleic Acid Amplification Industry Revenue (billion), by Country 2025 & 2033
- Figure 33: Middle East and Africa Nucleic Acid Amplification Industry Revenue Share (%), by Country 2025 & 2033
- Figure 34: South America Nucleic Acid Amplification Industry Revenue (billion), by Technology 2025 & 2033
- Figure 35: South America Nucleic Acid Amplification Industry Revenue Share (%), by Technology 2025 & 2033
- Figure 36: South America Nucleic Acid Amplification Industry Revenue (billion), by Product 2025 & 2033
- Figure 37: South America Nucleic Acid Amplification Industry Revenue Share (%), by Product 2025 & 2033
- Figure 38: South America Nucleic Acid Amplification Industry Revenue (billion), by End-User 2025 & 2033
- Figure 39: South America Nucleic Acid Amplification Industry Revenue Share (%), by End-User 2025 & 2033
- Figure 40: South America Nucleic Acid Amplification Industry Revenue (billion), by Country 2025 & 2033
- Figure 41: South America Nucleic Acid Amplification Industry Revenue Share (%), by Country 2025 & 2033
List of Tables
- Table 1: Global Nucleic Acid Amplification Industry Revenue billion Forecast, by Technology 2020 & 2033
- Table 2: Global Nucleic Acid Amplification Industry Revenue billion Forecast, by Product 2020 & 2033
- Table 3: Global Nucleic Acid Amplification Industry Revenue billion Forecast, by End-User 2020 & 2033
- Table 4: Global Nucleic Acid Amplification Industry Revenue billion Forecast, by Region 2020 & 2033
- Table 5: Global Nucleic Acid Amplification Industry Revenue billion Forecast, by Technology 2020 & 2033
- Table 6: Global Nucleic Acid Amplification Industry Revenue billion Forecast, by Product 2020 & 2033
- Table 7: Global Nucleic Acid Amplification Industry Revenue billion Forecast, by End-User 2020 & 2033
- Table 8: Global Nucleic Acid Amplification Industry Revenue billion Forecast, by Country 2020 & 2033
- Table 9: United States Nucleic Acid Amplification Industry Revenue (billion) Forecast, by Application 2020 & 2033
- Table 10: Canada Nucleic Acid Amplification Industry Revenue (billion) Forecast, by Application 2020 & 2033
- Table 11: Mexico Nucleic Acid Amplification Industry Revenue (billion) Forecast, by Application 2020 & 2033
- Table 12: Global Nucleic Acid Amplification Industry Revenue billion Forecast, by Technology 2020 & 2033
- Table 13: Global Nucleic Acid Amplification Industry Revenue billion Forecast, by Product 2020 & 2033
- Table 14: Global Nucleic Acid Amplification Industry Revenue billion Forecast, by End-User 2020 & 2033
- Table 15: Global Nucleic Acid Amplification Industry Revenue billion Forecast, by Country 2020 & 2033
- Table 16: Germany Nucleic Acid Amplification Industry Revenue (billion) Forecast, by Application 2020 & 2033
- Table 17: United Kingdom Nucleic Acid Amplification Industry Revenue (billion) Forecast, by Application 2020 & 2033
- Table 18: France Nucleic Acid Amplification Industry Revenue (billion) Forecast, by Application 2020 & 2033
- Table 19: Italy Nucleic Acid Amplification Industry Revenue (billion) Forecast, by Application 2020 & 2033
- Table 20: Spain Nucleic Acid Amplification Industry Revenue (billion) Forecast, by Application 2020 & 2033
- Table 21: Rest of Europe Nucleic Acid Amplification Industry Revenue (billion) Forecast, by Application 2020 & 2033
- Table 22: Global Nucleic Acid Amplification Industry Revenue billion Forecast, by Technology 2020 & 2033
- Table 23: Global Nucleic Acid Amplification Industry Revenue billion Forecast, by Product 2020 & 2033
- Table 24: Global Nucleic Acid Amplification Industry Revenue billion Forecast, by End-User 2020 & 2033
- Table 25: Global Nucleic Acid Amplification Industry Revenue billion Forecast, by Country 2020 & 2033
- Table 26: China Nucleic Acid Amplification Industry Revenue (billion) Forecast, by Application 2020 & 2033
- Table 27: Japan Nucleic Acid Amplification Industry Revenue (billion) Forecast, by Application 2020 & 2033
- Table 28: India Nucleic Acid Amplification Industry Revenue (billion) Forecast, by Application 2020 & 2033
- Table 29: Australia Nucleic Acid Amplification Industry Revenue (billion) Forecast, by Application 2020 & 2033
- Table 30: South Korea Nucleic Acid Amplification Industry Revenue (billion) Forecast, by Application 2020 & 2033
- Table 31: Rest of Asia Pacific Nucleic Acid Amplification Industry Revenue (billion) Forecast, by Application 2020 & 2033
- Table 32: Global Nucleic Acid Amplification Industry Revenue billion Forecast, by Technology 2020 & 2033
- Table 33: Global Nucleic Acid Amplification Industry Revenue billion Forecast, by Product 2020 & 2033
- Table 34: Global Nucleic Acid Amplification Industry Revenue billion Forecast, by End-User 2020 & 2033
- Table 35: Global Nucleic Acid Amplification Industry Revenue billion Forecast, by Country 2020 & 2033
- Table 36: GCC Nucleic Acid Amplification Industry Revenue (billion) Forecast, by Application 2020 & 2033
- Table 37: South Africa Nucleic Acid Amplification Industry Revenue (billion) Forecast, by Application 2020 & 2033
- Table 38: Rest of Middle East and Africa Nucleic Acid Amplification Industry Revenue (billion) Forecast, by Application 2020 & 2033
- Table 39: Global Nucleic Acid Amplification Industry Revenue billion Forecast, by Technology 2020 & 2033
- Table 40: Global Nucleic Acid Amplification Industry Revenue billion Forecast, by Product 2020 & 2033
- Table 41: Global Nucleic Acid Amplification Industry Revenue billion Forecast, by End-User 2020 & 2033
- Table 42: Global Nucleic Acid Amplification Industry Revenue billion Forecast, by Country 2020 & 2033
- Table 43: Brazil Nucleic Acid Amplification Industry Revenue (billion) Forecast, by Application 2020 & 2033
- Table 44: Argentina Nucleic Acid Amplification Industry Revenue (billion) Forecast, by Application 2020 & 2033
- Table 45: Rest of South America Nucleic Acid Amplification Industry Revenue (billion) Forecast, by Application 2020 & 2033
Frequently Asked Questions
1. What is the projected Compound Annual Growth Rate (CAGR) of the Nucleic Acid Amplification Industry?
The projected CAGR is approximately 9.3%.
2. Which companies are prominent players in the Nucleic Acid Amplification Industry?
Key companies in the market include Quidel Corporation*List Not Exhaustive, BioMerieux SA, OptiGene Limited, Meridian Bioscience, Becton Dickinson & Company, Tecan Genomics Inc, Lucigen, Qiagen NV, Eiken Chemical Co Ltd.
3. What are the main segments of the Nucleic Acid Amplification Industry?
The market segments include Technology, Product, End-User.
4. Can you provide details about the market size?
The market size is estimated to be USD 10.31 billion as of 2022.
5. What are some drivers contributing to market growth?
Increasing Incidences of Chronic Diseases And Aging Population; Increase in the Adoption of INAAT Over PCR; Rise In The Miniaturization of Nucleic Acid-based Diagnostics; Rise In Demand for Low-cost And Effective Diagnostics Procedures.
6. What are the notable trends driving market growth?
Loop-mediated Isothermal Amplification (LAMP) Segment is Expected to Hold a Major Market Share in the Isothermal Nucleic Acid Amplification Technology (INAAT) Market.
7. Are there any restraints impacting market growth?
Threatening Opposition from PCR Technologies; Lack of Awareness about New Diagnostics Technologies.
8. Can you provide examples of recent developments in the market?
In August 2022, LGC Clinical Diagnostics announced the extension of their exclusive collaboration with Stanford Medicine's Department of Obstetrics and Gynecology and Metabolic Health Center supporting global genetic and metabolic diagnostic testing.
9. What pricing options are available for accessing the report?
Pricing options include single-user, multi-user, and enterprise licenses priced at USD 4750, USD 5250, and USD 8750 respectively.
10. Is the market size provided in terms of value or volume?
The market size is provided in terms of value, measured in billion.
11. Are there any specific market keywords associated with the report?
Yes, the market keyword associated with the report is "Nucleic Acid Amplification Industry," which aids in identifying and referencing the specific market segment covered.
12. How do I determine which pricing option suits my needs best?
The pricing options vary based on user requirements and access needs. Individual users may opt for single-user licenses, while businesses requiring broader access may choose multi-user or enterprise licenses for cost-effective access to the report.
13. Are there any additional resources or data provided in the Nucleic Acid Amplification Industry report?
While the report offers comprehensive insights, it's advisable to review the specific contents or supplementary materials provided to ascertain if additional resources or data are available.
14. How can I stay updated on further developments or reports in the Nucleic Acid Amplification Industry?
To stay informed about further developments, trends, and reports in the Nucleic Acid Amplification Industry, consider subscribing to industry newsletters, following relevant companies and organizations, or regularly checking reputable industry news sources and publications.
Methodology
Step 1 - Identification of Relevant Samples Size from Population Database


Step 2 - Approaches for Defining Global Market Size (Value, Volume* & Price*)

Note*: In applicable scenarios
Step 3 - Data Sources
Primary Research
- Web Analytics
- Survey Reports
- Research Institute
- Latest Research Reports
- Opinion Leaders
Secondary Research
- Annual Reports
- White Paper
- Latest Press Release
- Industry Association
- Paid Database
- Investor Presentations

Step 4 - Data Triangulation
Involves using different sources of information in order to increase the validity of a study
These sources are likely to be stakeholders in a program - participants, other researchers, program staff, other community members, and so on.
Then we put all data in single framework & apply various statistical tools to find out the dynamic on the market.
During the analysis stage, feedback from the stakeholder groups would be compared to determine areas of agreement as well as areas of divergence