


Key Insights
The Qatari oil and gas industry, a pivotal economic engine, is projected for substantial growth, fueled by robust global energy demand and strategic infrastructure investments. The market is estimated to reach $38 billion by 2023, with a Compound Annual Growth Rate (CAGR) of 4.2%. Key growth drivers include the expansion of liquefied natural gas (LNG) production and export capabilities, capitalizing on Qatar's extensive reserves. Growing emphasis on energy security and diversification worldwide further solidifies the long-term prospects for Qatari energy producers. Investments span upstream exploration and production, alongside midstream and downstream refining and petrochemical operations, serving both domestic and international markets. While the global transition to renewables presents a long-term challenge, natural gas's role as a transitional fuel ensures continued demand. The market is segmented by value chain (Upstream, Midstream, Downstream) and application (Industrial, Commercial, Residential), presenting opportunities for major players and emerging companies. Key trading partners in the Middle East and Africa, including the UAE and Saudi Arabia, significantly influence market dynamics.
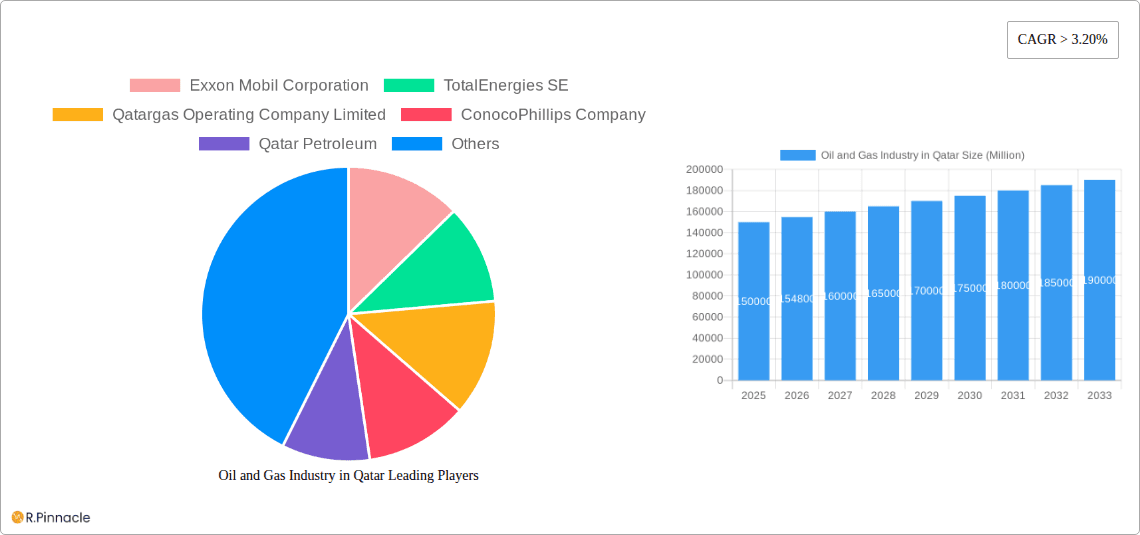
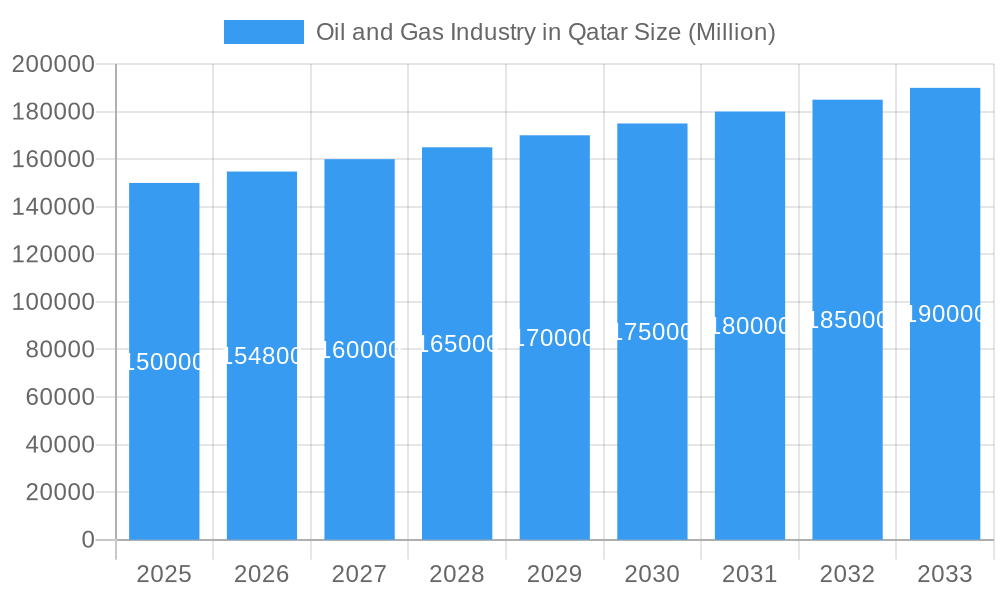
Oil and Gas Industry in Qatar Market Size (In Billion)

The forecast period (2023-2033) anticipates sustained expansion, primarily driven by escalating global LNG consumption. Qatar's commitment to infrastructure modernization and technological innovation within the oil and gas sector underpins the industry's resilience and operational efficiency. Navigating challenges such as volatile energy prices, geopolitical risks, and increased competition from other LNG exporters will be critical. Strategic partnerships and technological advancements are essential for maintaining Qatar's prominent global position. Diversification into downstream activities and value-added products will be paramount for long-term sustainable growth.
Oil and Gas Industry in Qatar Company Market Share
Oil and Gas Industry in Qatar: A Comprehensive Market Report (2019-2033)
This in-depth report provides a comprehensive analysis of the Oil and Gas Industry in Qatar, offering crucial insights for industry professionals, investors, and strategic planners. Covering the period from 2019 to 2033, with a focus on 2025, this report meticulously examines market structure, dynamics, dominant segments, and future growth potential. Leveraging extensive data and expert analysis, it unveils key trends and opportunities within Qatar's thriving energy sector.
Oil and Gas Industry in Qatar Market Structure & Innovation Trends
This section analyzes the competitive landscape of Qatar's oil and gas industry, encompassing market concentration, innovation drivers, regulatory frameworks, and mergers & acquisitions (M&A) activities. The report assesses the market share held by key players such as Exxon Mobil Corporation, TotalEnergies SE, Qatargas Operating Company Limited, ConocoPhillips Company, and Qatar Petroleum. The analysis incorporates data on M&A deal values exceeding $XX Million during the study period (2019-2024).
- Market Concentration: The report details the market share distribution among major players, revealing the level of competition and potential for market consolidation. The Herfindahl-Hirschman Index (HHI) is used to quantify market concentration.
- Innovation Drivers: Analysis focuses on factors such as government incentives, technological advancements (e.g., enhanced oil recovery techniques), and the demand for cleaner energy solutions.
- Regulatory Frameworks: The report examines the impact of Qatar's regulatory environment on industry operations, including licensing procedures, environmental regulations, and fiscal policies.
- Product Substitutes: The report explores the impact of renewable energy sources and alternative fuels on the demand for oil and gas in Qatar.
- End-User Demographics: The report analyzes the distribution of oil and gas consumption across industrial, commercial, and residential sectors.
- M&A Activities: Details on significant M&A deals, including deal values and strategic implications, are provided.
Oil and Gas Industry in Qatar Market Dynamics & Trends
This section delves into the market dynamics influencing the growth of Qatar's oil and gas industry. It examines key growth drivers, technological disruptions, and competitive dynamics, providing insights into market trends and their impact on the industry's trajectory. The report projects a Compound Annual Growth Rate (CAGR) of XX% for the forecast period (2025-2033). Market penetration rates for different oil and gas products are also analyzed.
- Market size projections for 2025 and 2033 are provided for the Upstream, Midstream, and Downstream segments.
Dominant Regions & Segments in Oil and Gas Industry in Qatar
This section identifies the leading regions, segments (Upstream, Midstream, Downstream), and applications (Industrial, Commercial, Residential) within Qatar's oil and gas industry. The analysis highlights key drivers responsible for the dominance of specific segments, including economic policies, infrastructure development, and government initiatives.
- Upstream: Analysis will focus on specific regions or fields contributing the most to oil and gas production in Qatar. Key drivers: Investment in exploration and production technologies, government support for domestic production, and favorable geological conditions.
- Midstream: Focus will be placed on the key pipelines, storage facilities, and processing plants contributing the most to the midstream segment. Key drivers: Strategic location of Qatar's infrastructure, investments in pipeline expansion and modernization, and government regulations promoting efficient midstream operations.
- Downstream: The report highlights dominant regions based on refining capacity and petrochemical production. Key drivers: Government investments in refining and petrochemical capacity, access to feedstock, and strategic partnerships with international players.
- Industrial Application: Analysis of the industrial sector's contribution to oil and gas demand, examining key industries driving consumption. Key drivers: Growth of petrochemical and fertilizer industries, rising industrial output, and expanding manufacturing sector.
- Commercial Application: Analysis of commercial oil and gas demand, highlighting its significance and trends. Key drivers: Growth of commercial sectors, increasing demand for electricity generation, and the usage of natural gas in commercial heating.
- Residential Application: Assessment of residential demand for oil and gas, focusing on key drivers and future projections. Key drivers: Population growth, increasing disposable incomes, and rising demand for heating and cooking fuels.
Oil and Gas Industry in Qatar Product Innovations
This section summarizes recent product developments, focusing on technological advancements and their impact on the market. The report highlights innovative products, their applications, and their competitive advantages.
Report Scope & Segmentation Analysis
This section details the market segmentation, encompassing Upstream, Midstream, and Downstream segments. Each segment's growth projection, market size, and competitive dynamics are analyzed in detail, providing a comprehensive understanding of the market's structure and dynamics. Market sizes (in Millions) are provided for each segment for 2025 and projected for 2033.
Key Drivers of Oil and Gas Industry in Qatar Growth
This section outlines the key factors driving the growth of Qatar's oil and gas industry, including technological advancements, economic factors, and government policies. Specific examples are used to illustrate these drivers' impact.
Challenges in the Oil and Gas Industry in Qatar Sector
This section discusses significant challenges facing the industry, including regulatory hurdles, supply chain disruptions, and competitive pressures. The impact of these challenges is quantified wherever possible, offering a clear picture of the obstacles faced by industry players.
Emerging Opportunities in Oil and Gas Industry in Qatar
This section highlights emerging opportunities within the industry, including new market segments, technological advancements, and shifting consumer preferences. These opportunities provide a glimpse into the future potential of the Qatari oil and gas sector.
Leading Players in the Oil and Gas Industry in Qatar Market
- Exxon Mobil Corporation
- TotalEnergies SE
- Qatargas Operating Company Limited
- ConocoPhillips Company
- Qatar Petroleum
Key Developments in Oil and Gas Industry in Qatar Industry
- [List of key developments with year/month and impact on market dynamics]
Future Outlook for Oil and Gas Industry in Qatar Market
This section summarizes the future growth potential of Qatar's oil and gas industry, highlighting key factors that will shape its trajectory in the coming years. The outlook considers both opportunities and challenges, providing a balanced perspective on the industry's future.
Oil and Gas Industry in Qatar Segmentation
- 1. Upstream
- 2. Midstream
- 3. Downstream
Oil and Gas Industry in Qatar Segmentation By Geography
-
1. North America
- 1.1. United States
- 1.2. Canada
- 1.3. Mexico
-
2. South America
- 2.1. Brazil
- 2.2. Argentina
- 2.3. Rest of South America
-
3. Europe
- 3.1. United Kingdom
- 3.2. Germany
- 3.3. France
- 3.4. Italy
- 3.5. Spain
- 3.6. Russia
- 3.7. Benelux
- 3.8. Nordics
- 3.9. Rest of Europe
-
4. Middle East & Africa
- 4.1. Turkey
- 4.2. Israel
- 4.3. GCC
- 4.4. North Africa
- 4.5. South Africa
- 4.6. Rest of Middle East & Africa
-
5. Asia Pacific
- 5.1. China
- 5.2. India
- 5.3. Japan
- 5.4. South Korea
- 5.5. ASEAN
- 5.6. Oceania
- 5.7. Rest of Asia Pacific
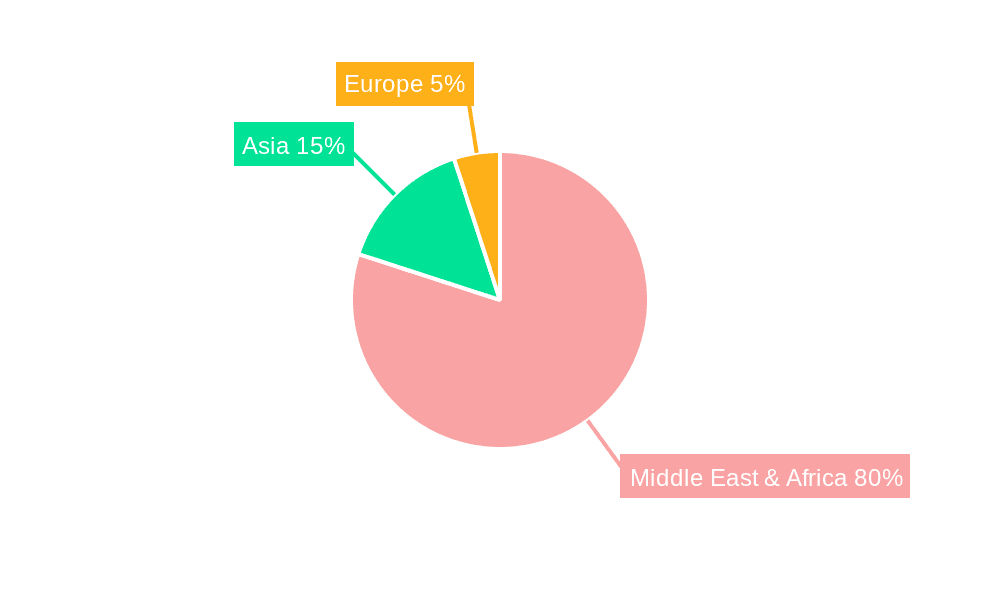
Oil and Gas Industry in Qatar Regional Market Share
Geographic Coverage of Oil and Gas Industry in Qatar
Oil and Gas Industry in Qatar REPORT HIGHLIGHTS
| Aspects | Details |
|---|---|
| Study Period | 2020-2034 |
| Base Year | 2025 |
| Estimated Year | 2026 |
| Forecast Period | 2026-2034 |
| Historical Period | 2020-2025 |
| Growth Rate | CAGR of 4.2% from 2020-2034 |
| Segmentation |
|
Table of Contents
- 1. Introduction
- 1.1. Research Scope
- 1.2. Market Segmentation
- 1.3. Research Methodology
- 1.4. Definitions and Assumptions
- 2. Executive Summary
- 2.1. Introduction
- 3. Market Dynamics
- 3.1. Introduction
- 3.2. Market Drivers
- 3.2.1. Drivers; Restraints
- 3.3. Market Restrains
- 3.3.1. 4.; Political Instability and Militant Attacks on Pipeline Infrastructure
- 3.4. Market Trends
- 3.4.1. Upstream Segment to Dominate the Market
- 4. Market Factor Analysis
- 4.1. Porters Five Forces
- 4.2. Supply/Value Chain
- 4.3. PESTEL analysis
- 4.4. Market Entropy
- 4.5. Patent/Trademark Analysis
- 5. Global Oil and Gas Industry in Qatar Analysis, Insights and Forecast, 2020-2032
- 5.1. Market Analysis, Insights and Forecast - by Upstream
- 5.2. Market Analysis, Insights and Forecast - by Midstream
- 5.3. Market Analysis, Insights and Forecast - by Downstream
- 5.4. Market Analysis, Insights and Forecast - by Region
- 5.4.1. North America
- 5.4.2. South America
- 5.4.3. Europe
- 5.4.4. Middle East & Africa
- 5.4.5. Asia Pacific
- 5.1. Market Analysis, Insights and Forecast - by Upstream
- 6. North America Oil and Gas Industry in Qatar Analysis, Insights and Forecast, 2020-2032
- 6.1. Market Analysis, Insights and Forecast - by Upstream
- 6.2. Market Analysis, Insights and Forecast - by Midstream
- 6.3. Market Analysis, Insights and Forecast - by Downstream
- 6.1. Market Analysis, Insights and Forecast - by Upstream
- 7. South America Oil and Gas Industry in Qatar Analysis, Insights and Forecast, 2020-2032
- 7.1. Market Analysis, Insights and Forecast - by Upstream
- 7.2. Market Analysis, Insights and Forecast - by Midstream
- 7.3. Market Analysis, Insights and Forecast - by Downstream
- 7.1. Market Analysis, Insights and Forecast - by Upstream
- 8. Europe Oil and Gas Industry in Qatar Analysis, Insights and Forecast, 2020-2032
- 8.1. Market Analysis, Insights and Forecast - by Upstream
- 8.2. Market Analysis, Insights and Forecast - by Midstream
- 8.3. Market Analysis, Insights and Forecast - by Downstream
- 8.1. Market Analysis, Insights and Forecast - by Upstream
- 9. Middle East & Africa Oil and Gas Industry in Qatar Analysis, Insights and Forecast, 2020-2032
- 9.1. Market Analysis, Insights and Forecast - by Upstream
- 9.2. Market Analysis, Insights and Forecast - by Midstream
- 9.3. Market Analysis, Insights and Forecast - by Downstream
- 9.1. Market Analysis, Insights and Forecast - by Upstream
- 10. Asia Pacific Oil and Gas Industry in Qatar Analysis, Insights and Forecast, 2020-2032
- 10.1. Market Analysis, Insights and Forecast - by Upstream
- 10.2. Market Analysis, Insights and Forecast - by Midstream
- 10.3. Market Analysis, Insights and Forecast - by Downstream
- 10.1. Market Analysis, Insights and Forecast - by Upstream
- 11. Competitive Analysis
- 11.1. Global Market Share Analysis 2025
- 11.2. Company Profiles
- 11.2.1 Exxon Mobil Corporation
- 11.2.1.1. Overview
- 11.2.1.2. Products
- 11.2.1.3. SWOT Analysis
- 11.2.1.4. Recent Developments
- 11.2.1.5. Financials (Based on Availability)
- 11.2.2 TotalEnergies SE
- 11.2.2.1. Overview
- 11.2.2.2. Products
- 11.2.2.3. SWOT Analysis
- 11.2.2.4. Recent Developments
- 11.2.2.5. Financials (Based on Availability)
- 11.2.3 Qatargas Operating Company Limited
- 11.2.3.1. Overview
- 11.2.3.2. Products
- 11.2.3.3. SWOT Analysis
- 11.2.3.4. Recent Developments
- 11.2.3.5. Financials (Based on Availability)
- 11.2.4 ConocoPhillips Company
- 11.2.4.1. Overview
- 11.2.4.2. Products
- 11.2.4.3. SWOT Analysis
- 11.2.4.4. Recent Developments
- 11.2.4.5. Financials (Based on Availability)
- 11.2.5 Qatar Petroleum
- 11.2.5.1. Overview
- 11.2.5.2. Products
- 11.2.5.3. SWOT Analysis
- 11.2.5.4. Recent Developments
- 11.2.5.5. Financials (Based on Availability)
- 11.2.1 Exxon Mobil Corporation
List of Figures
- Figure 1: Global Oil and Gas Industry in Qatar Revenue Breakdown (billion, %) by Region 2025 & 2033
- Figure 2: Global Oil and Gas Industry in Qatar Volume Breakdown (Tonnes, %) by Region 2025 & 2033
- Figure 3: North America Oil and Gas Industry in Qatar Revenue (billion), by Upstream 2025 & 2033
- Figure 4: North America Oil and Gas Industry in Qatar Volume (Tonnes), by Upstream 2025 & 2033
- Figure 5: North America Oil and Gas Industry in Qatar Revenue Share (%), by Upstream 2025 & 2033
- Figure 6: North America Oil and Gas Industry in Qatar Volume Share (%), by Upstream 2025 & 2033
- Figure 7: North America Oil and Gas Industry in Qatar Revenue (billion), by Midstream 2025 & 2033
- Figure 8: North America Oil and Gas Industry in Qatar Volume (Tonnes), by Midstream 2025 & 2033
- Figure 9: North America Oil and Gas Industry in Qatar Revenue Share (%), by Midstream 2025 & 2033
- Figure 10: North America Oil and Gas Industry in Qatar Volume Share (%), by Midstream 2025 & 2033
- Figure 11: North America Oil and Gas Industry in Qatar Revenue (billion), by Downstream 2025 & 2033
- Figure 12: North America Oil and Gas Industry in Qatar Volume (Tonnes), by Downstream 2025 & 2033
- Figure 13: North America Oil and Gas Industry in Qatar Revenue Share (%), by Downstream 2025 & 2033
- Figure 14: North America Oil and Gas Industry in Qatar Volume Share (%), by Downstream 2025 & 2033
- Figure 15: North America Oil and Gas Industry in Qatar Revenue (billion), by Country 2025 & 2033
- Figure 16: North America Oil and Gas Industry in Qatar Volume (Tonnes), by Country 2025 & 2033
- Figure 17: North America Oil and Gas Industry in Qatar Revenue Share (%), by Country 2025 & 2033
- Figure 18: North America Oil and Gas Industry in Qatar Volume Share (%), by Country 2025 & 2033
- Figure 19: South America Oil and Gas Industry in Qatar Revenue (billion), by Upstream 2025 & 2033
- Figure 20: South America Oil and Gas Industry in Qatar Volume (Tonnes), by Upstream 2025 & 2033
- Figure 21: South America Oil and Gas Industry in Qatar Revenue Share (%), by Upstream 2025 & 2033
- Figure 22: South America Oil and Gas Industry in Qatar Volume Share (%), by Upstream 2025 & 2033
- Figure 23: South America Oil and Gas Industry in Qatar Revenue (billion), by Midstream 2025 & 2033
- Figure 24: South America Oil and Gas Industry in Qatar Volume (Tonnes), by Midstream 2025 & 2033
- Figure 25: South America Oil and Gas Industry in Qatar Revenue Share (%), by Midstream 2025 & 2033
- Figure 26: South America Oil and Gas Industry in Qatar Volume Share (%), by Midstream 2025 & 2033
- Figure 27: South America Oil and Gas Industry in Qatar Revenue (billion), by Downstream 2025 & 2033
- Figure 28: South America Oil and Gas Industry in Qatar Volume (Tonnes), by Downstream 2025 & 2033
- Figure 29: South America Oil and Gas Industry in Qatar Revenue Share (%), by Downstream 2025 & 2033
- Figure 30: South America Oil and Gas Industry in Qatar Volume Share (%), by Downstream 2025 & 2033
- Figure 31: South America Oil and Gas Industry in Qatar Revenue (billion), by Country 2025 & 2033
- Figure 32: South America Oil and Gas Industry in Qatar Volume (Tonnes), by Country 2025 & 2033
- Figure 33: South America Oil and Gas Industry in Qatar Revenue Share (%), by Country 2025 & 2033
- Figure 34: South America Oil and Gas Industry in Qatar Volume Share (%), by Country 2025 & 2033
- Figure 35: Europe Oil and Gas Industry in Qatar Revenue (billion), by Upstream 2025 & 2033
- Figure 36: Europe Oil and Gas Industry in Qatar Volume (Tonnes), by Upstream 2025 & 2033
- Figure 37: Europe Oil and Gas Industry in Qatar Revenue Share (%), by Upstream 2025 & 2033
- Figure 38: Europe Oil and Gas Industry in Qatar Volume Share (%), by Upstream 2025 & 2033
- Figure 39: Europe Oil and Gas Industry in Qatar Revenue (billion), by Midstream 2025 & 2033
- Figure 40: Europe Oil and Gas Industry in Qatar Volume (Tonnes), by Midstream 2025 & 2033
- Figure 41: Europe Oil and Gas Industry in Qatar Revenue Share (%), by Midstream 2025 & 2033
- Figure 42: Europe Oil and Gas Industry in Qatar Volume Share (%), by Midstream 2025 & 2033
- Figure 43: Europe Oil and Gas Industry in Qatar Revenue (billion), by Downstream 2025 & 2033
- Figure 44: Europe Oil and Gas Industry in Qatar Volume (Tonnes), by Downstream 2025 & 2033
- Figure 45: Europe Oil and Gas Industry in Qatar Revenue Share (%), by Downstream 2025 & 2033
- Figure 46: Europe Oil and Gas Industry in Qatar Volume Share (%), by Downstream 2025 & 2033
- Figure 47: Europe Oil and Gas Industry in Qatar Revenue (billion), by Country 2025 & 2033
- Figure 48: Europe Oil and Gas Industry in Qatar Volume (Tonnes), by Country 2025 & 2033
- Figure 49: Europe Oil and Gas Industry in Qatar Revenue Share (%), by Country 2025 & 2033
- Figure 50: Europe Oil and Gas Industry in Qatar Volume Share (%), by Country 2025 & 2033
- Figure 51: Middle East & Africa Oil and Gas Industry in Qatar Revenue (billion), by Upstream 2025 & 2033
- Figure 52: Middle East & Africa Oil and Gas Industry in Qatar Volume (Tonnes), by Upstream 2025 & 2033
- Figure 53: Middle East & Africa Oil and Gas Industry in Qatar Revenue Share (%), by Upstream 2025 & 2033
- Figure 54: Middle East & Africa Oil and Gas Industry in Qatar Volume Share (%), by Upstream 2025 & 2033
- Figure 55: Middle East & Africa Oil and Gas Industry in Qatar Revenue (billion), by Midstream 2025 & 2033
- Figure 56: Middle East & Africa Oil and Gas Industry in Qatar Volume (Tonnes), by Midstream 2025 & 2033
- Figure 57: Middle East & Africa Oil and Gas Industry in Qatar Revenue Share (%), by Midstream 2025 & 2033
- Figure 58: Middle East & Africa Oil and Gas Industry in Qatar Volume Share (%), by Midstream 2025 & 2033
- Figure 59: Middle East & Africa Oil and Gas Industry in Qatar Revenue (billion), by Downstream 2025 & 2033
- Figure 60: Middle East & Africa Oil and Gas Industry in Qatar Volume (Tonnes), by Downstream 2025 & 2033
- Figure 61: Middle East & Africa Oil and Gas Industry in Qatar Revenue Share (%), by Downstream 2025 & 2033
- Figure 62: Middle East & Africa Oil and Gas Industry in Qatar Volume Share (%), by Downstream 2025 & 2033
- Figure 63: Middle East & Africa Oil and Gas Industry in Qatar Revenue (billion), by Country 2025 & 2033
- Figure 64: Middle East & Africa Oil and Gas Industry in Qatar Volume (Tonnes), by Country 2025 & 2033
- Figure 65: Middle East & Africa Oil and Gas Industry in Qatar Revenue Share (%), by Country 2025 & 2033
- Figure 66: Middle East & Africa Oil and Gas Industry in Qatar Volume Share (%), by Country 2025 & 2033
- Figure 67: Asia Pacific Oil and Gas Industry in Qatar Revenue (billion), by Upstream 2025 & 2033
- Figure 68: Asia Pacific Oil and Gas Industry in Qatar Volume (Tonnes), by Upstream 2025 & 2033
- Figure 69: Asia Pacific Oil and Gas Industry in Qatar Revenue Share (%), by Upstream 2025 & 2033
- Figure 70: Asia Pacific Oil and Gas Industry in Qatar Volume Share (%), by Upstream 2025 & 2033
- Figure 71: Asia Pacific Oil and Gas Industry in Qatar Revenue (billion), by Midstream 2025 & 2033
- Figure 72: Asia Pacific Oil and Gas Industry in Qatar Volume (Tonnes), by Midstream 2025 & 2033
- Figure 73: Asia Pacific Oil and Gas Industry in Qatar Revenue Share (%), by Midstream 2025 & 2033
- Figure 74: Asia Pacific Oil and Gas Industry in Qatar Volume Share (%), by Midstream 2025 & 2033
- Figure 75: Asia Pacific Oil and Gas Industry in Qatar Revenue (billion), by Downstream 2025 & 2033
- Figure 76: Asia Pacific Oil and Gas Industry in Qatar Volume (Tonnes), by Downstream 2025 & 2033
- Figure 77: Asia Pacific Oil and Gas Industry in Qatar Revenue Share (%), by Downstream 2025 & 2033
- Figure 78: Asia Pacific Oil and Gas Industry in Qatar Volume Share (%), by Downstream 2025 & 2033
- Figure 79: Asia Pacific Oil and Gas Industry in Qatar Revenue (billion), by Country 2025 & 2033
- Figure 80: Asia Pacific Oil and Gas Industry in Qatar Volume (Tonnes), by Country 2025 & 2033
- Figure 81: Asia Pacific Oil and Gas Industry in Qatar Revenue Share (%), by Country 2025 & 2033
- Figure 82: Asia Pacific Oil and Gas Industry in Qatar Volume Share (%), by Country 2025 & 2033
List of Tables
- Table 1: Global Oil and Gas Industry in Qatar Revenue billion Forecast, by Upstream 2020 & 2033
- Table 2: Global Oil and Gas Industry in Qatar Volume Tonnes Forecast, by Upstream 2020 & 2033
- Table 3: Global Oil and Gas Industry in Qatar Revenue billion Forecast, by Midstream 2020 & 2033
- Table 4: Global Oil and Gas Industry in Qatar Volume Tonnes Forecast, by Midstream 2020 & 2033
- Table 5: Global Oil and Gas Industry in Qatar Revenue billion Forecast, by Downstream 2020 & 2033
- Table 6: Global Oil and Gas Industry in Qatar Volume Tonnes Forecast, by Downstream 2020 & 2033
- Table 7: Global Oil and Gas Industry in Qatar Revenue billion Forecast, by Region 2020 & 2033
- Table 8: Global Oil and Gas Industry in Qatar Volume Tonnes Forecast, by Region 2020 & 2033
- Table 9: Global Oil and Gas Industry in Qatar Revenue billion Forecast, by Upstream 2020 & 2033
- Table 10: Global Oil and Gas Industry in Qatar Volume Tonnes Forecast, by Upstream 2020 & 2033
- Table 11: Global Oil and Gas Industry in Qatar Revenue billion Forecast, by Midstream 2020 & 2033
- Table 12: Global Oil and Gas Industry in Qatar Volume Tonnes Forecast, by Midstream 2020 & 2033
- Table 13: Global Oil and Gas Industry in Qatar Revenue billion Forecast, by Downstream 2020 & 2033
- Table 14: Global Oil and Gas Industry in Qatar Volume Tonnes Forecast, by Downstream 2020 & 2033
- Table 15: Global Oil and Gas Industry in Qatar Revenue billion Forecast, by Country 2020 & 2033
- Table 16: Global Oil and Gas Industry in Qatar Volume Tonnes Forecast, by Country 2020 & 2033
- Table 17: United States Oil and Gas Industry in Qatar Revenue (billion) Forecast, by Application 2020 & 2033
- Table 18: United States Oil and Gas Industry in Qatar Volume (Tonnes) Forecast, by Application 2020 & 2033
- Table 19: Canada Oil and Gas Industry in Qatar Revenue (billion) Forecast, by Application 2020 & 2033
- Table 20: Canada Oil and Gas Industry in Qatar Volume (Tonnes) Forecast, by Application 2020 & 2033
- Table 21: Mexico Oil and Gas Industry in Qatar Revenue (billion) Forecast, by Application 2020 & 2033
- Table 22: Mexico Oil and Gas Industry in Qatar Volume (Tonnes) Forecast, by Application 2020 & 2033
- Table 23: Global Oil and Gas Industry in Qatar Revenue billion Forecast, by Upstream 2020 & 2033
- Table 24: Global Oil and Gas Industry in Qatar Volume Tonnes Forecast, by Upstream 2020 & 2033
- Table 25: Global Oil and Gas Industry in Qatar Revenue billion Forecast, by Midstream 2020 & 2033
- Table 26: Global Oil and Gas Industry in Qatar Volume Tonnes Forecast, by Midstream 2020 & 2033
- Table 27: Global Oil and Gas Industry in Qatar Revenue billion Forecast, by Downstream 2020 & 2033
- Table 28: Global Oil and Gas Industry in Qatar Volume Tonnes Forecast, by Downstream 2020 & 2033
- Table 29: Global Oil and Gas Industry in Qatar Revenue billion Forecast, by Country 2020 & 2033
- Table 30: Global Oil and Gas Industry in Qatar Volume Tonnes Forecast, by Country 2020 & 2033
- Table 31: Brazil Oil and Gas Industry in Qatar Revenue (billion) Forecast, by Application 2020 & 2033
- Table 32: Brazil Oil and Gas Industry in Qatar Volume (Tonnes) Forecast, by Application 2020 & 2033
- Table 33: Argentina Oil and Gas Industry in Qatar Revenue (billion) Forecast, by Application 2020 & 2033
- Table 34: Argentina Oil and Gas Industry in Qatar Volume (Tonnes) Forecast, by Application 2020 & 2033
- Table 35: Rest of South America Oil and Gas Industry in Qatar Revenue (billion) Forecast, by Application 2020 & 2033
- Table 36: Rest of South America Oil and Gas Industry in Qatar Volume (Tonnes) Forecast, by Application 2020 & 2033
- Table 37: Global Oil and Gas Industry in Qatar Revenue billion Forecast, by Upstream 2020 & 2033
- Table 38: Global Oil and Gas Industry in Qatar Volume Tonnes Forecast, by Upstream 2020 & 2033
- Table 39: Global Oil and Gas Industry in Qatar Revenue billion Forecast, by Midstream 2020 & 2033
- Table 40: Global Oil and Gas Industry in Qatar Volume Tonnes Forecast, by Midstream 2020 & 2033
- Table 41: Global Oil and Gas Industry in Qatar Revenue billion Forecast, by Downstream 2020 & 2033
- Table 42: Global Oil and Gas Industry in Qatar Volume Tonnes Forecast, by Downstream 2020 & 2033
- Table 43: Global Oil and Gas Industry in Qatar Revenue billion Forecast, by Country 2020 & 2033
- Table 44: Global Oil and Gas Industry in Qatar Volume Tonnes Forecast, by Country 2020 & 2033
- Table 45: United Kingdom Oil and Gas Industry in Qatar Revenue (billion) Forecast, by Application 2020 & 2033
- Table 46: United Kingdom Oil and Gas Industry in Qatar Volume (Tonnes) Forecast, by Application 2020 & 2033
- Table 47: Germany Oil and Gas Industry in Qatar Revenue (billion) Forecast, by Application 2020 & 2033
- Table 48: Germany Oil and Gas Industry in Qatar Volume (Tonnes) Forecast, by Application 2020 & 2033
- Table 49: France Oil and Gas Industry in Qatar Revenue (billion) Forecast, by Application 2020 & 2033
- Table 50: France Oil and Gas Industry in Qatar Volume (Tonnes) Forecast, by Application 2020 & 2033
- Table 51: Italy Oil and Gas Industry in Qatar Revenue (billion) Forecast, by Application 2020 & 2033
- Table 52: Italy Oil and Gas Industry in Qatar Volume (Tonnes) Forecast, by Application 2020 & 2033
- Table 53: Spain Oil and Gas Industry in Qatar Revenue (billion) Forecast, by Application 2020 & 2033
- Table 54: Spain Oil and Gas Industry in Qatar Volume (Tonnes) Forecast, by Application 2020 & 2033
- Table 55: Russia Oil and Gas Industry in Qatar Revenue (billion) Forecast, by Application 2020 & 2033
- Table 56: Russia Oil and Gas Industry in Qatar Volume (Tonnes) Forecast, by Application 2020 & 2033
- Table 57: Benelux Oil and Gas Industry in Qatar Revenue (billion) Forecast, by Application 2020 & 2033
- Table 58: Benelux Oil and Gas Industry in Qatar Volume (Tonnes) Forecast, by Application 2020 & 2033
- Table 59: Nordics Oil and Gas Industry in Qatar Revenue (billion) Forecast, by Application 2020 & 2033
- Table 60: Nordics Oil and Gas Industry in Qatar Volume (Tonnes) Forecast, by Application 2020 & 2033
- Table 61: Rest of Europe Oil and Gas Industry in Qatar Revenue (billion) Forecast, by Application 2020 & 2033
- Table 62: Rest of Europe Oil and Gas Industry in Qatar Volume (Tonnes) Forecast, by Application 2020 & 2033
- Table 63: Global Oil and Gas Industry in Qatar Revenue billion Forecast, by Upstream 2020 & 2033
- Table 64: Global Oil and Gas Industry in Qatar Volume Tonnes Forecast, by Upstream 2020 & 2033
- Table 65: Global Oil and Gas Industry in Qatar Revenue billion Forecast, by Midstream 2020 & 2033
- Table 66: Global Oil and Gas Industry in Qatar Volume Tonnes Forecast, by Midstream 2020 & 2033
- Table 67: Global Oil and Gas Industry in Qatar Revenue billion Forecast, by Downstream 2020 & 2033
- Table 68: Global Oil and Gas Industry in Qatar Volume Tonnes Forecast, by Downstream 2020 & 2033
- Table 69: Global Oil and Gas Industry in Qatar Revenue billion Forecast, by Country 2020 & 2033
- Table 70: Global Oil and Gas Industry in Qatar Volume Tonnes Forecast, by Country 2020 & 2033
- Table 71: Turkey Oil and Gas Industry in Qatar Revenue (billion) Forecast, by Application 2020 & 2033
- Table 72: Turkey Oil and Gas Industry in Qatar Volume (Tonnes) Forecast, by Application 2020 & 2033
- Table 73: Israel Oil and Gas Industry in Qatar Revenue (billion) Forecast, by Application 2020 & 2033
- Table 74: Israel Oil and Gas Industry in Qatar Volume (Tonnes) Forecast, by Application 2020 & 2033
- Table 75: GCC Oil and Gas Industry in Qatar Revenue (billion) Forecast, by Application 2020 & 2033
- Table 76: GCC Oil and Gas Industry in Qatar Volume (Tonnes) Forecast, by Application 2020 & 2033
- Table 77: North Africa Oil and Gas Industry in Qatar Revenue (billion) Forecast, by Application 2020 & 2033
- Table 78: North Africa Oil and Gas Industry in Qatar Volume (Tonnes) Forecast, by Application 2020 & 2033
- Table 79: South Africa Oil and Gas Industry in Qatar Revenue (billion) Forecast, by Application 2020 & 2033
- Table 80: South Africa Oil and Gas Industry in Qatar Volume (Tonnes) Forecast, by Application 2020 & 2033
- Table 81: Rest of Middle East & Africa Oil and Gas Industry in Qatar Revenue (billion) Forecast, by Application 2020 & 2033
- Table 82: Rest of Middle East & Africa Oil and Gas Industry in Qatar Volume (Tonnes) Forecast, by Application 2020 & 2033
- Table 83: Global Oil and Gas Industry in Qatar Revenue billion Forecast, by Upstream 2020 & 2033
- Table 84: Global Oil and Gas Industry in Qatar Volume Tonnes Forecast, by Upstream 2020 & 2033
- Table 85: Global Oil and Gas Industry in Qatar Revenue billion Forecast, by Midstream 2020 & 2033
- Table 86: Global Oil and Gas Industry in Qatar Volume Tonnes Forecast, by Midstream 2020 & 2033
- Table 87: Global Oil and Gas Industry in Qatar Revenue billion Forecast, by Downstream 2020 & 2033
- Table 88: Global Oil and Gas Industry in Qatar Volume Tonnes Forecast, by Downstream 2020 & 2033
- Table 89: Global Oil and Gas Industry in Qatar Revenue billion Forecast, by Country 2020 & 2033
- Table 90: Global Oil and Gas Industry in Qatar Volume Tonnes Forecast, by Country 2020 & 2033
- Table 91: China Oil and Gas Industry in Qatar Revenue (billion) Forecast, by Application 2020 & 2033
- Table 92: China Oil and Gas Industry in Qatar Volume (Tonnes) Forecast, by Application 2020 & 2033
- Table 93: India Oil and Gas Industry in Qatar Revenue (billion) Forecast, by Application 2020 & 2033
- Table 94: India Oil and Gas Industry in Qatar Volume (Tonnes) Forecast, by Application 2020 & 2033
- Table 95: Japan Oil and Gas Industry in Qatar Revenue (billion) Forecast, by Application 2020 & 2033
- Table 96: Japan Oil and Gas Industry in Qatar Volume (Tonnes) Forecast, by Application 2020 & 2033
- Table 97: South Korea Oil and Gas Industry in Qatar Revenue (billion) Forecast, by Application 2020 & 2033
- Table 98: South Korea Oil and Gas Industry in Qatar Volume (Tonnes) Forecast, by Application 2020 & 2033
- Table 99: ASEAN Oil and Gas Industry in Qatar Revenue (billion) Forecast, by Application 2020 & 2033
- Table 100: ASEAN Oil and Gas Industry in Qatar Volume (Tonnes) Forecast, by Application 2020 & 2033
- Table 101: Oceania Oil and Gas Industry in Qatar Revenue (billion) Forecast, by Application 2020 & 2033
- Table 102: Oceania Oil and Gas Industry in Qatar Volume (Tonnes) Forecast, by Application 2020 & 2033
- Table 103: Rest of Asia Pacific Oil and Gas Industry in Qatar Revenue (billion) Forecast, by Application 2020 & 2033
- Table 104: Rest of Asia Pacific Oil and Gas Industry in Qatar Volume (Tonnes) Forecast, by Application 2020 & 2033
Frequently Asked Questions
1. What is the projected Compound Annual Growth Rate (CAGR) of the Oil and Gas Industry in Qatar?
The projected CAGR is approximately 4.2%.
2. Which companies are prominent players in the Oil and Gas Industry in Qatar?
Key companies in the market include Exxon Mobil Corporation, TotalEnergies SE, Qatargas Operating Company Limited, ConocoPhillips Company, Qatar Petroleum.
3. What are the main segments of the Oil and Gas Industry in Qatar?
The market segments include Upstream, Midstream, Downstream.
4. Can you provide details about the market size?
The market size is estimated to be USD 38 billion as of 2022.
5. What are some drivers contributing to market growth?
Drivers; Restraints.
6. What are the notable trends driving market growth?
Upstream Segment to Dominate the Market.
7. Are there any restraints impacting market growth?
4.; Political Instability and Militant Attacks on Pipeline Infrastructure.
8. Can you provide examples of recent developments in the market?
N/A
9. What pricing options are available for accessing the report?
Pricing options include single-user, multi-user, and enterprise licenses priced at USD 3800, USD 4500, and USD 5800 respectively.
10. Is the market size provided in terms of value or volume?
The market size is provided in terms of value, measured in billion and volume, measured in Tonnes.
11. Are there any specific market keywords associated with the report?
Yes, the market keyword associated with the report is "Oil and Gas Industry in Qatar," which aids in identifying and referencing the specific market segment covered.
12. How do I determine which pricing option suits my needs best?
The pricing options vary based on user requirements and access needs. Individual users may opt for single-user licenses, while businesses requiring broader access may choose multi-user or enterprise licenses for cost-effective access to the report.
13. Are there any additional resources or data provided in the Oil and Gas Industry in Qatar report?
While the report offers comprehensive insights, it's advisable to review the specific contents or supplementary materials provided to ascertain if additional resources or data are available.
14. How can I stay updated on further developments or reports in the Oil and Gas Industry in Qatar?
To stay informed about further developments, trends, and reports in the Oil and Gas Industry in Qatar, consider subscribing to industry newsletters, following relevant companies and organizations, or regularly checking reputable industry news sources and publications.
Methodology
Step 1 - Identification of Relevant Samples Size from Population Database


Step 2 - Approaches for Defining Global Market Size (Value, Volume* & Price*)

Note*: In applicable scenarios
Step 3 - Data Sources
Primary Research
- Web Analytics
- Survey Reports
- Research Institute
- Latest Research Reports
- Opinion Leaders
Secondary Research
- Annual Reports
- White Paper
- Latest Press Release
- Industry Association
- Paid Database
- Investor Presentations

Step 4 - Data Triangulation
Involves using different sources of information in order to increase the validity of a study
These sources are likely to be stakeholders in a program - participants, other researchers, program staff, other community members, and so on.
Then we put all data in single framework & apply various statistical tools to find out the dynamic on the market.
During the analysis stage, feedback from the stakeholder groups would be compared to determine areas of agreement as well as areas of divergence