

Key Insights
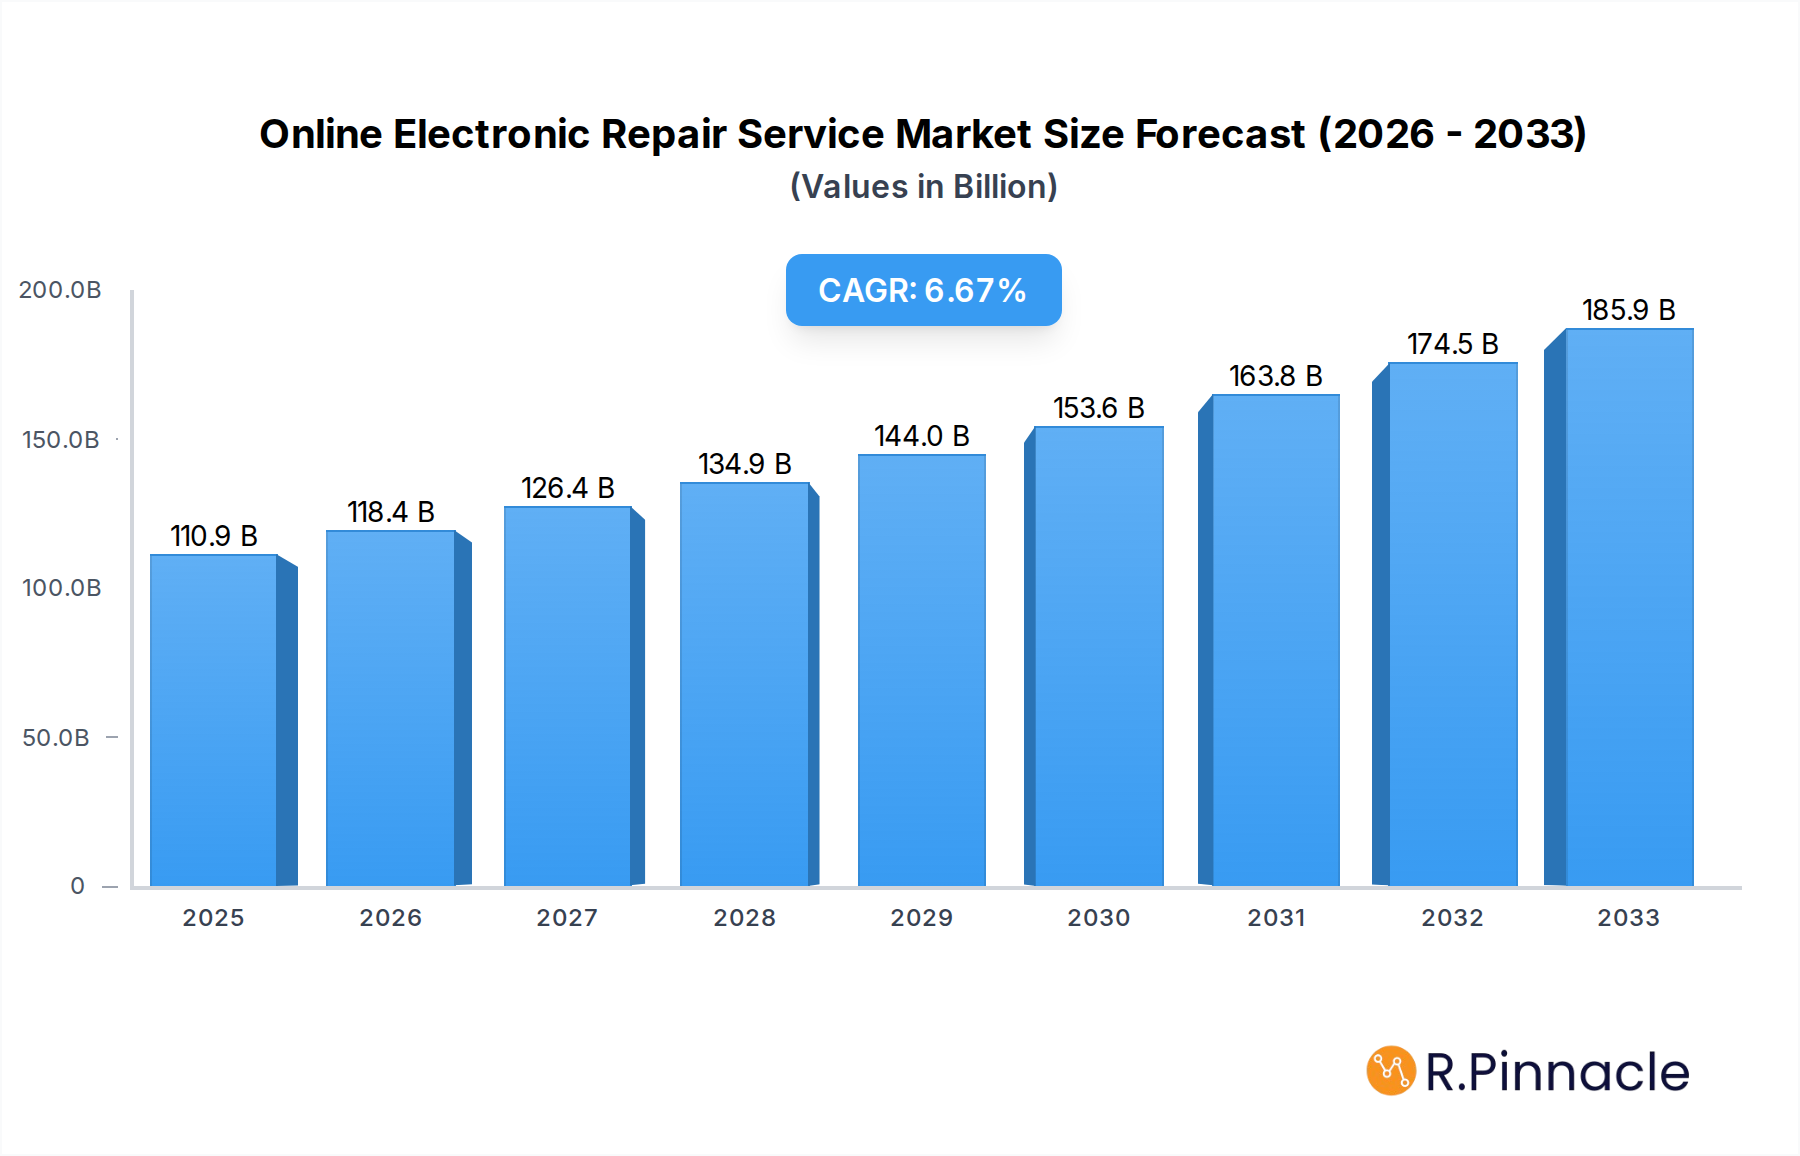
The global Online Electronic Repair Service market is poised for significant expansion, projected to reach an estimated $110.9 billion in 2025. This robust growth is fueled by a compelling compound annual growth rate (CAGR) of 6.8% from 2019 to 2033. A primary driver for this upward trajectory is the burgeoning consumer electronics industry, with a consistent influx of new smartphones, tablets, and laptops demanding ongoing support and repair. The increasing complexity and cost of advanced devices also encourage consumers to opt for repair services over premature replacement. Furthermore, the growing awareness and preference for sustainable practices contribute to the demand for repair services as an eco-friendly alternative. The convenience offered by online platforms, enabling users to book appointments, track repairs, and receive devices at their doorstep, further enhances market appeal. The proliferation of IT infrastructure and the burgeoning telecommunications sector also create a sustained need for specialized electronic repair.

Online Electronic Repair Service Market Size (In Billion)
The market's expansion is further bolstered by evolving consumer behaviors and technological advancements. The entertainment and media industry's reliance on various electronic devices, from gaming consoles to high-definition televisions, creates a consistent demand for their upkeep. While the market shows strong potential, certain challenges exist. The availability of affordable new devices can sometimes present a competitive barrier, and the perceived complexity of certain repairs might deter some consumers. However, the increasing professionalism and accessibility of online repair services, coupled with specialized offerings like smartphone, tablet, and laptop repairs, are effectively mitigating these restraints. Leading companies like iCracked, uBreakiFix, and Puls Technologies are at the forefront, innovating service delivery models and expanding their reach across key regions such as North America, Europe, and Asia Pacific, which are expected to dominate market share due to high device penetration and consumer spending.
Online Electronic Repair Service Company Market Share
This in-depth report provides a detailed examination of the global Online Electronic Repair Service market, covering historical trends, current dynamics, and future projections. Spanning the study period from 2019 to 2033, with a base year of 2025, this report offers invaluable insights for industry stakeholders, including service providers, manufacturers, investors, and technology enthusiasts. Our analysis delves into market structure, key dynamics, dominant regions and segments, product innovations, growth drivers, challenges, emerging opportunities, and the competitive landscape, ensuring a holistic understanding of this rapidly evolving sector.
Online Electronic Repair Service Market Structure & Innovation Trends
The online electronic repair service market exhibits a moderate to highly fragmented structure, with a significant presence of both large, established players and a burgeoning number of smaller, specialized service providers. Market concentration is influenced by regional penetration, service specialization, and the ability to integrate with e-commerce platforms. Innovation in this sector is primarily driven by advancements in diagnostic tools, remote troubleshooting capabilities, the development of specialized repair techniques for increasingly complex devices, and the adoption of sustainable repair practices to reduce e-waste. Regulatory frameworks are evolving, focusing on consumer protection, data privacy during repair processes, and the promotion of repairability standards to combat planned obsolescence. Product substitutes, such as device replacement, extended warranties, and device insurance, continuously influence the demand for repair services. End-user demographics skew towards younger, tech-savvy consumers who prioritize convenience and cost-effectiveness, but a growing segment of environmentally conscious individuals also drives demand for repair over replacement. Mergers and acquisitions (M&A) activity is a notable trend, with larger entities acquiring smaller, innovative startups to expand their service offerings, geographical reach, and technological expertise. For instance, notable M&A deals in the historical period (2019-2024) indicate a valuation range of xx billion to xx billion for strategic acquisitions, signifying a consolidation phase in certain sub-segments.
Online Electronic Repair Service Market Dynamics & Trends
The online electronic repair service market is poised for significant expansion, driven by a confluence of accelerating technological adoption, increasing device complexity, and a growing consumer inclination towards sustainable practices. The projected Compound Annual Growth Rate (CAGR) for the forecast period (2025–2033) is estimated at xx%, indicating robust market penetration and sustained demand. A primary growth driver is the sheer volume of consumer electronics in circulation. The ubiquitous nature of smartphones, tablets, laptops, and gaming consoles means a constant stream of devices requiring maintenance and repair. As these devices become more sophisticated, with intricate components and advanced features, the need for specialized and professional repair services escalates. Consumers are increasingly aware of the environmental impact of electronic waste and are actively seeking repair options as a more sustainable alternative to purchasing new devices. This "right to repair" movement is gaining traction globally, influencing both consumer behavior and regulatory landscapes. Technological disruptions are also shaping the market. Advancements in remote diagnostic tools, artificial intelligence for fault detection, and the development of modular repair components are streamlining the repair process, making it more efficient and cost-effective. The rise of online platforms and marketplaces has democratized access to repair services, allowing consumers to easily compare options, book appointments, and track repair progress. Competitive dynamics are intense, with both brick-and-mortar service centers expanding their online presence and pure-play online repair platforms vying for market share. Companies are investing heavily in logistics, technician training, and customer experience to differentiate themselves. The market penetration of online repair services, which currently stands at approximately xx% of the total electronics repair market, is expected to rise significantly as consumer trust and awareness grow. The overall market size, valued at xx billion in the historical base year of 2024, is projected to reach xx billion by 2033, underscoring the immense growth potential.
Dominant Regions & Segments in Online Electronic Repair Service
North America, particularly the United States, currently holds a dominant position in the online electronic repair service market. This dominance is underpinned by several key factors, including a highly developed digital infrastructure, a large and affluent consumer base with high disposable income, and a strong culture of technology adoption and replacement. Economic policies in the region have historically favored technological innovation and consumer spending, creating a fertile ground for service-based industries. The robust presence of major electronic device manufacturers and a well-established aftermarket repair ecosystem further bolster North America's leadership.
Key Drivers of Regional Dominance:
- High Device Penetration: The exceptionally high ownership rates of smartphones, tablets, and laptops per capita ensure a continuous demand for repair services.
- Consumer Convenience: The ingrained preference for online services and doorstep delivery models aligns perfectly with the offerings of online repair providers.
- Technological Savvy Consumer Base: A population adept at utilizing online platforms for purchasing, service booking, and information gathering readily embraces online repair solutions.
- Supportive Regulatory Environment (for repair initiatives): While evolving, policies that encourage repairability and consumer choice contribute to market growth.
Within the Types segmentation, Smartphone Repair emerges as the largest and most dynamic segment. The sheer volume of smartphone users globally, coupled with the susceptibility of these devices to damage (screen cracks, battery degradation), makes them a constant source of repair demand. The market for smartphone repair alone is projected to account for xx billion in 2025, growing at a CAGR of xx% through 2033.
Key Drivers for Smartphone Repair Dominance:
- Ubiquity of Smartphones: Billions of active smartphones worldwide create a perpetual need for repairs.
- Cost-Effectiveness: Repairing a smartphone is significantly cheaper than replacing it, a crucial factor for many consumers.
- Technological Advancements: The continuous release of new smartphone models necessitates ongoing support for older devices.
The Application segmentation sees the Consumer Electronics Industry as the primary driver, followed closely by the IT Industry. The extensive use of personal electronics in daily life ensures a consistent demand for their upkeep. The Telecommunications Industry also plays a crucial role, as many devices are tied to network services. The Entertainment and Media Industry, with its reliance on gaming consoles and high-end audio-visual equipment, represents a significant niche.
Online Electronic Repair Service Product Innovations
Product innovations in the online electronic repair service market are focused on enhancing efficiency, convenience, and customer satisfaction. This includes the development of advanced remote diagnostic software, the creation of modular repair kits for popular devices, and the implementation of AI-powered troubleshooting guides. Companies are also investing in sustainable repair practices, offering eco-friendly component replacements and end-of-life device recycling programs. These innovations provide a competitive advantage by reducing repair times, lowering costs, and appealing to an environmentally conscious consumer base.
Report Scope & Segmentation Analysis
This report comprehensively segments the online electronic repair service market across key dimensions.
Application Segments:
- Consumer Electronics Industry: Encompassing repairs for smartphones, tablets, smart home devices, and personal audio equipment. Projected market size of xx billion in 2025 with a xx% CAGR.
- Telecommunications Industry: Focusing on devices used for communication, including mobile phones and associated accessories.
- IT Industry: Covering laptop, computer, and other business-related electronic device repairs.
- Entertainment and Media Industry: Including gaming consoles, televisions, and audio-visual equipment.
- Others: This segment captures niche electronic devices and emerging technologies.
Types Segments:
- Smartphone Repair: The largest segment, driven by high device penetration and repair demand.
- Tablet Repair: A significant segment, mirroring smartphone repair trends.
- Laptop/Computer Repair: A stable segment, essential for productivity and professional use.
- Gaming Console Repair: A growing segment driven by the popularity of gaming.
- Television Repair: A mature segment with consistent demand.
- Others: Emerging categories like wearables and specialized electronics.
Key Drivers of Online Electronic Repair Service Growth
The growth of the online electronic repair service market is propelled by several critical factors. The escalating cost of new electronic devices makes repair a more economically viable option for consumers, thus boosting demand. The increasing lifespan and complexity of modern electronics, coupled with a growing awareness of environmental sustainability and the "right to repair" movement, further fuel the need for repair services. Technological advancements in diagnostic tools and repair methodologies are enhancing the efficiency and accessibility of these services. Furthermore, the convenience offered by online platforms, including doorstep pickup and delivery, is a significant attraction for consumers seeking hassle-free solutions.
Challenges in the Online Electronic Repair Service Sector
Despite robust growth, the online electronic repair service sector faces several hurdles. Regulatory complexities and varying compliance requirements across different regions can hinder seamless expansion. Supply chain disruptions for critical spare parts, exacerbated by global events, can lead to extended repair times and increased costs. Intense competition from both established brands offering in-house repair services and a plethora of independent service providers also puts pressure on pricing and market share. Moreover, building and maintaining consumer trust regarding data security and the quality of repairs remains a continuous challenge. The cost of skilled labor and the need for ongoing technician training also represent significant operational considerations.
Emerging Opportunities in Online Electronic Repair Service
The online electronic repair service market is ripe with emerging opportunities. The rapid adoption of wearable technology and the Internet of Things (IoT) devices presents a new frontier for specialized repair services. The increasing focus on sustainability and the circular economy is creating demand for refurbishment and upcycling services. Advancements in 3D printing technology are enabling on-demand production of specialized repair components, further reducing lead times and costs. Furthermore, the expansion of services into emerging economies with growing disposable incomes and increasing electronic device ownership offers significant untapped potential. Partnerships with device manufacturers and e-commerce platforms can unlock new customer acquisition channels and enhance service delivery models.
Leading Players in the Online Electronic Repair Service Market
- iCracked
- uBreakiFix
- Puls Technologies Inc.
- CellSavers
- SquareTrade
- CPR Cell Phone Repair
- Batteries Plus Bulbs
- Phone Medic
- Geek Squad
- iFixYouri
- Quick Mobile Repair
- iFixit
- iResQ
- MendMyi
- Timeless Mobile Tech
- Fix My Gadget
- One Hour Device Repair
- The Tech Know Space
- Gophermods
- Mission:Repair
- SmartChoice Repair Center
- Phone-ER
- TechRestore
- Jet City Device Repair
- JCD Repair
Key Developments in Online Electronic Repair Service Industry
- 2023 March: iCracked expands its international repair network with new partnerships in xx European countries.
- 2022 August: uBreakiFix announces a strategic alliance with a major telecommunications provider to offer on-site device repair services.
- 2022 April: Puls Technologies Inc. introduces an AI-powered diagnostic tool to accelerate troubleshooting for mobile devices.
- 2021 December: SquareTrade invests xx billion in expanding its device repair infrastructure and technician training programs.
- 2021 September: CPR Cell Phone Repair launches a new franchise initiative targeting underserved markets.
- 2020 October: Batteries Plus Bulbs broadens its service portfolio to include repair for a wider range of smart home devices.
- 2020 February: iFixit releases a comprehensive guide and repair kit for a new generation of flagship smartphones.
- 2019 November: Geek Squad enhances its remote support capabilities with new software integrations.
Future Outlook for Online Electronic Repair Service Market
The future outlook for the online electronic repair service market is exceptionally bright, characterized by sustained growth and increasing sophistication. The trend towards greater device longevity and the "right to repair" movement will continue to be powerful catalysts. Innovations in diagnostic technology, such as augmented reality and advanced AI, will further streamline repair processes and enhance accuracy. The expansion into new device categories like wearables and smart home ecosystems will open up significant market opportunities. Strategic collaborations and mergers will likely continue as companies seek to scale their operations and expand their service offerings. Overall, the market is expected to evolve into a more integrated and efficient ecosystem, prioritizing sustainability, customer convenience, and technological advancement, with a projected market size reaching xx billion by 2033.
Online Electronic Repair Service Segmentation
-
1. Application
- 1.1. Consumer Electronics Industry
- 1.2. Telecommunications Industry
- 1.3. IT Industry
- 1.4. Entertainment and Media Industry
- 1.5. Others
-
2. Types
- 2.1. Smartphone Repair
- 2.2. Tablet Repair
- 2.3. Laptop/Computer Repair
- 2.4. Gaming Console Repair
- 2.5. Television Repair
- 2.6. Others
Online Electronic Repair Service Segmentation By Geography
-
1. North America
- 1.1. United States
- 1.2. Canada
- 1.3. Mexico
-
2. South America
- 2.1. Brazil
- 2.2. Argentina
- 2.3. Rest of South America
-
3. Europe
- 3.1. United Kingdom
- 3.2. Germany
- 3.3. France
- 3.4. Italy
- 3.5. Spain
- 3.6. Russia
- 3.7. Benelux
- 3.8. Nordics
- 3.9. Rest of Europe
-
4. Middle East & Africa
- 4.1. Turkey
- 4.2. Israel
- 4.3. GCC
- 4.4. North Africa
- 4.5. South Africa
- 4.6. Rest of Middle East & Africa
-
5. Asia Pacific
- 5.1. China
- 5.2. India
- 5.3. Japan
- 5.4. South Korea
- 5.5. ASEAN
- 5.6. Oceania
- 5.7. Rest of Asia Pacific

Online Electronic Repair Service Regional Market Share
Geographic Coverage of Online Electronic Repair Service
Online Electronic Repair Service REPORT HIGHLIGHTS
| Aspects | Details |
|---|---|
| Study Period | 2020-2034 |
| Base Year | 2025 |
| Estimated Year | 2026 |
| Forecast Period | 2026-2034 |
| Historical Period | 2020-2025 |
| Growth Rate | CAGR of 6.8% from 2020-2034 |
| Segmentation |
|
Table of Contents
- 1. Introduction
- 1.1. Research Scope
- 1.2. Market Segmentation
- 1.3. Research Methodology
- 1.4. Definitions and Assumptions
- 2. Executive Summary
- 2.1. Introduction
- 3. Market Dynamics
- 3.1. Introduction
- 3.2. Market Drivers
- 3.3. Market Restrains
- 3.4. Market Trends
- 4. Market Factor Analysis
- 4.1. Porters Five Forces
- 4.2. Supply/Value Chain
- 4.3. PESTEL analysis
- 4.4. Market Entropy
- 4.5. Patent/Trademark Analysis
- 5. Global Online Electronic Repair Service Analysis, Insights and Forecast, 2020-2032
- 5.1. Market Analysis, Insights and Forecast - by Application
- 5.1.1. Consumer Electronics Industry
- 5.1.2. Telecommunications Industry
- 5.1.3. IT Industry
- 5.1.4. Entertainment and Media Industry
- 5.1.5. Others
- 5.2. Market Analysis, Insights and Forecast - by Types
- 5.2.1. Smartphone Repair
- 5.2.2. Tablet Repair
- 5.2.3. Laptop/Computer Repair
- 5.2.4. Gaming Console Repair
- 5.2.5. Television Repair
- 5.2.6. Others
- 5.3. Market Analysis, Insights and Forecast - by Region
- 5.3.1. North America
- 5.3.2. South America
- 5.3.3. Europe
- 5.3.4. Middle East & Africa
- 5.3.5. Asia Pacific
- 5.1. Market Analysis, Insights and Forecast - by Application
- 6. North America Online Electronic Repair Service Analysis, Insights and Forecast, 2020-2032
- 6.1. Market Analysis, Insights and Forecast - by Application
- 6.1.1. Consumer Electronics Industry
- 6.1.2. Telecommunications Industry
- 6.1.3. IT Industry
- 6.1.4. Entertainment and Media Industry
- 6.1.5. Others
- 6.2. Market Analysis, Insights and Forecast - by Types
- 6.2.1. Smartphone Repair
- 6.2.2. Tablet Repair
- 6.2.3. Laptop/Computer Repair
- 6.2.4. Gaming Console Repair
- 6.2.5. Television Repair
- 6.2.6. Others
- 6.1. Market Analysis, Insights and Forecast - by Application
- 7. South America Online Electronic Repair Service Analysis, Insights and Forecast, 2020-2032
- 7.1. Market Analysis, Insights and Forecast - by Application
- 7.1.1. Consumer Electronics Industry
- 7.1.2. Telecommunications Industry
- 7.1.3. IT Industry
- 7.1.4. Entertainment and Media Industry
- 7.1.5. Others
- 7.2. Market Analysis, Insights and Forecast - by Types
- 7.2.1. Smartphone Repair
- 7.2.2. Tablet Repair
- 7.2.3. Laptop/Computer Repair
- 7.2.4. Gaming Console Repair
- 7.2.5. Television Repair
- 7.2.6. Others
- 7.1. Market Analysis, Insights and Forecast - by Application
- 8. Europe Online Electronic Repair Service Analysis, Insights and Forecast, 2020-2032
- 8.1. Market Analysis, Insights and Forecast - by Application
- 8.1.1. Consumer Electronics Industry
- 8.1.2. Telecommunications Industry
- 8.1.3. IT Industry
- 8.1.4. Entertainment and Media Industry
- 8.1.5. Others
- 8.2. Market Analysis, Insights and Forecast - by Types
- 8.2.1. Smartphone Repair
- 8.2.2. Tablet Repair
- 8.2.3. Laptop/Computer Repair
- 8.2.4. Gaming Console Repair
- 8.2.5. Television Repair
- 8.2.6. Others
- 8.1. Market Analysis, Insights and Forecast - by Application
- 9. Middle East & Africa Online Electronic Repair Service Analysis, Insights and Forecast, 2020-2032
- 9.1. Market Analysis, Insights and Forecast - by Application
- 9.1.1. Consumer Electronics Industry
- 9.1.2. Telecommunications Industry
- 9.1.3. IT Industry
- 9.1.4. Entertainment and Media Industry
- 9.1.5. Others
- 9.2. Market Analysis, Insights and Forecast - by Types
- 9.2.1. Smartphone Repair
- 9.2.2. Tablet Repair
- 9.2.3. Laptop/Computer Repair
- 9.2.4. Gaming Console Repair
- 9.2.5. Television Repair
- 9.2.6. Others
- 9.1. Market Analysis, Insights and Forecast - by Application
- 10. Asia Pacific Online Electronic Repair Service Analysis, Insights and Forecast, 2020-2032
- 10.1. Market Analysis, Insights and Forecast - by Application
- 10.1.1. Consumer Electronics Industry
- 10.1.2. Telecommunications Industry
- 10.1.3. IT Industry
- 10.1.4. Entertainment and Media Industry
- 10.1.5. Others
- 10.2. Market Analysis, Insights and Forecast - by Types
- 10.2.1. Smartphone Repair
- 10.2.2. Tablet Repair
- 10.2.3. Laptop/Computer Repair
- 10.2.4. Gaming Console Repair
- 10.2.5. Television Repair
- 10.2.6. Others
- 10.1. Market Analysis, Insights and Forecast - by Application
- 11. Competitive Analysis
- 11.1. Global Market Share Analysis 2025
- 11.2. Company Profiles
- 11.2.1 iCracked
- 11.2.1.1. Overview
- 11.2.1.2. Products
- 11.2.1.3. SWOT Analysis
- 11.2.1.4. Recent Developments
- 11.2.1.5. Financials (Based on Availability)
- 11.2.2 uBreakiFix
- 11.2.2.1. Overview
- 11.2.2.2. Products
- 11.2.2.3. SWOT Analysis
- 11.2.2.4. Recent Developments
- 11.2.2.5. Financials (Based on Availability)
- 11.2.3 Puls Technologies Inc.
- 11.2.3.1. Overview
- 11.2.3.2. Products
- 11.2.3.3. SWOT Analysis
- 11.2.3.4. Recent Developments
- 11.2.3.5. Financials (Based on Availability)
- 11.2.4 CellSavers
- 11.2.4.1. Overview
- 11.2.4.2. Products
- 11.2.4.3. SWOT Analysis
- 11.2.4.4. Recent Developments
- 11.2.4.5. Financials (Based on Availability)
- 11.2.5 SquareTrade
- 11.2.5.1. Overview
- 11.2.5.2. Products
- 11.2.5.3. SWOT Analysis
- 11.2.5.4. Recent Developments
- 11.2.5.5. Financials (Based on Availability)
- 11.2.6 CPR Cell Phone Repair
- 11.2.6.1. Overview
- 11.2.6.2. Products
- 11.2.6.3. SWOT Analysis
- 11.2.6.4. Recent Developments
- 11.2.6.5. Financials (Based on Availability)
- 11.2.7 Batteries Plus Bulbs
- 11.2.7.1. Overview
- 11.2.7.2. Products
- 11.2.7.3. SWOT Analysis
- 11.2.7.4. Recent Developments
- 11.2.7.5. Financials (Based on Availability)
- 11.2.8 Phone Medic
- 11.2.8.1. Overview
- 11.2.8.2. Products
- 11.2.8.3. SWOT Analysis
- 11.2.8.4. Recent Developments
- 11.2.8.5. Financials (Based on Availability)
- 11.2.9 Geek Squad
- 11.2.9.1. Overview
- 11.2.9.2. Products
- 11.2.9.3. SWOT Analysis
- 11.2.9.4. Recent Developments
- 11.2.9.5. Financials (Based on Availability)
- 11.2.10 iFixYouri
- 11.2.10.1. Overview
- 11.2.10.2. Products
- 11.2.10.3. SWOT Analysis
- 11.2.10.4. Recent Developments
- 11.2.10.5. Financials (Based on Availability)
- 11.2.11 Quick Mobile Repair
- 11.2.11.1. Overview
- 11.2.11.2. Products
- 11.2.11.3. SWOT Analysis
- 11.2.11.4. Recent Developments
- 11.2.11.5. Financials (Based on Availability)
- 11.2.12 iFixit
- 11.2.12.1. Overview
- 11.2.12.2. Products
- 11.2.12.3. SWOT Analysis
- 11.2.12.4. Recent Developments
- 11.2.12.5. Financials (Based on Availability)
- 11.2.13 iResQ
- 11.2.13.1. Overview
- 11.2.13.2. Products
- 11.2.13.3. SWOT Analysis
- 11.2.13.4. Recent Developments
- 11.2.13.5. Financials (Based on Availability)
- 11.2.14 MendMyi
- 11.2.14.1. Overview
- 11.2.14.2. Products
- 11.2.14.3. SWOT Analysis
- 11.2.14.4. Recent Developments
- 11.2.14.5. Financials (Based on Availability)
- 11.2.15 Timeless Mobile Tech
- 11.2.15.1. Overview
- 11.2.15.2. Products
- 11.2.15.3. SWOT Analysis
- 11.2.15.4. Recent Developments
- 11.2.15.5. Financials (Based on Availability)
- 11.2.16 Fix My Gadget
- 11.2.16.1. Overview
- 11.2.16.2. Products
- 11.2.16.3. SWOT Analysis
- 11.2.16.4. Recent Developments
- 11.2.16.5. Financials (Based on Availability)
- 11.2.17 One Hour Device Repair
- 11.2.17.1. Overview
- 11.2.17.2. Products
- 11.2.17.3. SWOT Analysis
- 11.2.17.4. Recent Developments
- 11.2.17.5. Financials (Based on Availability)
- 11.2.18 The Tech Know Space
- 11.2.18.1. Overview
- 11.2.18.2. Products
- 11.2.18.3. SWOT Analysis
- 11.2.18.4. Recent Developments
- 11.2.18.5. Financials (Based on Availability)
- 11.2.19 Gophermods
- 11.2.19.1. Overview
- 11.2.19.2. Products
- 11.2.19.3. SWOT Analysis
- 11.2.19.4. Recent Developments
- 11.2.19.5. Financials (Based on Availability)
- 11.2.20 Mission
- 11.2.20.1. Overview
- 11.2.20.2. Products
- 11.2.20.3. SWOT Analysis
- 11.2.20.4. Recent Developments
- 11.2.20.5. Financials (Based on Availability)
- 11.2.1 iCracked
List of Figures
- Figure 1: Global Online Electronic Repair Service Revenue Breakdown (undefined, %) by Region 2025 & 2033
- Figure 2: North America Online Electronic Repair Service Revenue (undefined), by Application 2025 & 2033
- Figure 3: North America Online Electronic Repair Service Revenue Share (%), by Application 2025 & 2033
- Figure 4: North America Online Electronic Repair Service Revenue (undefined), by Types 2025 & 2033
- Figure 5: North America Online Electronic Repair Service Revenue Share (%), by Types 2025 & 2033
- Figure 6: North America Online Electronic Repair Service Revenue (undefined), by Country 2025 & 2033
- Figure 7: North America Online Electronic Repair Service Revenue Share (%), by Country 2025 & 2033
- Figure 8: South America Online Electronic Repair Service Revenue (undefined), by Application 2025 & 2033
- Figure 9: South America Online Electronic Repair Service Revenue Share (%), by Application 2025 & 2033
- Figure 10: South America Online Electronic Repair Service Revenue (undefined), by Types 2025 & 2033
- Figure 11: South America Online Electronic Repair Service Revenue Share (%), by Types 2025 & 2033
- Figure 12: South America Online Electronic Repair Service Revenue (undefined), by Country 2025 & 2033
- Figure 13: South America Online Electronic Repair Service Revenue Share (%), by Country 2025 & 2033
- Figure 14: Europe Online Electronic Repair Service Revenue (undefined), by Application 2025 & 2033
- Figure 15: Europe Online Electronic Repair Service Revenue Share (%), by Application 2025 & 2033
- Figure 16: Europe Online Electronic Repair Service Revenue (undefined), by Types 2025 & 2033
- Figure 17: Europe Online Electronic Repair Service Revenue Share (%), by Types 2025 & 2033
- Figure 18: Europe Online Electronic Repair Service Revenue (undefined), by Country 2025 & 2033
- Figure 19: Europe Online Electronic Repair Service Revenue Share (%), by Country 2025 & 2033
- Figure 20: Middle East & Africa Online Electronic Repair Service Revenue (undefined), by Application 2025 & 2033
- Figure 21: Middle East & Africa Online Electronic Repair Service Revenue Share (%), by Application 2025 & 2033
- Figure 22: Middle East & Africa Online Electronic Repair Service Revenue (undefined), by Types 2025 & 2033
- Figure 23: Middle East & Africa Online Electronic Repair Service Revenue Share (%), by Types 2025 & 2033
- Figure 24: Middle East & Africa Online Electronic Repair Service Revenue (undefined), by Country 2025 & 2033
- Figure 25: Middle East & Africa Online Electronic Repair Service Revenue Share (%), by Country 2025 & 2033
- Figure 26: Asia Pacific Online Electronic Repair Service Revenue (undefined), by Application 2025 & 2033
- Figure 27: Asia Pacific Online Electronic Repair Service Revenue Share (%), by Application 2025 & 2033
- Figure 28: Asia Pacific Online Electronic Repair Service Revenue (undefined), by Types 2025 & 2033
- Figure 29: Asia Pacific Online Electronic Repair Service Revenue Share (%), by Types 2025 & 2033
- Figure 30: Asia Pacific Online Electronic Repair Service Revenue (undefined), by Country 2025 & 2033
- Figure 31: Asia Pacific Online Electronic Repair Service Revenue Share (%), by Country 2025 & 2033
List of Tables
- Table 1: Global Online Electronic Repair Service Revenue undefined Forecast, by Application 2020 & 2033
- Table 2: Global Online Electronic Repair Service Revenue undefined Forecast, by Types 2020 & 2033
- Table 3: Global Online Electronic Repair Service Revenue undefined Forecast, by Region 2020 & 2033
- Table 4: Global Online Electronic Repair Service Revenue undefined Forecast, by Application 2020 & 2033
- Table 5: Global Online Electronic Repair Service Revenue undefined Forecast, by Types 2020 & 2033
- Table 6: Global Online Electronic Repair Service Revenue undefined Forecast, by Country 2020 & 2033
- Table 7: United States Online Electronic Repair Service Revenue (undefined) Forecast, by Application 2020 & 2033
- Table 8: Canada Online Electronic Repair Service Revenue (undefined) Forecast, by Application 2020 & 2033
- Table 9: Mexico Online Electronic Repair Service Revenue (undefined) Forecast, by Application 2020 & 2033
- Table 10: Global Online Electronic Repair Service Revenue undefined Forecast, by Application 2020 & 2033
- Table 11: Global Online Electronic Repair Service Revenue undefined Forecast, by Types 2020 & 2033
- Table 12: Global Online Electronic Repair Service Revenue undefined Forecast, by Country 2020 & 2033
- Table 13: Brazil Online Electronic Repair Service Revenue (undefined) Forecast, by Application 2020 & 2033
- Table 14: Argentina Online Electronic Repair Service Revenue (undefined) Forecast, by Application 2020 & 2033
- Table 15: Rest of South America Online Electronic Repair Service Revenue (undefined) Forecast, by Application 2020 & 2033
- Table 16: Global Online Electronic Repair Service Revenue undefined Forecast, by Application 2020 & 2033
- Table 17: Global Online Electronic Repair Service Revenue undefined Forecast, by Types 2020 & 2033
- Table 18: Global Online Electronic Repair Service Revenue undefined Forecast, by Country 2020 & 2033
- Table 19: United Kingdom Online Electronic Repair Service Revenue (undefined) Forecast, by Application 2020 & 2033
- Table 20: Germany Online Electronic Repair Service Revenue (undefined) Forecast, by Application 2020 & 2033
- Table 21: France Online Electronic Repair Service Revenue (undefined) Forecast, by Application 2020 & 2033
- Table 22: Italy Online Electronic Repair Service Revenue (undefined) Forecast, by Application 2020 & 2033
- Table 23: Spain Online Electronic Repair Service Revenue (undefined) Forecast, by Application 2020 & 2033
- Table 24: Russia Online Electronic Repair Service Revenue (undefined) Forecast, by Application 2020 & 2033
- Table 25: Benelux Online Electronic Repair Service Revenue (undefined) Forecast, by Application 2020 & 2033
- Table 26: Nordics Online Electronic Repair Service Revenue (undefined) Forecast, by Application 2020 & 2033
- Table 27: Rest of Europe Online Electronic Repair Service Revenue (undefined) Forecast, by Application 2020 & 2033
- Table 28: Global Online Electronic Repair Service Revenue undefined Forecast, by Application 2020 & 2033
- Table 29: Global Online Electronic Repair Service Revenue undefined Forecast, by Types 2020 & 2033
- Table 30: Global Online Electronic Repair Service Revenue undefined Forecast, by Country 2020 & 2033
- Table 31: Turkey Online Electronic Repair Service Revenue (undefined) Forecast, by Application 2020 & 2033
- Table 32: Israel Online Electronic Repair Service Revenue (undefined) Forecast, by Application 2020 & 2033
- Table 33: GCC Online Electronic Repair Service Revenue (undefined) Forecast, by Application 2020 & 2033
- Table 34: North Africa Online Electronic Repair Service Revenue (undefined) Forecast, by Application 2020 & 2033
- Table 35: South Africa Online Electronic Repair Service Revenue (undefined) Forecast, by Application 2020 & 2033
- Table 36: Rest of Middle East & Africa Online Electronic Repair Service Revenue (undefined) Forecast, by Application 2020 & 2033
- Table 37: Global Online Electronic Repair Service Revenue undefined Forecast, by Application 2020 & 2033
- Table 38: Global Online Electronic Repair Service Revenue undefined Forecast, by Types 2020 & 2033
- Table 39: Global Online Electronic Repair Service Revenue undefined Forecast, by Country 2020 & 2033
- Table 40: China Online Electronic Repair Service Revenue (undefined) Forecast, by Application 2020 & 2033
- Table 41: India Online Electronic Repair Service Revenue (undefined) Forecast, by Application 2020 & 2033
- Table 42: Japan Online Electronic Repair Service Revenue (undefined) Forecast, by Application 2020 & 2033
- Table 43: South Korea Online Electronic Repair Service Revenue (undefined) Forecast, by Application 2020 & 2033
- Table 44: ASEAN Online Electronic Repair Service Revenue (undefined) Forecast, by Application 2020 & 2033
- Table 45: Oceania Online Electronic Repair Service Revenue (undefined) Forecast, by Application 2020 & 2033
- Table 46: Rest of Asia Pacific Online Electronic Repair Service Revenue (undefined) Forecast, by Application 2020 & 2033
Frequently Asked Questions
1. What is the projected Compound Annual Growth Rate (CAGR) of the Online Electronic Repair Service?
The projected CAGR is approximately 6.8%.
2. Which companies are prominent players in the Online Electronic Repair Service?
Key companies in the market include iCracked, uBreakiFix, Puls Technologies Inc., CellSavers, SquareTrade, CPR Cell Phone Repair, Batteries Plus Bulbs, Phone Medic, Geek Squad, iFixYouri, Quick Mobile Repair, iFixit, iResQ, MendMyi, Timeless Mobile Tech, Fix My Gadget, One Hour Device Repair, The Tech Know Space, Gophermods, Mission:Repair, SmartChoice Repair Center, Phone-ER, TechRestore, Jet City Device Repair, JCD Repair.
3. What are the main segments of the Online Electronic Repair Service?
The market segments include Application, Types.
4. Can you provide details about the market size?
The market size is estimated to be USD XXX N/A as of 2022.
5. What are some drivers contributing to market growth?
N/A
6. What are the notable trends driving market growth?
N/A
7. Are there any restraints impacting market growth?
N/A
8. Can you provide examples of recent developments in the market?
N/A
9. What pricing options are available for accessing the report?
Pricing options include single-user, multi-user, and enterprise licenses priced at USD 4900.00, USD 7350.00, and USD 9800.00 respectively.
10. Is the market size provided in terms of value or volume?
The market size is provided in terms of value, measured in N/A.
11. Are there any specific market keywords associated with the report?
Yes, the market keyword associated with the report is "Online Electronic Repair Service," which aids in identifying and referencing the specific market segment covered.
12. How do I determine which pricing option suits my needs best?
The pricing options vary based on user requirements and access needs. Individual users may opt for single-user licenses, while businesses requiring broader access may choose multi-user or enterprise licenses for cost-effective access to the report.
13. Are there any additional resources or data provided in the Online Electronic Repair Service report?
While the report offers comprehensive insights, it's advisable to review the specific contents or supplementary materials provided to ascertain if additional resources or data are available.
14. How can I stay updated on further developments or reports in the Online Electronic Repair Service?
To stay informed about further developments, trends, and reports in the Online Electronic Repair Service, consider subscribing to industry newsletters, following relevant companies and organizations, or regularly checking reputable industry news sources and publications.
Methodology
Step 1 - Identification of Relevant Samples Size from Population Database


Step 2 - Approaches for Defining Global Market Size (Value, Volume* & Price*)

Note*: In applicable scenarios
Step 3 - Data Sources
Primary Research
- Web Analytics
- Survey Reports
- Research Institute
- Latest Research Reports
- Opinion Leaders
Secondary Research
- Annual Reports
- White Paper
- Latest Press Release
- Industry Association
- Paid Database
- Investor Presentations

Step 4 - Data Triangulation
Involves using different sources of information in order to increase the validity of a study
These sources are likely to be stakeholders in a program - participants, other researchers, program staff, other community members, and so on.
Then we put all data in single framework & apply various statistical tools to find out the dynamic on the market.
During the analysis stage, feedback from the stakeholder groups would be compared to determine areas of agreement as well as areas of divergence