

Key Insights
The global market for Optical Based Turbidity Sensors is poised for steady expansion, projected to reach an estimated $913 million by 2025. This growth is underpinned by a healthy Compound Annual Growth Rate (CAGR) of 4.2%, indicating sustained demand across various applications. Key drivers fueling this market include the increasing stringent regulations on water quality for both industrial and potable supplies, a growing emphasis on process efficiency and quality control in manufacturing sectors like pharmaceuticals and food & beverage, and advancements in sensor technology leading to more accurate, reliable, and cost-effective solutions. The continuous need for real-time monitoring in environmental applications, such as river and wastewater management, further contributes to market momentum. Furthermore, the development of digital turbidity sensors, offering enhanced data analytics and connectivity, is expected to drive adoption and innovation.
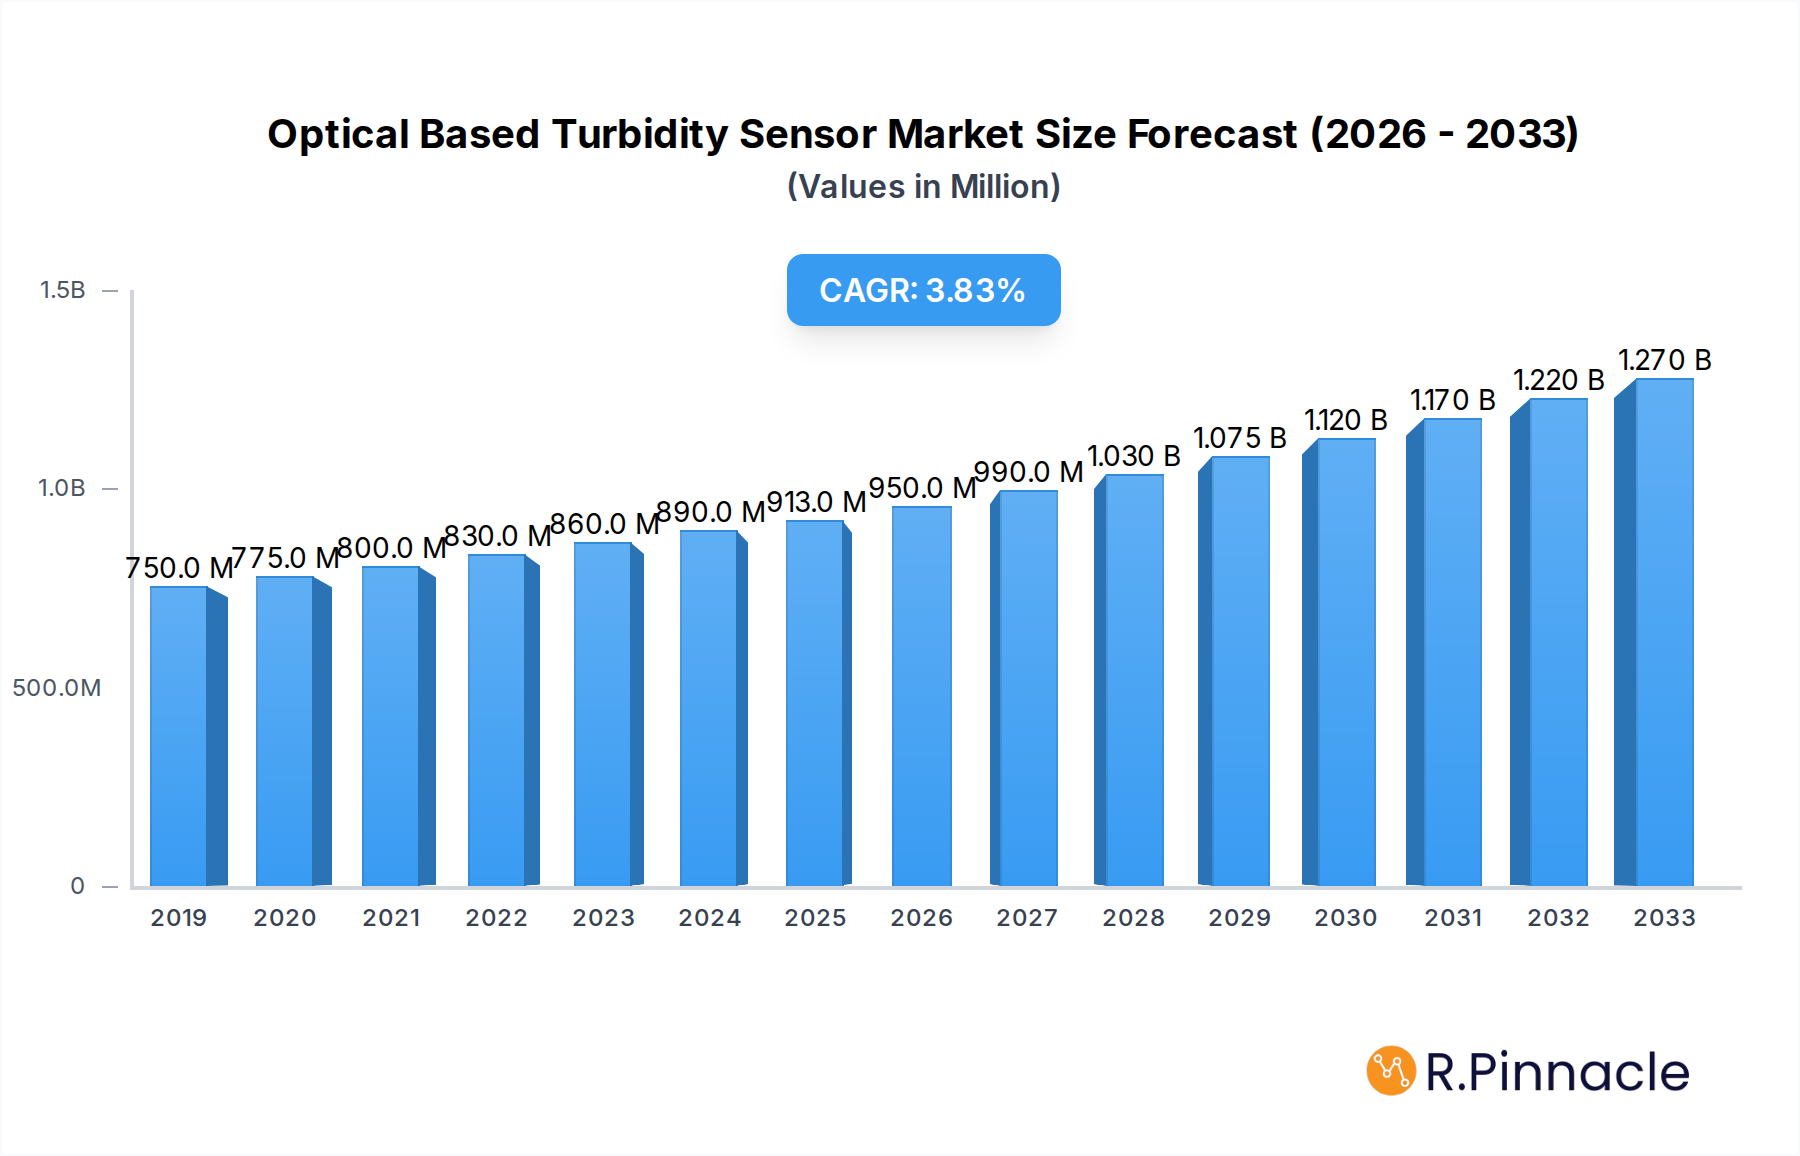
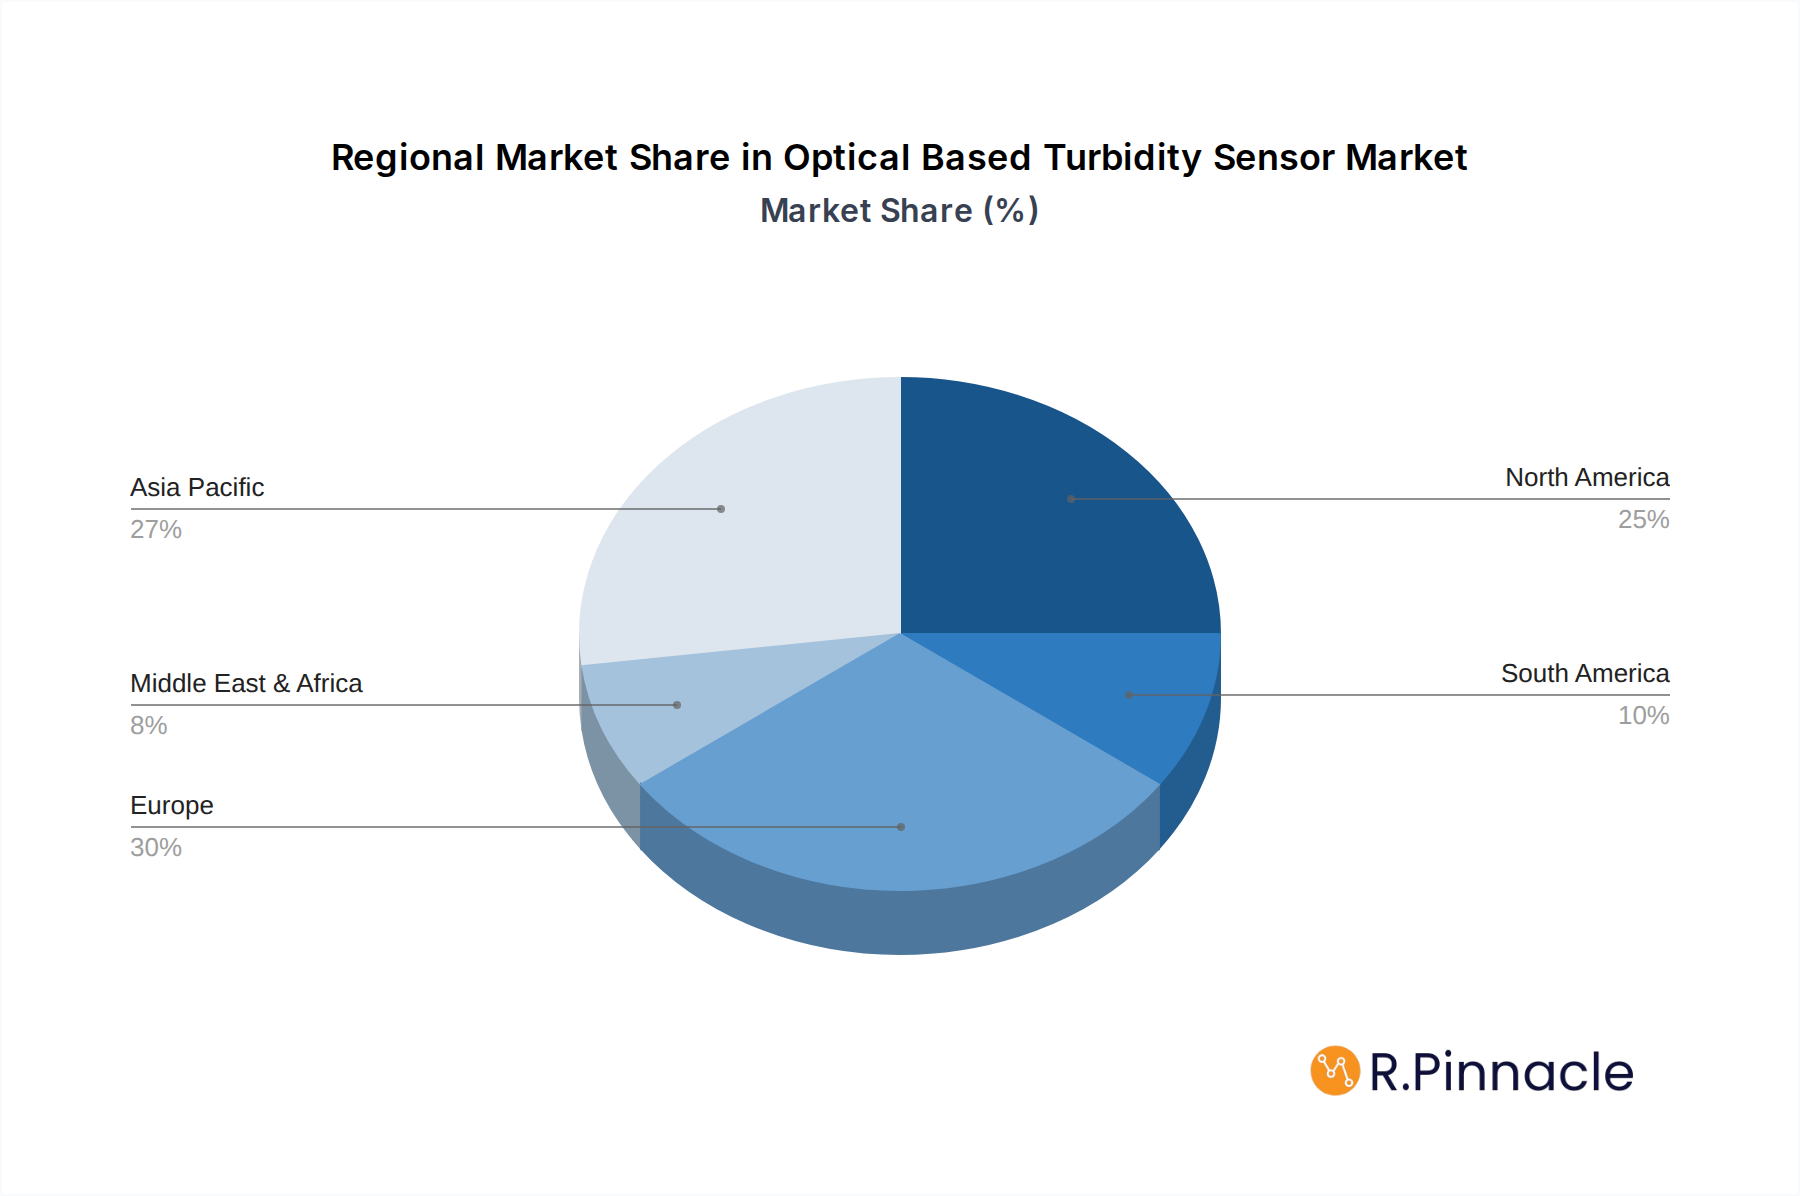
Optical Based Turbidity Sensor Market Size (In Million)
The market is segmented by application and type. In terms of application, Water Treatment stands out as a dominant segment, driven by global efforts towards sustainable water management and the need to detect and mitigate contaminants. The Chemistry and Pharmaceuticals sectors also represent significant markets, where precise turbidity measurements are crucial for product quality and process validation. The Food & Beverage industry relies on these sensors for quality assurance, from raw ingredient assessment to final product inspection. Looking at sensor types, both Analog and Digital Turbidity Sensors are integral, with digital variants gaining traction due to their superior features. Geographically, Asia Pacific is anticipated to be a rapidly growing region, fueled by rapid industrialization and increasing environmental awareness in countries like China and India. North America and Europe remain mature markets with established demand driven by strict regulatory frameworks and advanced technological adoption. Despite the positive outlook, potential restraints such as the initial high cost of sophisticated systems in certain applications and the availability of alternative, albeit less precise, measurement methods could pose challenges. However, the overall trajectory points towards a robust and expanding market for optical-based turbidity sensors.

Optical Based Turbidity Sensor Company Market Share
Optical Based Turbidity Sensor Market Research Report
This comprehensive market research report offers an in-depth analysis of the global Optical Based Turbidity Sensor market. Spanning a study period from 2019 to 2033, with a base year of 2025, this report provides critical insights into market dynamics, key trends, competitive landscape, and future projections. It is meticulously designed for industry professionals seeking actionable intelligence to inform strategic decision-making in the water treatment, chemistry, pharmaceuticals, food & beverage, and other related sectors.
Optical Based Turbidity Sensor Market Structure & Innovation Trends
The optical-based turbidity sensor market exhibits a moderately fragmented structure, characterized by the presence of both established global players and specialized regional manufacturers. Innovation is a primary driver, with continuous advancements in sensor accuracy, response time, and data logging capabilities. Regulatory frameworks, particularly concerning water quality standards and industrial process control, are significantly influencing product development and adoption. While direct product substitutes for precise turbidity measurement are limited, alternative indirect monitoring methods exist. End-user demographics are increasingly diverse, driven by stringent environmental regulations and the growing demand for real-time process monitoring across various industries. Mergers and acquisitions (M&A) activities, while not at extremely high values, are observed as companies seek to expand their product portfolios, geographical reach, and technological expertise. For instance, recent M&A deals in the broader sensor market have ranged from xx million to xx million, indicating strategic consolidation. Market share for leading optical-based turbidity sensor manufacturers is estimated to be around xx% for the top five players.
Optical Based Turbidity Sensor Market Dynamics & Trends
The optical-based turbidity sensor market is poised for significant expansion, driven by a confluence of robust growth drivers. The escalating global demand for clean water, coupled with increasingly stringent environmental regulations governing wastewater discharge and drinking water quality, forms a cornerstone of market growth. Industries such as food and beverage, pharmaceuticals, and chemical manufacturing are increasingly relying on accurate real-time turbidity monitoring for process optimization, quality control, and compliance, thereby fueling demand. Technological disruptions are at the forefront, with the integration of IoT capabilities, advanced signal processing, and miniaturization leading to more intelligent and connected turbidity sensing solutions. Consumer preferences are shifting towards highly reliable, low-maintenance, and cost-effective sensor solutions that offer seamless integration into existing control systems. Competitive dynamics are intensifying, with manufacturers focusing on product differentiation through enhanced performance, improved durability, and comprehensive customer support. The market penetration of digital turbidity sensors is expected to rise significantly due to their inherent advantages in data handling and connectivity. The Compound Annual Growth Rate (CAGR) for the optical-based turbidity sensor market is projected to be in the range of xx% to xx% over the forecast period. This sustained growth is indicative of the indispensable role these sensors play in modern industrial and environmental monitoring.
Dominant Regions & Segments in Optical Based Turbidity Sensor
The Water Treatment application segment is a dominant force in the global optical-based turbidity sensor market, driven by critical needs in municipal water purification, industrial wastewater management, and process water quality control. Economic policies favoring sustainable water resource management and significant investments in water infrastructure projects globally are key drivers underpinning this segment's dominance. Countries with large populations and developing economies are exhibiting particularly strong demand for advanced water treatment solutions.
The Digital Turbidity Sensor type segment is experiencing rapid growth and is expected to outpace its analog counterpart. This surge is attributed to the inherent advantages of digital sensors, including superior signal accuracy, enhanced data transmission capabilities, and ease of integration with digital control systems and IoT platforms. The growing adoption of smart manufacturing and Industry 4.0 initiatives further propels the demand for digital solutions.
Key Drivers of Dominance:
Water Treatment:
- Strict regulatory compliance for drinking water and wastewater discharge.
- Growing population and urbanization leading to increased water demand.
- Industrial growth necessitating efficient process water management.
- Advancements in filtration and purification technologies requiring precise monitoring.
- Government initiatives and funding for water infrastructure development.
Digital Turbidity Sensor:
- Demand for real-time data and remote monitoring capabilities.
- Integration with SCADA and IoT platforms for automated control.
- Improved accuracy and resolution compared to analog counterparts.
- Reduced susceptibility to electrical noise and signal degradation.
- Technological advancements in microprocessors and communication protocols.
Geographically, North America and Europe currently hold a significant market share due to mature industrial sectors, stringent environmental regulations, and high adoption rates of advanced technologies. However, the Asia Pacific region is emerging as a high-growth market, fueled by rapid industrialization, increasing environmental awareness, and substantial investments in water and wastewater treatment infrastructure.
Optical Based Turbidity Sensor Product Innovations
Recent product innovations in optical-based turbidity sensors are revolutionizing process monitoring. Manufacturers are focusing on enhanced accuracy, wider measurement ranges, and improved durability in harsh environments. Developments include the introduction of multi-wavelength sensors for more precise readings across varied sample types and advancements in self-cleaning technologies to minimize maintenance. Furthermore, the integration of wireless connectivity and cloud-based data analytics is enabling real-time monitoring, predictive maintenance, and remote diagnostics. These innovations offer significant competitive advantages by providing more reliable, efficient, and cost-effective solutions for a broad spectrum of applications, from ultra-pure water in pharmaceuticals to complex industrial effluents.
Report Scope & Segmentation Analysis
This report segments the Optical Based Turbidity Sensor market across key applications and sensor types.
Application Segments:
- Water Treatment: Encompassing municipal water purification, wastewater treatment, and industrial process water. This segment is projected to lead the market in terms of value, driven by global water quality initiatives. Market size is estimated at over xx million in 2025, with a projected CAGR of xx%.
- Chemistry: Including chemical processing, laboratory analysis, and research. This segment is characterized by high precision requirements. Market size estimated at xx million in 2025, with a CAGR of xx%.
- Pharmaceuticals: Critical for ensuring water purity in drug manufacturing and process control. This segment demands high accuracy and regulatory compliance. Market size estimated at xx million in 2025, with a CAGR of xx%.
- Food & Beverage: Essential for quality control in beverage production, dairy processing, and other food manufacturing applications. Market size estimated at xx million in 2025, with a CAGR of xx%.
- Others: This segment includes diverse applications such as environmental monitoring, power generation, and pulp and paper industries. Market size estimated at xx million in 2025, with a CAGR of xx%.
Type Segments:
- Analog Turbidity Sensor: Traditional sensors, offering reliability for basic applications. Market size estimated at xx million in 2025, with a CAGR of xx%.
- Digital Turbidity Sensor: Featuring advanced communication and data processing capabilities, this segment is expected to witness the highest growth. Market size estimated at xx million in 2025, with a CAGR of xx%.
Key Drivers of Optical Based Turbidity Sensor Growth
The growth of the optical-based turbidity sensor market is propelled by several key factors. Stringent global regulations demanding higher water quality standards for both potable and industrial use are a primary driver. The increasing need for real-time process monitoring and control in manufacturing industries, particularly in pharmaceuticals and food & beverage, to ensure product quality and efficiency, is significantly boosting demand. Technological advancements, such as miniaturization, improved accuracy, and the integration of IoT capabilities for data analytics and remote monitoring, are making these sensors more accessible and versatile. Furthermore, growing awareness of environmental sustainability and the need to monitor water pollution are contributing to market expansion. Investments in smart city initiatives and advanced infrastructure development are also creating new avenues for market growth.
Challenges in the Optical Based Turbidity Sensor Sector
Despite robust growth prospects, the optical-based turbidity sensor sector faces several challenges. Maintaining accuracy and reliability in highly turbid or colored water samples can be technically demanding, leading to increased calibration and maintenance needs. Competition from alternative sensing technologies, although less precise for turbidity, can exert pricing pressure. Regulatory complexities and differing standards across regions can create hurdles for global market penetration. Supply chain disruptions, particularly for specialized components, can impact production timelines and costs. Furthermore, the initial investment cost for high-end optical turbidity sensors can be a restraint for smaller enterprises or in price-sensitive markets. Cybersecurity concerns related to connected sensors also need to be addressed proactively. The market faces a constant need to balance performance with cost-effectiveness to achieve widespread adoption.
Emerging Opportunities in Optical Based Turbidity Sensor
Emerging opportunities in the optical-based turbidity sensor market are abundant, driven by technological advancements and evolving industry needs. The burgeoning IoT and Industry 4.0 landscape presents a significant opportunity for smart, connected turbidity sensors that offer advanced data analytics and predictive capabilities. The growing emphasis on real-time environmental monitoring, particularly for rivers, lakes, and oceans, opens new application areas. Advancements in micro-optics and material science are enabling the development of more robust, smaller, and energy-efficient sensors suitable for deployment in remote or challenging environments. Furthermore, the increasing adoption of optical turbidity sensors in emerging economies, as they upgrade their water treatment and industrial infrastructure, presents a substantial untapped market. The development of AI-powered sensor systems for automated anomaly detection and process optimization offers a future growth avenue.
Leading Players in the Optical Based Turbidity Sensor Market
- Aanderaa
- Endress+Hauser
- Process Instruments (PI)
- KROHNE Group
- Willow Technologies
- Mettler Toledo
- OTT HydroMet
- Optek
- Campbell Scientific
- PASCO
Key Developments in Optical Based Turbidity Sensor Industry
- 2024: Launch of next-generation digital turbidity sensors with enhanced IoT connectivity and advanced AI-driven analytics by [Company Name - Predicted Value].
- 2023/2024: Strategic partnership formed between [Company Name 1] and [Company Name 2] to integrate advanced optical sensing technology into water management solutions.
- 2023: Release of ultra-compact, low-power turbidity sensors designed for extensive deployments in environmental monitoring networks.
- 2022: Acquisition of a specialized sensor technology firm by [Company Name] to bolster its portfolio in advanced optical measurement.
- 2021: Introduction of a novel self-cleaning mechanism for optical turbidity sensors, significantly reducing maintenance requirements in industrial applications.
- 2020: Development of multi-wavelength optical turbidity sensors offering improved accuracy for a wider range of sample compositions.
Future Outlook for Optical Based Turbidity Sensor Market
The future outlook for the optical-based turbidity sensor market is exceptionally promising, driven by an increasing global imperative for clean water and efficient industrial processes. The ongoing digital transformation across industries will further accelerate the adoption of smart, connected turbidity sensors, enabling sophisticated data analysis and automation. Emerging economies will represent a significant growth frontier as they invest in upgrading their infrastructure and environmental monitoring capabilities. Continued innovation in sensor technology, focusing on enhanced accuracy, miniaturization, and cost-effectiveness, will broaden application scope and market penetration. The market is expected to witness sustained growth fueled by regulatory mandates, technological advancements, and a growing consciousness towards environmental stewardship, positioning optical-based turbidity sensors as indispensable tools for a sustainable future.
Optical Based Turbidity Sensor Segmentation
-
1. Application
- 1.1. Water Treatment
- 1.2. Chemistry
- 1.3. Pharmaceuticals
- 1.4. Food & Beverage
- 1.5. Others
-
2. Type
- 2.1. Analog Turbidity Sensor
- 2.2. Digital Turbidity Sensor
Optical Based Turbidity Sensor Segmentation By Geography
-
1. North America
- 1.1. United States
- 1.2. Canada
- 1.3. Mexico
-
2. South America
- 2.1. Brazil
- 2.2. Argentina
- 2.3. Rest of South America
-
3. Europe
- 3.1. United Kingdom
- 3.2. Germany
- 3.3. France
- 3.4. Italy
- 3.5. Spain
- 3.6. Russia
- 3.7. Benelux
- 3.8. Nordics
- 3.9. Rest of Europe
-
4. Middle East & Africa
- 4.1. Turkey
- 4.2. Israel
- 4.3. GCC
- 4.4. North Africa
- 4.5. South Africa
- 4.6. Rest of Middle East & Africa
-
5. Asia Pacific
- 5.1. China
- 5.2. India
- 5.3. Japan
- 5.4. South Korea
- 5.5. ASEAN
- 5.6. Oceania
- 5.7. Rest of Asia Pacific
Optical Based Turbidity Sensor Regional Market Share
Geographic Coverage of Optical Based Turbidity Sensor
Optical Based Turbidity Sensor REPORT HIGHLIGHTS
| Aspects | Details |
|---|---|
| Study Period | 2020-2034 |
| Base Year | 2025 |
| Estimated Year | 2026 |
| Forecast Period | 2026-2034 |
| Historical Period | 2020-2025 |
| Growth Rate | CAGR of 4.2% from 2020-2034 |
| Segmentation |
|
Table of Contents
- 1. Introduction
- 1.1. Research Scope
- 1.2. Market Segmentation
- 1.3. Research Methodology
- 1.4. Definitions and Assumptions
- 2. Executive Summary
- 2.1. Introduction
- 3. Market Dynamics
- 3.1. Introduction
- 3.2. Market Drivers
- 3.3. Market Restrains
- 3.4. Market Trends
- 4. Market Factor Analysis
- 4.1. Porters Five Forces
- 4.2. Supply/Value Chain
- 4.3. PESTEL analysis
- 4.4. Market Entropy
- 4.5. Patent/Trademark Analysis
- 5. Global Optical Based Turbidity Sensor Analysis, Insights and Forecast, 2020-2032
- 5.1. Market Analysis, Insights and Forecast - by Application
- 5.1.1. Water Treatment
- 5.1.2. Chemistry
- 5.1.3. Pharmaceuticals
- 5.1.4. Food & Beverage
- 5.1.5. Others
- 5.2. Market Analysis, Insights and Forecast - by Type
- 5.2.1. Analog Turbidity Sensor
- 5.2.2. Digital Turbidity Sensor
- 5.3. Market Analysis, Insights and Forecast - by Region
- 5.3.1. North America
- 5.3.2. South America
- 5.3.3. Europe
- 5.3.4. Middle East & Africa
- 5.3.5. Asia Pacific
- 5.1. Market Analysis, Insights and Forecast - by Application
- 6. North America Optical Based Turbidity Sensor Analysis, Insights and Forecast, 2020-2032
- 6.1. Market Analysis, Insights and Forecast - by Application
- 6.1.1. Water Treatment
- 6.1.2. Chemistry
- 6.1.3. Pharmaceuticals
- 6.1.4. Food & Beverage
- 6.1.5. Others
- 6.2. Market Analysis, Insights and Forecast - by Type
- 6.2.1. Analog Turbidity Sensor
- 6.2.2. Digital Turbidity Sensor
- 6.1. Market Analysis, Insights and Forecast - by Application
- 7. South America Optical Based Turbidity Sensor Analysis, Insights and Forecast, 2020-2032
- 7.1. Market Analysis, Insights and Forecast - by Application
- 7.1.1. Water Treatment
- 7.1.2. Chemistry
- 7.1.3. Pharmaceuticals
- 7.1.4. Food & Beverage
- 7.1.5. Others
- 7.2. Market Analysis, Insights and Forecast - by Type
- 7.2.1. Analog Turbidity Sensor
- 7.2.2. Digital Turbidity Sensor
- 7.1. Market Analysis, Insights and Forecast - by Application
- 8. Europe Optical Based Turbidity Sensor Analysis, Insights and Forecast, 2020-2032
- 8.1. Market Analysis, Insights and Forecast - by Application
- 8.1.1. Water Treatment
- 8.1.2. Chemistry
- 8.1.3. Pharmaceuticals
- 8.1.4. Food & Beverage
- 8.1.5. Others
- 8.2. Market Analysis, Insights and Forecast - by Type
- 8.2.1. Analog Turbidity Sensor
- 8.2.2. Digital Turbidity Sensor
- 8.1. Market Analysis, Insights and Forecast - by Application
- 9. Middle East & Africa Optical Based Turbidity Sensor Analysis, Insights and Forecast, 2020-2032
- 9.1. Market Analysis, Insights and Forecast - by Application
- 9.1.1. Water Treatment
- 9.1.2. Chemistry
- 9.1.3. Pharmaceuticals
- 9.1.4. Food & Beverage
- 9.1.5. Others
- 9.2. Market Analysis, Insights and Forecast - by Type
- 9.2.1. Analog Turbidity Sensor
- 9.2.2. Digital Turbidity Sensor
- 9.1. Market Analysis, Insights and Forecast - by Application
- 10. Asia Pacific Optical Based Turbidity Sensor Analysis, Insights and Forecast, 2020-2032
- 10.1. Market Analysis, Insights and Forecast - by Application
- 10.1.1. Water Treatment
- 10.1.2. Chemistry
- 10.1.3. Pharmaceuticals
- 10.1.4. Food & Beverage
- 10.1.5. Others
- 10.2. Market Analysis, Insights and Forecast - by Type
- 10.2.1. Analog Turbidity Sensor
- 10.2.2. Digital Turbidity Sensor
- 10.1. Market Analysis, Insights and Forecast - by Application
- 11. Competitive Analysis
- 11.1. Global Market Share Analysis 2025
- 11.2. Company Profiles
- 11.2.1 Aanderaa
- 11.2.1.1. Overview
- 11.2.1.2. Products
- 11.2.1.3. SWOT Analysis
- 11.2.1.4. Recent Developments
- 11.2.1.5. Financials (Based on Availability)
- 11.2.2 Endress+Hauser
- 11.2.2.1. Overview
- 11.2.2.2. Products
- 11.2.2.3. SWOT Analysis
- 11.2.2.4. Recent Developments
- 11.2.2.5. Financials (Based on Availability)
- 11.2.3 Process Instruments (PI)
- 11.2.3.1. Overview
- 11.2.3.2. Products
- 11.2.3.3. SWOT Analysis
- 11.2.3.4. Recent Developments
- 11.2.3.5. Financials (Based on Availability)
- 11.2.4 KROHNE Group
- 11.2.4.1. Overview
- 11.2.4.2. Products
- 11.2.4.3. SWOT Analysis
- 11.2.4.4. Recent Developments
- 11.2.4.5. Financials (Based on Availability)
- 11.2.5 Willow Technologies
- 11.2.5.1. Overview
- 11.2.5.2. Products
- 11.2.5.3. SWOT Analysis
- 11.2.5.4. Recent Developments
- 11.2.5.5. Financials (Based on Availability)
- 11.2.6 Mettler Toledo
- 11.2.6.1. Overview
- 11.2.6.2. Products
- 11.2.6.3. SWOT Analysis
- 11.2.6.4. Recent Developments
- 11.2.6.5. Financials (Based on Availability)
- 11.2.7 OTT HydroMet
- 11.2.7.1. Overview
- 11.2.7.2. Products
- 11.2.7.3. SWOT Analysis
- 11.2.7.4. Recent Developments
- 11.2.7.5. Financials (Based on Availability)
- 11.2.8 Optek
- 11.2.8.1. Overview
- 11.2.8.2. Products
- 11.2.8.3. SWOT Analysis
- 11.2.8.4. Recent Developments
- 11.2.8.5. Financials (Based on Availability)
- 11.2.9 Campbell Scientific
- 11.2.9.1. Overview
- 11.2.9.2. Products
- 11.2.9.3. SWOT Analysis
- 11.2.9.4. Recent Developments
- 11.2.9.5. Financials (Based on Availability)
- 11.2.10 PASCO
- 11.2.10.1. Overview
- 11.2.10.2. Products
- 11.2.10.3. SWOT Analysis
- 11.2.10.4. Recent Developments
- 11.2.10.5. Financials (Based on Availability)
- 11.2.1 Aanderaa
List of Figures
- Figure 1: Global Optical Based Turbidity Sensor Revenue Breakdown (million, %) by Region 2025 & 2033
- Figure 2: North America Optical Based Turbidity Sensor Revenue (million), by Application 2025 & 2033
- Figure 3: North America Optical Based Turbidity Sensor Revenue Share (%), by Application 2025 & 2033
- Figure 4: North America Optical Based Turbidity Sensor Revenue (million), by Type 2025 & 2033
- Figure 5: North America Optical Based Turbidity Sensor Revenue Share (%), by Type 2025 & 2033
- Figure 6: North America Optical Based Turbidity Sensor Revenue (million), by Country 2025 & 2033
- Figure 7: North America Optical Based Turbidity Sensor Revenue Share (%), by Country 2025 & 2033
- Figure 8: South America Optical Based Turbidity Sensor Revenue (million), by Application 2025 & 2033
- Figure 9: South America Optical Based Turbidity Sensor Revenue Share (%), by Application 2025 & 2033
- Figure 10: South America Optical Based Turbidity Sensor Revenue (million), by Type 2025 & 2033
- Figure 11: South America Optical Based Turbidity Sensor Revenue Share (%), by Type 2025 & 2033
- Figure 12: South America Optical Based Turbidity Sensor Revenue (million), by Country 2025 & 2033
- Figure 13: South America Optical Based Turbidity Sensor Revenue Share (%), by Country 2025 & 2033
- Figure 14: Europe Optical Based Turbidity Sensor Revenue (million), by Application 2025 & 2033
- Figure 15: Europe Optical Based Turbidity Sensor Revenue Share (%), by Application 2025 & 2033
- Figure 16: Europe Optical Based Turbidity Sensor Revenue (million), by Type 2025 & 2033
- Figure 17: Europe Optical Based Turbidity Sensor Revenue Share (%), by Type 2025 & 2033
- Figure 18: Europe Optical Based Turbidity Sensor Revenue (million), by Country 2025 & 2033
- Figure 19: Europe Optical Based Turbidity Sensor Revenue Share (%), by Country 2025 & 2033
- Figure 20: Middle East & Africa Optical Based Turbidity Sensor Revenue (million), by Application 2025 & 2033
- Figure 21: Middle East & Africa Optical Based Turbidity Sensor Revenue Share (%), by Application 2025 & 2033
- Figure 22: Middle East & Africa Optical Based Turbidity Sensor Revenue (million), by Type 2025 & 2033
- Figure 23: Middle East & Africa Optical Based Turbidity Sensor Revenue Share (%), by Type 2025 & 2033
- Figure 24: Middle East & Africa Optical Based Turbidity Sensor Revenue (million), by Country 2025 & 2033
- Figure 25: Middle East & Africa Optical Based Turbidity Sensor Revenue Share (%), by Country 2025 & 2033
- Figure 26: Asia Pacific Optical Based Turbidity Sensor Revenue (million), by Application 2025 & 2033
- Figure 27: Asia Pacific Optical Based Turbidity Sensor Revenue Share (%), by Application 2025 & 2033
- Figure 28: Asia Pacific Optical Based Turbidity Sensor Revenue (million), by Type 2025 & 2033
- Figure 29: Asia Pacific Optical Based Turbidity Sensor Revenue Share (%), by Type 2025 & 2033
- Figure 30: Asia Pacific Optical Based Turbidity Sensor Revenue (million), by Country 2025 & 2033
- Figure 31: Asia Pacific Optical Based Turbidity Sensor Revenue Share (%), by Country 2025 & 2033
List of Tables
- Table 1: Global Optical Based Turbidity Sensor Revenue million Forecast, by Application 2020 & 2033
- Table 2: Global Optical Based Turbidity Sensor Revenue million Forecast, by Type 2020 & 2033
- Table 3: Global Optical Based Turbidity Sensor Revenue million Forecast, by Region 2020 & 2033
- Table 4: Global Optical Based Turbidity Sensor Revenue million Forecast, by Application 2020 & 2033
- Table 5: Global Optical Based Turbidity Sensor Revenue million Forecast, by Type 2020 & 2033
- Table 6: Global Optical Based Turbidity Sensor Revenue million Forecast, by Country 2020 & 2033
- Table 7: United States Optical Based Turbidity Sensor Revenue (million) Forecast, by Application 2020 & 2033
- Table 8: Canada Optical Based Turbidity Sensor Revenue (million) Forecast, by Application 2020 & 2033
- Table 9: Mexico Optical Based Turbidity Sensor Revenue (million) Forecast, by Application 2020 & 2033
- Table 10: Global Optical Based Turbidity Sensor Revenue million Forecast, by Application 2020 & 2033
- Table 11: Global Optical Based Turbidity Sensor Revenue million Forecast, by Type 2020 & 2033
- Table 12: Global Optical Based Turbidity Sensor Revenue million Forecast, by Country 2020 & 2033
- Table 13: Brazil Optical Based Turbidity Sensor Revenue (million) Forecast, by Application 2020 & 2033
- Table 14: Argentina Optical Based Turbidity Sensor Revenue (million) Forecast, by Application 2020 & 2033
- Table 15: Rest of South America Optical Based Turbidity Sensor Revenue (million) Forecast, by Application 2020 & 2033
- Table 16: Global Optical Based Turbidity Sensor Revenue million Forecast, by Application 2020 & 2033
- Table 17: Global Optical Based Turbidity Sensor Revenue million Forecast, by Type 2020 & 2033
- Table 18: Global Optical Based Turbidity Sensor Revenue million Forecast, by Country 2020 & 2033
- Table 19: United Kingdom Optical Based Turbidity Sensor Revenue (million) Forecast, by Application 2020 & 2033
- Table 20: Germany Optical Based Turbidity Sensor Revenue (million) Forecast, by Application 2020 & 2033
- Table 21: France Optical Based Turbidity Sensor Revenue (million) Forecast, by Application 2020 & 2033
- Table 22: Italy Optical Based Turbidity Sensor Revenue (million) Forecast, by Application 2020 & 2033
- Table 23: Spain Optical Based Turbidity Sensor Revenue (million) Forecast, by Application 2020 & 2033
- Table 24: Russia Optical Based Turbidity Sensor Revenue (million) Forecast, by Application 2020 & 2033
- Table 25: Benelux Optical Based Turbidity Sensor Revenue (million) Forecast, by Application 2020 & 2033
- Table 26: Nordics Optical Based Turbidity Sensor Revenue (million) Forecast, by Application 2020 & 2033
- Table 27: Rest of Europe Optical Based Turbidity Sensor Revenue (million) Forecast, by Application 2020 & 2033
- Table 28: Global Optical Based Turbidity Sensor Revenue million Forecast, by Application 2020 & 2033
- Table 29: Global Optical Based Turbidity Sensor Revenue million Forecast, by Type 2020 & 2033
- Table 30: Global Optical Based Turbidity Sensor Revenue million Forecast, by Country 2020 & 2033
- Table 31: Turkey Optical Based Turbidity Sensor Revenue (million) Forecast, by Application 2020 & 2033
- Table 32: Israel Optical Based Turbidity Sensor Revenue (million) Forecast, by Application 2020 & 2033
- Table 33: GCC Optical Based Turbidity Sensor Revenue (million) Forecast, by Application 2020 & 2033
- Table 34: North Africa Optical Based Turbidity Sensor Revenue (million) Forecast, by Application 2020 & 2033
- Table 35: South Africa Optical Based Turbidity Sensor Revenue (million) Forecast, by Application 2020 & 2033
- Table 36: Rest of Middle East & Africa Optical Based Turbidity Sensor Revenue (million) Forecast, by Application 2020 & 2033
- Table 37: Global Optical Based Turbidity Sensor Revenue million Forecast, by Application 2020 & 2033
- Table 38: Global Optical Based Turbidity Sensor Revenue million Forecast, by Type 2020 & 2033
- Table 39: Global Optical Based Turbidity Sensor Revenue million Forecast, by Country 2020 & 2033
- Table 40: China Optical Based Turbidity Sensor Revenue (million) Forecast, by Application 2020 & 2033
- Table 41: India Optical Based Turbidity Sensor Revenue (million) Forecast, by Application 2020 & 2033
- Table 42: Japan Optical Based Turbidity Sensor Revenue (million) Forecast, by Application 2020 & 2033
- Table 43: South Korea Optical Based Turbidity Sensor Revenue (million) Forecast, by Application 2020 & 2033
- Table 44: ASEAN Optical Based Turbidity Sensor Revenue (million) Forecast, by Application 2020 & 2033
- Table 45: Oceania Optical Based Turbidity Sensor Revenue (million) Forecast, by Application 2020 & 2033
- Table 46: Rest of Asia Pacific Optical Based Turbidity Sensor Revenue (million) Forecast, by Application 2020 & 2033
Frequently Asked Questions
1. What is the projected Compound Annual Growth Rate (CAGR) of the Optical Based Turbidity Sensor?
The projected CAGR is approximately 4.2%.
2. Which companies are prominent players in the Optical Based Turbidity Sensor?
Key companies in the market include Aanderaa, Endress+Hauser, Process Instruments (PI), KROHNE Group, Willow Technologies, Mettler Toledo, OTT HydroMet, Optek, Campbell Scientific, PASCO.
3. What are the main segments of the Optical Based Turbidity Sensor?
The market segments include Application, Type.
4. Can you provide details about the market size?
The market size is estimated to be USD 913 million as of 2022.
5. What are some drivers contributing to market growth?
N/A
6. What are the notable trends driving market growth?
N/A
7. Are there any restraints impacting market growth?
N/A
8. Can you provide examples of recent developments in the market?
N/A
9. What pricing options are available for accessing the report?
Pricing options include single-user, multi-user, and enterprise licenses priced at USD 4250.00, USD 6375.00, and USD 8500.00 respectively.
10. Is the market size provided in terms of value or volume?
The market size is provided in terms of value, measured in million.
11. Are there any specific market keywords associated with the report?
Yes, the market keyword associated with the report is "Optical Based Turbidity Sensor," which aids in identifying and referencing the specific market segment covered.
12. How do I determine which pricing option suits my needs best?
The pricing options vary based on user requirements and access needs. Individual users may opt for single-user licenses, while businesses requiring broader access may choose multi-user or enterprise licenses for cost-effective access to the report.
13. Are there any additional resources or data provided in the Optical Based Turbidity Sensor report?
While the report offers comprehensive insights, it's advisable to review the specific contents or supplementary materials provided to ascertain if additional resources or data are available.
14. How can I stay updated on further developments or reports in the Optical Based Turbidity Sensor?
To stay informed about further developments, trends, and reports in the Optical Based Turbidity Sensor, consider subscribing to industry newsletters, following relevant companies and organizations, or regularly checking reputable industry news sources and publications.
Methodology
Step 1 - Identification of Relevant Samples Size from Population Database


Step 2 - Approaches for Defining Global Market Size (Value, Volume* & Price*)

Note*: In applicable scenarios
Step 3 - Data Sources
Primary Research
- Web Analytics
- Survey Reports
- Research Institute
- Latest Research Reports
- Opinion Leaders
Secondary Research
- Annual Reports
- White Paper
- Latest Press Release
- Industry Association
- Paid Database
- Investor Presentations

Step 4 - Data Triangulation
Involves using different sources of information in order to increase the validity of a study
These sources are likely to be stakeholders in a program - participants, other researchers, program staff, other community members, and so on.
Then we put all data in single framework & apply various statistical tools to find out the dynamic on the market.
During the analysis stage, feedback from the stakeholder groups would be compared to determine areas of agreement as well as areas of divergence