
Key Insights
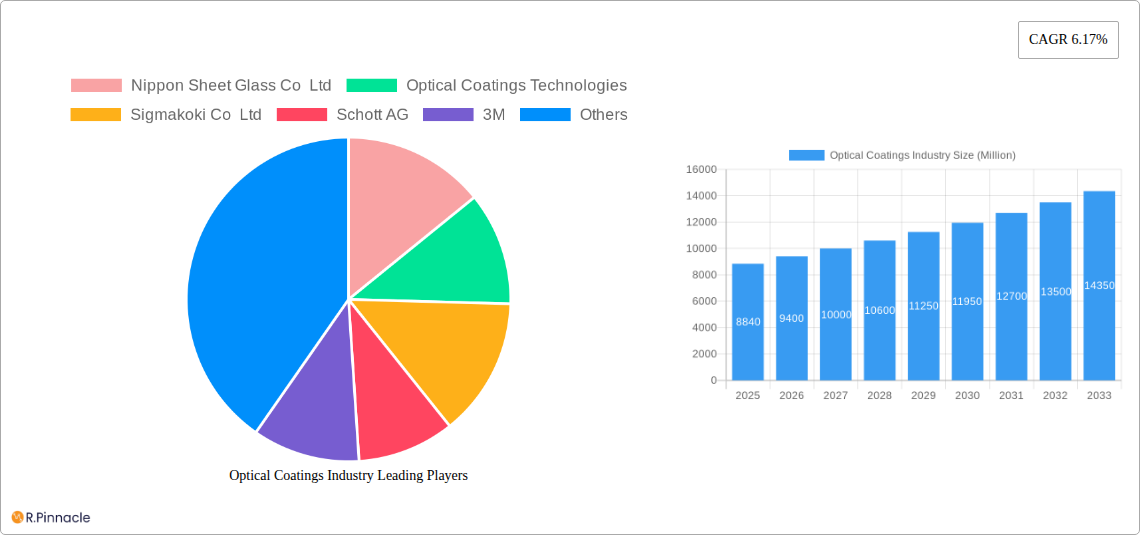
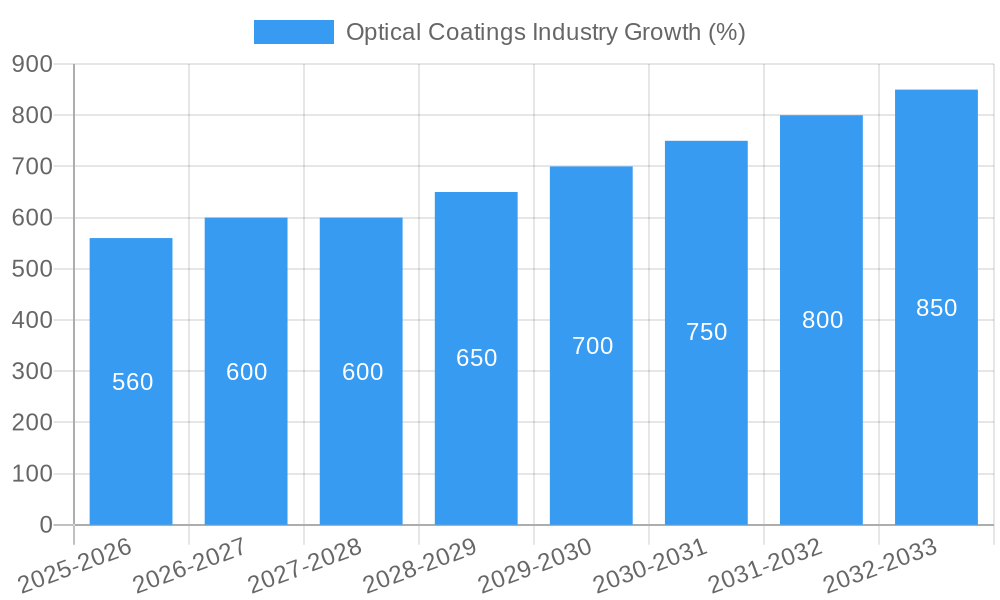
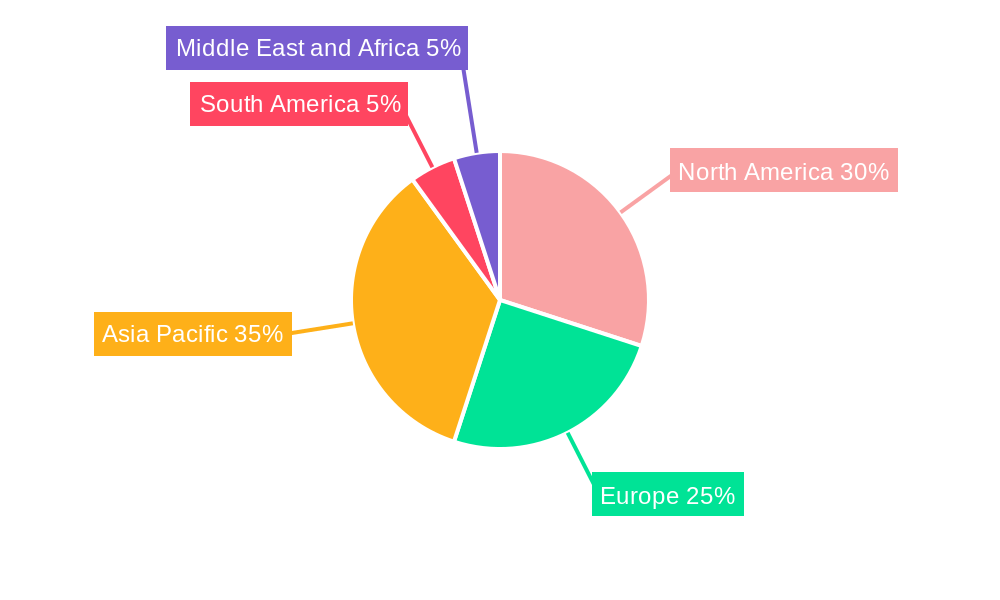
The global optical coatings market, valued at $8.84 billion in 2025, is projected to experience robust growth, driven by a compound annual growth rate (CAGR) of 6.17% from 2025 to 2033. This expansion is fueled by several key factors. The increasing demand for advanced optical components in diverse sectors like electronics, telecommunications, and automotive is a primary driver. The miniaturization of electronic devices and the growing adoption of 5G technology necessitate high-performance optical coatings, thereby boosting market growth. Furthermore, advancements in coating technologies, such as atomic layer deposition and sub-wavelength structured surfaces, are enabling the creation of more efficient and durable coatings, further propelling market expansion. Significant investments in research and development across various end-user industries are also contributing to the market's growth trajectory. The Asia-Pacific region, particularly China and India, is expected to be a key growth engine, driven by rapid industrialization and increasing technological adoption.
The market segmentation reveals significant opportunities across different product types, technologies, and end-user industries. Anti-reflective coatings are currently dominant, given their widespread use in displays and optical instruments. However, segments like transparent conductive coatings and mirror coatings (high reflective) are expected to witness substantial growth due to rising demand in solar energy and advanced optical systems. Similarly, the chemical vapor deposition (CVD) technology currently holds a major market share, but ion-beam sputtering and atomic layer deposition are gaining traction due to their ability to produce high-quality, customized coatings. The aerospace and defense sector represents a significant end-user industry, given the stringent requirements for optical components in these applications. However, the electronics and semiconductors industry is expected to show substantial growth due to the expanding use of optical coatings in various devices and components. Competitive dynamics within the market are intense, with several established players and emerging companies vying for market share through innovation and strategic partnerships.
Optical Coatings Industry Market Report: 2019-2033
This comprehensive report provides an in-depth analysis of the Optical Coatings Industry, offering valuable insights for industry professionals, investors, and strategic decision-makers. With a focus on market size, growth drivers, and competitive dynamics, this report covers the period from 2019 to 2033, with a base year of 2025. The report projects a market value exceeding $XX Million by 2033, showcasing significant growth potential.
Optical Coatings Industry Market Structure & Innovation Trends
The optical coatings market is moderately fragmented, with several key players vying for market share. Leading companies include Nippon Sheet Glass Co Ltd, Optical Coatings Technologies, Sigmakoki Co Ltd, Schott AG, 3M, PPG Industries Inc, Quantum Coating, Zeiss International, Edmund Optics Inc, DuPont, Inrad Optics, Artemis Optical Ltd, Accucoat Inc, Materion Corporation, Abrisa Technologies, Reynard Corporation, Newport Corporation, and Zygo Corporation. While precise market share data for each player is proprietary, 3M, Schott AG, and Zeiss International are estimated to hold significant portions of the overall market. Innovation is driven by advancements in materials science, deposition technologies, and the growing demand for high-performance optical components across various sectors.
- Market Concentration: Moderately fragmented, with a few dominant players.
- Innovation Drivers: Advancements in materials science, deposition techniques, and increasing demand for specialized coatings.
- Regulatory Frameworks: Vary by region, influencing material usage and manufacturing processes. Compliance with environmental regulations is a key factor.
- Product Substitutes: Limited, due to the specialized nature of optical coatings and their performance characteristics.
- End-User Demographics: Diverse, spanning aerospace, electronics, telecommunications, healthcare, solar, and automotive industries.
- M&A Activities: The industry has witnessed several mergers and acquisitions in recent years, with deal values ranging from $XX Million to $XX Million. These transactions reflect strategic consolidation and expansion into new markets. The Carl Zeiss Meditec acquisition of Kogent Surgical and Katalyst Surgical is a prime example of this activity.
Optical Coatings Industry Market Dynamics & Trends
The optical coatings market exhibits robust growth, propelled by several key factors. Technological advancements, particularly in areas like atomic layer deposition and sub-wavelength structured surfaces, are driving the development of superior coatings with enhanced performance characteristics. Increased demand from various end-user industries, including electronics, automotive, and healthcare, further fuels market expansion. Consumer preferences for high-quality, energy-efficient products are also influencing market trends. The market is expected to register a CAGR of XX% during the forecast period (2025-2033), with market penetration increasing significantly in emerging economies. Competitive dynamics involve constant innovation, strategic partnerships, and efforts to optimize manufacturing processes.
Dominant Regions & Segments in Optical Coatings Industry
The North American and European regions currently hold significant market share, driven by strong demand from the aerospace, defense, and electronics sectors. Asia-Pacific is experiencing rapid growth, fueled by expanding electronics and telecommunications industries.
Dominant Segments:
- Product Type: Anti-reflective coatings hold a substantial share, followed by optical filter coatings. The demand for high-reflective mirror coatings is also increasing rapidly.
- Technology: Ion-beam sputtering and plasma sputtering currently dominate, but atomic layer deposition is gaining traction due to its precision and versatility.
- End-user Industry: The electronics and semiconductors sector is the largest consumer of optical coatings, followed by the automotive and aerospace & defense industries.
Key Drivers by Region:
- North America: Strong government investment in aerospace and defense, coupled with technological advancements.
- Europe: High concentration of key players and robust R&D activities.
- Asia-Pacific: Rapid industrialization, expanding electronics manufacturing, and increasing government support for renewable energy.
Optical Coatings Industry Product Innovations
Recent innovations focus on enhancing coating durability, scratch resistance, and performance under extreme conditions. Sub-wavelength structured surfaces are gaining prominence for their superior anti-reflective properties. Manufacturers are constantly developing new coating materials and deposition techniques to meet diverse application requirements. This focus on enhanced performance and broader applications ensures a strong market fit for newly developed products.
Report Scope & Segmentation Analysis
This report comprehensively analyzes the optical coatings market across various segments, including product type (optical filter coatings, anti-reflective coatings, transparent conductive coatings, mirror coatings, beam splitter coatings, and others), technology (chemical vapor deposition, ion-beam sputtering, plasma sputtering, atomic layer deposition, sub-wavelength structured surfaces), and end-user industry (aerospace & defense, electronics & semiconductors, telecommunications, healthcare, solar, automotive, and others). Each segment is assessed in terms of market size, growth projections, and competitive dynamics, providing a detailed understanding of the market landscape. For instance, the anti-reflective coatings segment is expected to witness robust growth driven by its use in various applications, while atomic layer deposition is expected to gain popularity due to its advanced capabilities.
Key Drivers of Optical Coatings Industry Growth
Technological advancements in coating materials and deposition techniques are major growth catalysts. Increasing demand from the electronics, automotive, and renewable energy sectors is another significant factor. Favorable government policies promoting energy efficiency and technological innovation are also boosting market growth. The ongoing miniaturization of electronic devices is another key driver, necessitating advanced optical coatings.
Challenges in the Optical Coatings Industry Sector
Supply chain disruptions and fluctuations in raw material prices pose significant challenges. Stringent environmental regulations also present hurdles for manufacturers. Intense competition from existing and new entrants necessitates constant innovation and cost optimization strategies. The industry may also face difficulties in finding skilled workforce with expertise in complex deposition techniques.
Emerging Opportunities in Optical Coatings Industry
Emerging applications in augmented reality (AR) and virtual reality (VR) devices represent significant opportunities. The growing demand for energy-efficient solar cells and automotive lighting systems is creating further market openings. Advancements in flexible and wearable electronics are also driving innovation in this sector.
Leading Players in the Optical Coatings Industry Market
- Nippon Sheet Glass Co Ltd
- Optical Coatings Technologies
- Sigmakoki Co Ltd
- Schott AG
- 3M
- PPG Industries Inc
- Quantum Coating
- Zeiss International
- Edmund Optics Inc
- DuPont
- Inrad Optics
- Artemis Optical Ltd
- Accucoat Inc
- Materion Corporation
- Abrisa Technologies
- Reynard Corporation
- Newport Corporation
- Zygo Corporation
- *List Not Exhaustive
Key Developments in Optical Coatings Industry Industry
- April 2022: Imatest partnered with Edmund Optics Inc., enabling seamless software and chart purchases.
- April 2022: Edmund Optics Inc. opened a new facility in New Jersey, expanding its capabilities.
- April 2022: Carl Zeiss Meditec acquired Kogent Surgical and Katalyst Surgical, strengthening its surgical solutions portfolio.
Future Outlook for Optical Coatings Industry Market
The optical coatings market is poised for continued growth, driven by technological innovation, expanding applications, and increasing demand from diverse end-user industries. Strategic partnerships, mergers and acquisitions, and a focus on developing sustainable and high-performance coatings will further shape market dynamics. The market's future outlook is positive, with considerable potential for growth and expansion in the coming years.
Optical Coatings Industry Segmentation
-
1. Product Type
- 1.1. Optical Filter Coatings
- 1.2. Anti-reflective Coatings
- 1.3. Transparent Conductive Coatings
- 1.4. Mirror Coatings (High Reflective)
- 1.5. Beam Splitter Coatings
- 1.6. Other Pr
-
2. Technology
- 2.1. Chemical Vapor Deposition
- 2.2. Ion-beam Sputtering
- 2.3. Plasma Sputtering
- 2.4. Atomic Layer Deposition
- 2.5. Sub-wavelength Structured Surfaces
-
3. End-user Industry
- 3.1. Aerospace and Defense
- 3.2. Electronics and Semiconductors
- 3.3. Telecommunications
- 3.4. Healthcare
- 3.5. Solar
- 3.6. Automotive
- 3.7. Other En
Optical Coatings Industry Segmentation By Geography
-
1. Asia Pacific
- 1.1. China
- 1.2. India
- 1.3. Japan
- 1.4. South Korea
- 1.5. Malaysia
- 1.6. Thailand
- 1.7. Indonesia
- 1.8. Vietnam
- 1.9. Rest of Asia Pacific
-
2. North America
- 2.1. United States
- 2.2. Canada
- 2.3. Mexico
-
3. Europe
- 3.1. Germany
- 3.2. United Kingdom
- 3.3. Italy
- 3.4. France
- 3.5. Spain
- 3.6. Nordic Countries
- 3.7. Turkey
- 3.8. Russia
- 3.9. Rest of Europe
-
4. South America
- 4.1. Brazil
- 4.2. Argentina
- 4.3. Colombia
- 4.4. Rest of South America
-
5. Middle East and Africa
- 5.1. Saudi Arabia
- 5.2. South Africa
- 5.3. Qatar
- 5.4. United Arab Emirates
- 5.5. Nigeria
- 5.6. Egypt
- 5.7. Rest of Middle East and Africa
Optical Coatings Industry REPORT HIGHLIGHTS
| Aspects | Details |
|---|---|
| Study Period | 2019-2033 |
| Base Year | 2024 |
| Estimated Year | 2025 |
| Forecast Period | 2025-2033 |
| Historical Period | 2019-2024 |
| Growth Rate | CAGR of 6.17% from 2019-2033 |
| Segmentation |
|
Table of Contents
- 1. Introduction
- 1.1. Research Scope
- 1.2. Market Segmentation
- 1.3. Research Methodology
- 1.4. Definitions and Assumptions
- 2. Executive Summary
- 2.1. Introduction
- 3. Market Dynamics
- 3.1. Introduction
- 3.2. Market Drivers
- 3.2.1. Growing Demand from the Solar Industry; Technological Advancements in the Optical Coatings Process
- 3.3. Market Restrains
- 3.3.1. High Costs and Some Limiting Properties of Optical Coatings
- 3.4. Market Trends
- 3.4.1. The Electronics and Semiconductors Segment is Expected to Dominate the Market
- 4. Market Factor Analysis
- 4.1. Porters Five Forces
- 4.2. Supply/Value Chain
- 4.3. PESTEL analysis
- 4.4. Market Entropy
- 4.5. Patent/Trademark Analysis
- 5. Global Optical Coatings Industry Analysis, Insights and Forecast, 2019-2031
- 5.1. Market Analysis, Insights and Forecast - by Product Type
- 5.1.1. Optical Filter Coatings
- 5.1.2. Anti-reflective Coatings
- 5.1.3. Transparent Conductive Coatings
- 5.1.4. Mirror Coatings (High Reflective)
- 5.1.5. Beam Splitter Coatings
- 5.1.6. Other Pr
- 5.2. Market Analysis, Insights and Forecast - by Technology
- 5.2.1. Chemical Vapor Deposition
- 5.2.2. Ion-beam Sputtering
- 5.2.3. Plasma Sputtering
- 5.2.4. Atomic Layer Deposition
- 5.2.5. Sub-wavelength Structured Surfaces
- 5.3. Market Analysis, Insights and Forecast - by End-user Industry
- 5.3.1. Aerospace and Defense
- 5.3.2. Electronics and Semiconductors
- 5.3.3. Telecommunications
- 5.3.4. Healthcare
- 5.3.5. Solar
- 5.3.6. Automotive
- 5.3.7. Other En
- 5.4. Market Analysis, Insights and Forecast - by Region
- 5.4.1. Asia Pacific
- 5.4.2. North America
- 5.4.3. Europe
- 5.4.4. South America
- 5.4.5. Middle East and Africa
- 5.1. Market Analysis, Insights and Forecast - by Product Type
- 6. Asia Pacific Optical Coatings Industry Analysis, Insights and Forecast, 2019-2031
- 6.1. Market Analysis, Insights and Forecast - by Product Type
- 6.1.1. Optical Filter Coatings
- 6.1.2. Anti-reflective Coatings
- 6.1.3. Transparent Conductive Coatings
- 6.1.4. Mirror Coatings (High Reflective)
- 6.1.5. Beam Splitter Coatings
- 6.1.6. Other Pr
- 6.2. Market Analysis, Insights and Forecast - by Technology
- 6.2.1. Chemical Vapor Deposition
- 6.2.2. Ion-beam Sputtering
- 6.2.3. Plasma Sputtering
- 6.2.4. Atomic Layer Deposition
- 6.2.5. Sub-wavelength Structured Surfaces
- 6.3. Market Analysis, Insights and Forecast - by End-user Industry
- 6.3.1. Aerospace and Defense
- 6.3.2. Electronics and Semiconductors
- 6.3.3. Telecommunications
- 6.3.4. Healthcare
- 6.3.5. Solar
- 6.3.6. Automotive
- 6.3.7. Other En
- 6.1. Market Analysis, Insights and Forecast - by Product Type
- 7. North America Optical Coatings Industry Analysis, Insights and Forecast, 2019-2031
- 7.1. Market Analysis, Insights and Forecast - by Product Type
- 7.1.1. Optical Filter Coatings
- 7.1.2. Anti-reflective Coatings
- 7.1.3. Transparent Conductive Coatings
- 7.1.4. Mirror Coatings (High Reflective)
- 7.1.5. Beam Splitter Coatings
- 7.1.6. Other Pr
- 7.2. Market Analysis, Insights and Forecast - by Technology
- 7.2.1. Chemical Vapor Deposition
- 7.2.2. Ion-beam Sputtering
- 7.2.3. Plasma Sputtering
- 7.2.4. Atomic Layer Deposition
- 7.2.5. Sub-wavelength Structured Surfaces
- 7.3. Market Analysis, Insights and Forecast - by End-user Industry
- 7.3.1. Aerospace and Defense
- 7.3.2. Electronics and Semiconductors
- 7.3.3. Telecommunications
- 7.3.4. Healthcare
- 7.3.5. Solar
- 7.3.6. Automotive
- 7.3.7. Other En
- 7.1. Market Analysis, Insights and Forecast - by Product Type
- 8. Europe Optical Coatings Industry Analysis, Insights and Forecast, 2019-2031
- 8.1. Market Analysis, Insights and Forecast - by Product Type
- 8.1.1. Optical Filter Coatings
- 8.1.2. Anti-reflective Coatings
- 8.1.3. Transparent Conductive Coatings
- 8.1.4. Mirror Coatings (High Reflective)
- 8.1.5. Beam Splitter Coatings
- 8.1.6. Other Pr
- 8.2. Market Analysis, Insights and Forecast - by Technology
- 8.2.1. Chemical Vapor Deposition
- 8.2.2. Ion-beam Sputtering
- 8.2.3. Plasma Sputtering
- 8.2.4. Atomic Layer Deposition
- 8.2.5. Sub-wavelength Structured Surfaces
- 8.3. Market Analysis, Insights and Forecast - by End-user Industry
- 8.3.1. Aerospace and Defense
- 8.3.2. Electronics and Semiconductors
- 8.3.3. Telecommunications
- 8.3.4. Healthcare
- 8.3.5. Solar
- 8.3.6. Automotive
- 8.3.7. Other En
- 8.1. Market Analysis, Insights and Forecast - by Product Type
- 9. South America Optical Coatings Industry Analysis, Insights and Forecast, 2019-2031
- 9.1. Market Analysis, Insights and Forecast - by Product Type
- 9.1.1. Optical Filter Coatings
- 9.1.2. Anti-reflective Coatings
- 9.1.3. Transparent Conductive Coatings
- 9.1.4. Mirror Coatings (High Reflective)
- 9.1.5. Beam Splitter Coatings
- 9.1.6. Other Pr
- 9.2. Market Analysis, Insights and Forecast - by Technology
- 9.2.1. Chemical Vapor Deposition
- 9.2.2. Ion-beam Sputtering
- 9.2.3. Plasma Sputtering
- 9.2.4. Atomic Layer Deposition
- 9.2.5. Sub-wavelength Structured Surfaces
- 9.3. Market Analysis, Insights and Forecast - by End-user Industry
- 9.3.1. Aerospace and Defense
- 9.3.2. Electronics and Semiconductors
- 9.3.3. Telecommunications
- 9.3.4. Healthcare
- 9.3.5. Solar
- 9.3.6. Automotive
- 9.3.7. Other En
- 9.1. Market Analysis, Insights and Forecast - by Product Type
- 10. Middle East and Africa Optical Coatings Industry Analysis, Insights and Forecast, 2019-2031
- 10.1. Market Analysis, Insights and Forecast - by Product Type
- 10.1.1. Optical Filter Coatings
- 10.1.2. Anti-reflective Coatings
- 10.1.3. Transparent Conductive Coatings
- 10.1.4. Mirror Coatings (High Reflective)
- 10.1.5. Beam Splitter Coatings
- 10.1.6. Other Pr
- 10.2. Market Analysis, Insights and Forecast - by Technology
- 10.2.1. Chemical Vapor Deposition
- 10.2.2. Ion-beam Sputtering
- 10.2.3. Plasma Sputtering
- 10.2.4. Atomic Layer Deposition
- 10.2.5. Sub-wavelength Structured Surfaces
- 10.3. Market Analysis, Insights and Forecast - by End-user Industry
- 10.3.1. Aerospace and Defense
- 10.3.2. Electronics and Semiconductors
- 10.3.3. Telecommunications
- 10.3.4. Healthcare
- 10.3.5. Solar
- 10.3.6. Automotive
- 10.3.7. Other En
- 10.1. Market Analysis, Insights and Forecast - by Product Type
- 11. Asia Pacific Optical Coatings Industry Analysis, Insights and Forecast, 2019-2031
- 11.1. Market Analysis, Insights and Forecast - By Country/Sub-region
- 11.1.1 China
- 11.1.2 India
- 11.1.3 Japan
- 11.1.4 South Korea
- 11.1.5 Rest of Asia Pacific
- 12. North America Optical Coatings Industry Analysis, Insights and Forecast, 2019-2031
- 12.1. Market Analysis, Insights and Forecast - By Country/Sub-region
- 12.1.1 United States
- 12.1.2 Canada
- 12.1.3 Mexico
- 13. Europe Optical Coatings Industry Analysis, Insights and Forecast, 2019-2031
- 13.1. Market Analysis, Insights and Forecast - By Country/Sub-region
- 13.1.1 Germany
- 13.1.2 United Kingdom
- 13.1.3 Italy
- 13.1.4 France
- 13.1.5 Rest of Europe
- 14. South America Optical Coatings Industry Analysis, Insights and Forecast, 2019-2031
- 14.1. Market Analysis, Insights and Forecast - By Country/Sub-region
- 14.1.1 Brazil
- 14.1.2 Argentina
- 14.1.3 Rest of South America
- 15. Middle East and Africa Optical Coatings Industry Analysis, Insights and Forecast, 2019-2031
- 15.1. Market Analysis, Insights and Forecast - By Country/Sub-region
- 15.1.1 Saudi Arabia
- 15.1.2 South Africa
- 15.1.3 Rest of Middle East and Africa
- 16. Competitive Analysis
- 16.1. Global Market Share Analysis 2024
- 16.2. Company Profiles
- 16.2.1 Nippon Sheet Glass Co Ltd
- 16.2.1.1. Overview
- 16.2.1.2. Products
- 16.2.1.3. SWOT Analysis
- 16.2.1.4. Recent Developments
- 16.2.1.5. Financials (Based on Availability)
- 16.2.2 Optical Coatings Technologies
- 16.2.2.1. Overview
- 16.2.2.2. Products
- 16.2.2.3. SWOT Analysis
- 16.2.2.4. Recent Developments
- 16.2.2.5. Financials (Based on Availability)
- 16.2.3 Sigmakoki Co Ltd
- 16.2.3.1. Overview
- 16.2.3.2. Products
- 16.2.3.3. SWOT Analysis
- 16.2.3.4. Recent Developments
- 16.2.3.5. Financials (Based on Availability)
- 16.2.4 Schott AG
- 16.2.4.1. Overview
- 16.2.4.2. Products
- 16.2.4.3. SWOT Analysis
- 16.2.4.4. Recent Developments
- 16.2.4.5. Financials (Based on Availability)
- 16.2.5 3M
- 16.2.5.1. Overview
- 16.2.5.2. Products
- 16.2.5.3. SWOT Analysis
- 16.2.5.4. Recent Developments
- 16.2.5.5. Financials (Based on Availability)
- 16.2.6 PPG Industries Inc
- 16.2.6.1. Overview
- 16.2.6.2. Products
- 16.2.6.3. SWOT Analysis
- 16.2.6.4. Recent Developments
- 16.2.6.5. Financials (Based on Availability)
- 16.2.7 Quantum Coating
- 16.2.7.1. Overview
- 16.2.7.2. Products
- 16.2.7.3. SWOT Analysis
- 16.2.7.4. Recent Developments
- 16.2.7.5. Financials (Based on Availability)
- 16.2.8 Zeiss International
- 16.2.8.1. Overview
- 16.2.8.2. Products
- 16.2.8.3. SWOT Analysis
- 16.2.8.4. Recent Developments
- 16.2.8.5. Financials (Based on Availability)
- 16.2.9 Edmund Optics Inc
- 16.2.9.1. Overview
- 16.2.9.2. Products
- 16.2.9.3. SWOT Analysis
- 16.2.9.4. Recent Developments
- 16.2.9.5. Financials (Based on Availability)
- 16.2.10 DuPont
- 16.2.10.1. Overview
- 16.2.10.2. Products
- 16.2.10.3. SWOT Analysis
- 16.2.10.4. Recent Developments
- 16.2.10.5. Financials (Based on Availability)
- 16.2.11 Inrad Optics
- 16.2.11.1. Overview
- 16.2.11.2. Products
- 16.2.11.3. SWOT Analysis
- 16.2.11.4. Recent Developments
- 16.2.11.5. Financials (Based on Availability)
- 16.2.12 Artemis Optical Ltd
- 16.2.12.1. Overview
- 16.2.12.2. Products
- 16.2.12.3. SWOT Analysis
- 16.2.12.4. Recent Developments
- 16.2.12.5. Financials (Based on Availability)
- 16.2.13 Accucoat Inc
- 16.2.13.1. Overview
- 16.2.13.2. Products
- 16.2.13.3. SWOT Analysis
- 16.2.13.4. Recent Developments
- 16.2.13.5. Financials (Based on Availability)
- 16.2.14 Materion Corporation
- 16.2.14.1. Overview
- 16.2.14.2. Products
- 16.2.14.3. SWOT Analysis
- 16.2.14.4. Recent Developments
- 16.2.14.5. Financials (Based on Availability)
- 16.2.15 Abrisa Technologies
- 16.2.15.1. Overview
- 16.2.15.2. Products
- 16.2.15.3. SWOT Analysis
- 16.2.15.4. Recent Developments
- 16.2.15.5. Financials (Based on Availability)
- 16.2.16 Reynard Corporation
- 16.2.16.1. Overview
- 16.2.16.2. Products
- 16.2.16.3. SWOT Analysis
- 16.2.16.4. Recent Developments
- 16.2.16.5. Financials (Based on Availability)
- 16.2.17 Newport Corporation
- 16.2.17.1. Overview
- 16.2.17.2. Products
- 16.2.17.3. SWOT Analysis
- 16.2.17.4. Recent Developments
- 16.2.17.5. Financials (Based on Availability)
- 16.2.18 Zygo Corporation*List Not Exhaustive
- 16.2.18.1. Overview
- 16.2.18.2. Products
- 16.2.18.3. SWOT Analysis
- 16.2.18.4. Recent Developments
- 16.2.18.5. Financials (Based on Availability)
- 16.2.1 Nippon Sheet Glass Co Ltd
List of Figures
- Figure 1: Global Optical Coatings Industry Revenue Breakdown (Million, %) by Region 2024 & 2032
- Figure 2: Asia Pacific Optical Coatings Industry Revenue (Million), by Country 2024 & 2032
- Figure 3: Asia Pacific Optical Coatings Industry Revenue Share (%), by Country 2024 & 2032
- Figure 4: North America Optical Coatings Industry Revenue (Million), by Country 2024 & 2032
- Figure 5: North America Optical Coatings Industry Revenue Share (%), by Country 2024 & 2032
- Figure 6: Europe Optical Coatings Industry Revenue (Million), by Country 2024 & 2032
- Figure 7: Europe Optical Coatings Industry Revenue Share (%), by Country 2024 & 2032
- Figure 8: South America Optical Coatings Industry Revenue (Million), by Country 2024 & 2032
- Figure 9: South America Optical Coatings Industry Revenue Share (%), by Country 2024 & 2032
- Figure 10: Middle East and Africa Optical Coatings Industry Revenue (Million), by Country 2024 & 2032
- Figure 11: Middle East and Africa Optical Coatings Industry Revenue Share (%), by Country 2024 & 2032
- Figure 12: Asia Pacific Optical Coatings Industry Revenue (Million), by Product Type 2024 & 2032
- Figure 13: Asia Pacific Optical Coatings Industry Revenue Share (%), by Product Type 2024 & 2032
- Figure 14: Asia Pacific Optical Coatings Industry Revenue (Million), by Technology 2024 & 2032
- Figure 15: Asia Pacific Optical Coatings Industry Revenue Share (%), by Technology 2024 & 2032
- Figure 16: Asia Pacific Optical Coatings Industry Revenue (Million), by End-user Industry 2024 & 2032
- Figure 17: Asia Pacific Optical Coatings Industry Revenue Share (%), by End-user Industry 2024 & 2032
- Figure 18: Asia Pacific Optical Coatings Industry Revenue (Million), by Country 2024 & 2032
- Figure 19: Asia Pacific Optical Coatings Industry Revenue Share (%), by Country 2024 & 2032
- Figure 20: North America Optical Coatings Industry Revenue (Million), by Product Type 2024 & 2032
- Figure 21: North America Optical Coatings Industry Revenue Share (%), by Product Type 2024 & 2032
- Figure 22: North America Optical Coatings Industry Revenue (Million), by Technology 2024 & 2032
- Figure 23: North America Optical Coatings Industry Revenue Share (%), by Technology 2024 & 2032
- Figure 24: North America Optical Coatings Industry Revenue (Million), by End-user Industry 2024 & 2032
- Figure 25: North America Optical Coatings Industry Revenue Share (%), by End-user Industry 2024 & 2032
- Figure 26: North America Optical Coatings Industry Revenue (Million), by Country 2024 & 2032
- Figure 27: North America Optical Coatings Industry Revenue Share (%), by Country 2024 & 2032
- Figure 28: Europe Optical Coatings Industry Revenue (Million), by Product Type 2024 & 2032
- Figure 29: Europe Optical Coatings Industry Revenue Share (%), by Product Type 2024 & 2032
- Figure 30: Europe Optical Coatings Industry Revenue (Million), by Technology 2024 & 2032
- Figure 31: Europe Optical Coatings Industry Revenue Share (%), by Technology 2024 & 2032
- Figure 32: Europe Optical Coatings Industry Revenue (Million), by End-user Industry 2024 & 2032
- Figure 33: Europe Optical Coatings Industry Revenue Share (%), by End-user Industry 2024 & 2032
- Figure 34: Europe Optical Coatings Industry Revenue (Million), by Country 2024 & 2032
- Figure 35: Europe Optical Coatings Industry Revenue Share (%), by Country 2024 & 2032
- Figure 36: South America Optical Coatings Industry Revenue (Million), by Product Type 2024 & 2032
- Figure 37: South America Optical Coatings Industry Revenue Share (%), by Product Type 2024 & 2032
- Figure 38: South America Optical Coatings Industry Revenue (Million), by Technology 2024 & 2032
- Figure 39: South America Optical Coatings Industry Revenue Share (%), by Technology 2024 & 2032
- Figure 40: South America Optical Coatings Industry Revenue (Million), by End-user Industry 2024 & 2032
- Figure 41: South America Optical Coatings Industry Revenue Share (%), by End-user Industry 2024 & 2032
- Figure 42: South America Optical Coatings Industry Revenue (Million), by Country 2024 & 2032
- Figure 43: South America Optical Coatings Industry Revenue Share (%), by Country 2024 & 2032
- Figure 44: Middle East and Africa Optical Coatings Industry Revenue (Million), by Product Type 2024 & 2032
- Figure 45: Middle East and Africa Optical Coatings Industry Revenue Share (%), by Product Type 2024 & 2032
- Figure 46: Middle East and Africa Optical Coatings Industry Revenue (Million), by Technology 2024 & 2032
- Figure 47: Middle East and Africa Optical Coatings Industry Revenue Share (%), by Technology 2024 & 2032
- Figure 48: Middle East and Africa Optical Coatings Industry Revenue (Million), by End-user Industry 2024 & 2032
- Figure 49: Middle East and Africa Optical Coatings Industry Revenue Share (%), by End-user Industry 2024 & 2032
- Figure 50: Middle East and Africa Optical Coatings Industry Revenue (Million), by Country 2024 & 2032
- Figure 51: Middle East and Africa Optical Coatings Industry Revenue Share (%), by Country 2024 & 2032
List of Tables
- Table 1: Global Optical Coatings Industry Revenue Million Forecast, by Region 2019 & 2032
- Table 2: Global Optical Coatings Industry Revenue Million Forecast, by Product Type 2019 & 2032
- Table 3: Global Optical Coatings Industry Revenue Million Forecast, by Technology 2019 & 2032
- Table 4: Global Optical Coatings Industry Revenue Million Forecast, by End-user Industry 2019 & 2032
- Table 5: Global Optical Coatings Industry Revenue Million Forecast, by Region 2019 & 2032
- Table 6: Global Optical Coatings Industry Revenue Million Forecast, by Country 2019 & 2032
- Table 7: China Optical Coatings Industry Revenue (Million) Forecast, by Application 2019 & 2032
- Table 8: India Optical Coatings Industry Revenue (Million) Forecast, by Application 2019 & 2032
- Table 9: Japan Optical Coatings Industry Revenue (Million) Forecast, by Application 2019 & 2032
- Table 10: South Korea Optical Coatings Industry Revenue (Million) Forecast, by Application 2019 & 2032
- Table 11: Rest of Asia Pacific Optical Coatings Industry Revenue (Million) Forecast, by Application 2019 & 2032
- Table 12: Global Optical Coatings Industry Revenue Million Forecast, by Country 2019 & 2032
- Table 13: United States Optical Coatings Industry Revenue (Million) Forecast, by Application 2019 & 2032
- Table 14: Canada Optical Coatings Industry Revenue (Million) Forecast, by Application 2019 & 2032
- Table 15: Mexico Optical Coatings Industry Revenue (Million) Forecast, by Application 2019 & 2032
- Table 16: Global Optical Coatings Industry Revenue Million Forecast, by Country 2019 & 2032
- Table 17: Germany Optical Coatings Industry Revenue (Million) Forecast, by Application 2019 & 2032
- Table 18: United Kingdom Optical Coatings Industry Revenue (Million) Forecast, by Application 2019 & 2032
- Table 19: Italy Optical Coatings Industry Revenue (Million) Forecast, by Application 2019 & 2032
- Table 20: France Optical Coatings Industry Revenue (Million) Forecast, by Application 2019 & 2032
- Table 21: Rest of Europe Optical Coatings Industry Revenue (Million) Forecast, by Application 2019 & 2032
- Table 22: Global Optical Coatings Industry Revenue Million Forecast, by Country 2019 & 2032
- Table 23: Brazil Optical Coatings Industry Revenue (Million) Forecast, by Application 2019 & 2032
- Table 24: Argentina Optical Coatings Industry Revenue (Million) Forecast, by Application 2019 & 2032
- Table 25: Rest of South America Optical Coatings Industry Revenue (Million) Forecast, by Application 2019 & 2032
- Table 26: Global Optical Coatings Industry Revenue Million Forecast, by Country 2019 & 2032
- Table 27: Saudi Arabia Optical Coatings Industry Revenue (Million) Forecast, by Application 2019 & 2032
- Table 28: South Africa Optical Coatings Industry Revenue (Million) Forecast, by Application 2019 & 2032
- Table 29: Rest of Middle East and Africa Optical Coatings Industry Revenue (Million) Forecast, by Application 2019 & 2032
- Table 30: Global Optical Coatings Industry Revenue Million Forecast, by Product Type 2019 & 2032
- Table 31: Global Optical Coatings Industry Revenue Million Forecast, by Technology 2019 & 2032
- Table 32: Global Optical Coatings Industry Revenue Million Forecast, by End-user Industry 2019 & 2032
- Table 33: Global Optical Coatings Industry Revenue Million Forecast, by Country 2019 & 2032
- Table 34: China Optical Coatings Industry Revenue (Million) Forecast, by Application 2019 & 2032
- Table 35: India Optical Coatings Industry Revenue (Million) Forecast, by Application 2019 & 2032
- Table 36: Japan Optical Coatings Industry Revenue (Million) Forecast, by Application 2019 & 2032
- Table 37: South Korea Optical Coatings Industry Revenue (Million) Forecast, by Application 2019 & 2032
- Table 38: Malaysia Optical Coatings Industry Revenue (Million) Forecast, by Application 2019 & 2032
- Table 39: Thailand Optical Coatings Industry Revenue (Million) Forecast, by Application 2019 & 2032
- Table 40: Indonesia Optical Coatings Industry Revenue (Million) Forecast, by Application 2019 & 2032
- Table 41: Vietnam Optical Coatings Industry Revenue (Million) Forecast, by Application 2019 & 2032
- Table 42: Rest of Asia Pacific Optical Coatings Industry Revenue (Million) Forecast, by Application 2019 & 2032
- Table 43: Global Optical Coatings Industry Revenue Million Forecast, by Product Type 2019 & 2032
- Table 44: Global Optical Coatings Industry Revenue Million Forecast, by Technology 2019 & 2032
- Table 45: Global Optical Coatings Industry Revenue Million Forecast, by End-user Industry 2019 & 2032
- Table 46: Global Optical Coatings Industry Revenue Million Forecast, by Country 2019 & 2032
- Table 47: United States Optical Coatings Industry Revenue (Million) Forecast, by Application 2019 & 2032
- Table 48: Canada Optical Coatings Industry Revenue (Million) Forecast, by Application 2019 & 2032
- Table 49: Mexico Optical Coatings Industry Revenue (Million) Forecast, by Application 2019 & 2032
- Table 50: Global Optical Coatings Industry Revenue Million Forecast, by Product Type 2019 & 2032
- Table 51: Global Optical Coatings Industry Revenue Million Forecast, by Technology 2019 & 2032
- Table 52: Global Optical Coatings Industry Revenue Million Forecast, by End-user Industry 2019 & 2032
- Table 53: Global Optical Coatings Industry Revenue Million Forecast, by Country 2019 & 2032
- Table 54: Germany Optical Coatings Industry Revenue (Million) Forecast, by Application 2019 & 2032
- Table 55: United Kingdom Optical Coatings Industry Revenue (Million) Forecast, by Application 2019 & 2032
- Table 56: Italy Optical Coatings Industry Revenue (Million) Forecast, by Application 2019 & 2032
- Table 57: France Optical Coatings Industry Revenue (Million) Forecast, by Application 2019 & 2032
- Table 58: Spain Optical Coatings Industry Revenue (Million) Forecast, by Application 2019 & 2032
- Table 59: Nordic Countries Optical Coatings Industry Revenue (Million) Forecast, by Application 2019 & 2032
- Table 60: Turkey Optical Coatings Industry Revenue (Million) Forecast, by Application 2019 & 2032
- Table 61: Russia Optical Coatings Industry Revenue (Million) Forecast, by Application 2019 & 2032
- Table 62: Rest of Europe Optical Coatings Industry Revenue (Million) Forecast, by Application 2019 & 2032
- Table 63: Global Optical Coatings Industry Revenue Million Forecast, by Product Type 2019 & 2032
- Table 64: Global Optical Coatings Industry Revenue Million Forecast, by Technology 2019 & 2032
- Table 65: Global Optical Coatings Industry Revenue Million Forecast, by End-user Industry 2019 & 2032
- Table 66: Global Optical Coatings Industry Revenue Million Forecast, by Country 2019 & 2032
- Table 67: Brazil Optical Coatings Industry Revenue (Million) Forecast, by Application 2019 & 2032
- Table 68: Argentina Optical Coatings Industry Revenue (Million) Forecast, by Application 2019 & 2032
- Table 69: Colombia Optical Coatings Industry Revenue (Million) Forecast, by Application 2019 & 2032
- Table 70: Rest of South America Optical Coatings Industry Revenue (Million) Forecast, by Application 2019 & 2032
- Table 71: Global Optical Coatings Industry Revenue Million Forecast, by Product Type 2019 & 2032
- Table 72: Global Optical Coatings Industry Revenue Million Forecast, by Technology 2019 & 2032
- Table 73: Global Optical Coatings Industry Revenue Million Forecast, by End-user Industry 2019 & 2032
- Table 74: Global Optical Coatings Industry Revenue Million Forecast, by Country 2019 & 2032
- Table 75: Saudi Arabia Optical Coatings Industry Revenue (Million) Forecast, by Application 2019 & 2032
- Table 76: South Africa Optical Coatings Industry Revenue (Million) Forecast, by Application 2019 & 2032
- Table 77: Qatar Optical Coatings Industry Revenue (Million) Forecast, by Application 2019 & 2032
- Table 78: United Arab Emirates Optical Coatings Industry Revenue (Million) Forecast, by Application 2019 & 2032
- Table 79: Nigeria Optical Coatings Industry Revenue (Million) Forecast, by Application 2019 & 2032
- Table 80: Egypt Optical Coatings Industry Revenue (Million) Forecast, by Application 2019 & 2032
- Table 81: Rest of Middle East and Africa Optical Coatings Industry Revenue (Million) Forecast, by Application 2019 & 2032
Frequently Asked Questions
1. What is the projected Compound Annual Growth Rate (CAGR) of the Optical Coatings Industry?
The projected CAGR is approximately 6.17%.
2. Which companies are prominent players in the Optical Coatings Industry?
Key companies in the market include Nippon Sheet Glass Co Ltd, Optical Coatings Technologies, Sigmakoki Co Ltd, Schott AG, 3M, PPG Industries Inc, Quantum Coating, Zeiss International, Edmund Optics Inc, DuPont, Inrad Optics, Artemis Optical Ltd, Accucoat Inc, Materion Corporation, Abrisa Technologies, Reynard Corporation, Newport Corporation, Zygo Corporation*List Not Exhaustive.
3. What are the main segments of the Optical Coatings Industry?
The market segments include Product Type, Technology, End-user Industry.
4. Can you provide details about the market size?
The market size is estimated to be USD 8.84 Million as of 2022.
5. What are some drivers contributing to market growth?
Growing Demand from the Solar Industry; Technological Advancements in the Optical Coatings Process.
6. What are the notable trends driving market growth?
The Electronics and Semiconductors Segment is Expected to Dominate the Market.
7. Are there any restraints impacting market growth?
High Costs and Some Limiting Properties of Optical Coatings.
8. Can you provide examples of recent developments in the market?
April 2022: Imatest announced a new partnership with Edmund Optics Inc. to enable its customers to buy Imatest software and charts via Edmund Optics' website seamlessly. Additionally, this partnership will allow Edmund Optics' imaging customers to easily acquire the tools needed to evaluate their imaging performance.
9. What pricing options are available for accessing the report?
Pricing options include single-user, multi-user, and enterprise licenses priced at USD 4750, USD 5250, and USD 8750 respectively.
10. Is the market size provided in terms of value or volume?
The market size is provided in terms of value, measured in Million.
11. Are there any specific market keywords associated with the report?
Yes, the market keyword associated with the report is "Optical Coatings Industry," which aids in identifying and referencing the specific market segment covered.
12. How do I determine which pricing option suits my needs best?
The pricing options vary based on user requirements and access needs. Individual users may opt for single-user licenses, while businesses requiring broader access may choose multi-user or enterprise licenses for cost-effective access to the report.
13. Are there any additional resources or data provided in the Optical Coatings Industry report?
While the report offers comprehensive insights, it's advisable to review the specific contents or supplementary materials provided to ascertain if additional resources or data are available.
14. How can I stay updated on further developments or reports in the Optical Coatings Industry?
To stay informed about further developments, trends, and reports in the Optical Coatings Industry, consider subscribing to industry newsletters, following relevant companies and organizations, or regularly checking reputable industry news sources and publications.
Methodology
Step 1 - Identification of Relevant Samples Size from Population Database


Step 2 - Approaches for Defining Global Market Size (Value, Volume* & Price*)

Note*: In applicable scenarios
Step 3 - Data Sources
Primary Research
- Web Analytics
- Survey Reports
- Research Institute
- Latest Research Reports
- Opinion Leaders
Secondary Research
- Annual Reports
- White Paper
- Latest Press Release
- Industry Association
- Paid Database
- Investor Presentations

Step 4 - Data Triangulation
Involves using different sources of information in order to increase the validity of a study
These sources are likely to be stakeholders in a program - participants, other researchers, program staff, other community members, and so on.
Then we put all data in single framework & apply various statistical tools to find out the dynamic on the market.
During the analysis stage, feedback from the stakeholder groups would be compared to determine areas of agreement as well as areas of divergence


