
Key Insights
The global Oral Transmucosal Drug market is experiencing robust growth, projected to reach a substantial size by 2033. Driven by a rising prevalence of chronic conditions like opioid dependence and neurological disorders, coupled with the increasing demand for faster-acting and more convenient drug delivery systems, this market demonstrates significant potential. The preference for non-invasive administration routes, minimizing gastrointestinal complications and enhancing bioavailability, is further fueling market expansion. Segment analysis reveals strong growth in the tablets and films segments due to ease of use and improved patient compliance. Sublingual and buccal mucosa routes of administration dominate, owing to their rapid absorption and direct entry into the bloodstream. While the opioid dependence indication currently leads in market share, other therapeutic areas like nausea and vomiting, and erectile dysfunction are experiencing notable growth, contributing to the market's diversification. Key players in the market are focused on developing innovative formulations and expanding their product portfolios to capitalize on this growth. Geographical analysis indicates strong market penetration in North America and Europe, attributed to advanced healthcare infrastructure and high per capita healthcare spending. However, emerging economies in Asia-Pacific are showing promising growth prospects due to increasing healthcare awareness and rising disposable incomes.
Despite the positive outlook, certain restraints influence market growth. These include challenges in formulation development, particularly ensuring consistent drug release and absorption from the oral mucosa, and concerns regarding potential side effects. Regulatory hurdles and stringent approval processes also pose challenges to market expansion. Nevertheless, ongoing research and development efforts focused on overcoming these limitations, along with the continued rise in chronic diseases, are expected to drive significant market growth over the forecast period. The market is characterized by high competition among established pharmaceutical companies and emerging biotech firms, which are actively involved in strategic partnerships, collaborations, and mergers and acquisitions to gain a competitive edge. This dynamic competitive landscape further emphasizes the potential for continued growth and innovation within the oral transmucosal drug market.
Oral Transmucosal Drugs Market: A Comprehensive Report (2019-2033)
This comprehensive report provides an in-depth analysis of the Oral Transmucosal Drugs market, offering valuable insights for industry professionals, investors, and researchers. Covering the period 2019-2033, with a focus on 2025, this report meticulously examines market structure, dynamics, leading players, and future growth potential. The report leverages extensive data analysis to forecast market trends and identify lucrative opportunities within this rapidly evolving sector.
Oral Transmucosal Drugs Market Market Structure & Innovation Trends
This section analyzes the competitive landscape of the oral transmucosal drugs market, examining market concentration, innovation drivers, regulatory frameworks, and M&A activities. The market is characterized by a mix of large multinational pharmaceutical companies and smaller specialized firms. Market share data reveals a relatively fragmented landscape, with no single dominant player controlling a significant majority. However, companies like Pfizer Inc. and Novartis AG maintain substantial influence due to their extensive product portfolios and global reach.
- Market Concentration: Moderate, with a few key players holding significant, but not dominant, shares. xx% of the market is controlled by the top 5 players in 2025.
- Innovation Drivers: Growing demand for faster-acting and more convenient drug delivery systems, advancements in drug formulation technologies (e.g., oral films, sprays), and increased R&D investment in targeted therapies are driving innovation.
- Regulatory Frameworks: Stringent regulatory approvals and varying guidelines across different regions impact market entry and product development. Compliance costs and timelines significantly influence market dynamics.
- Product Substitutes: The availability of alternative drug delivery methods (e.g., injectables, oral capsules) poses a competitive challenge, necessitating continuous innovation and differentiation within the oral transmucosal drug segment.
- End-User Demographics: The aging global population, coupled with the rising prevalence of chronic diseases, significantly contributes to market growth. A larger proportion of patients prefer convenient and easy-to-administer medication, driving the demand for oral transmucosal drugs.
- M&A Activities: The market has witnessed several strategic mergers and acquisitions in recent years, with deal values ranging from xx Million to xx Million, primarily focused on expanding product portfolios and accessing new technologies. These activities further consolidate the market, enhancing the capabilities of key players.
Oral Transmucosal Drugs Market Market Dynamics & Trends
The oral transmucosal drugs market is experiencing significant growth, driven by several key factors. The increasing prevalence of chronic diseases, such as opioid dependence, neurological disorders, and erectile dysfunction, is a major market driver. Moreover, patient preference for non-invasive and rapid-acting drug delivery systems is fueling market expansion. Technological advancements in drug formulation and delivery mechanisms contribute to improved efficacy and patient compliance.
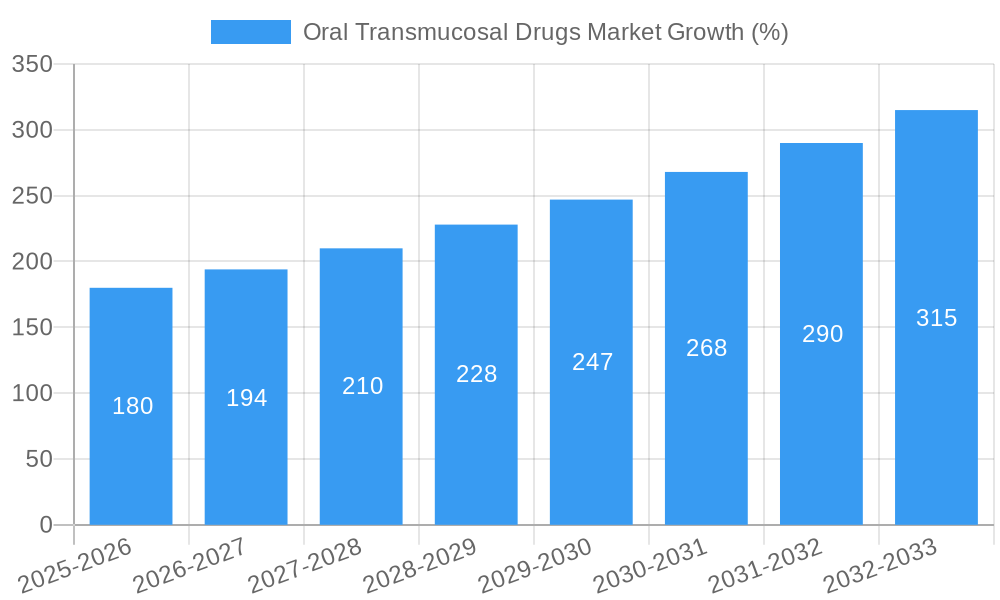
The market's compound annual growth rate (CAGR) is projected to be xx% during the forecast period (2025-2033), driven by increasing demand and innovation. Market penetration is expected to rise from xx% in 2025 to xx% by 2033. Competitive dynamics are intense, with companies focusing on product differentiation, strategic partnerships, and geographical expansion to gain market share. The emergence of innovative products like oral films and sprays is reshaping market dynamics, challenging traditional oral tablet formulations. Consumer preferences for personalized medicine and improved patient experience are further shaping the market landscape.
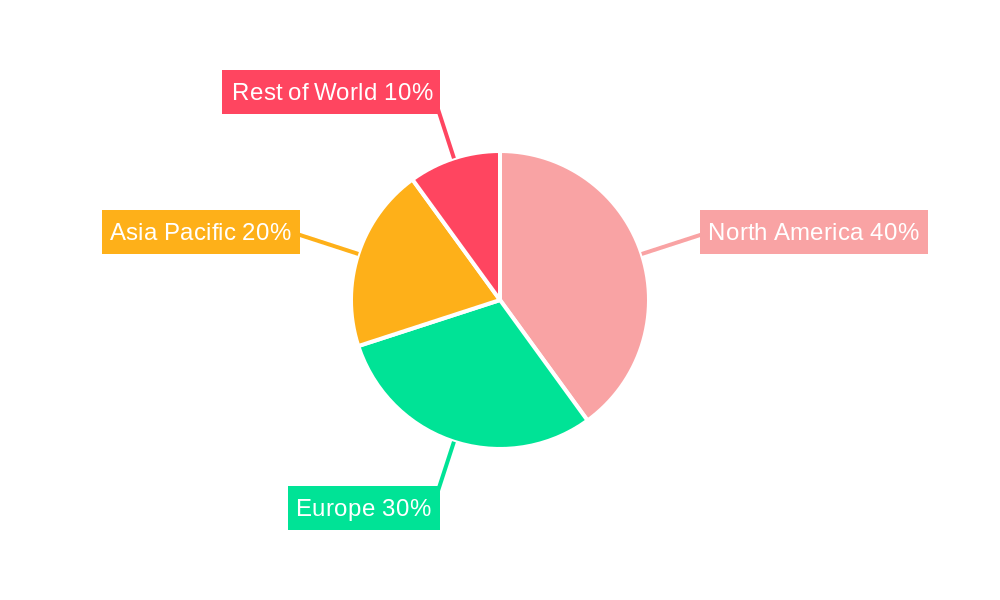
Dominant Regions & Segments in Oral Transmucosal Drugs Market
The North American region currently holds the largest market share, followed by Europe. However, emerging markets in Asia-Pacific are expected to witness significant growth due to rising healthcare expenditure and increasing awareness of advanced drug delivery systems.
Key Drivers by Segment:
- By Product Type:
- Films: Rapid onset of action and ease of administration are driving the growth of oral films.
- Liquid & Spray: Preferred for specific indications and ease of use in certain demographics.
- By Route of Administration:
- Sublingual Mucosa: High absorption rate contributes to its popularity.
- Buccal Mucosa: Provides sustained drug release and reduced first-pass metabolism effects.
- By Indication:
- Opioid Dependence: A large and growing market segment due to the escalating opioid crisis.
- Erectile Dysfunction: Convenience and faster action is driving segment growth.
- By Distribution Channel:
- Hospital Pharmacies: Maintain a significant share due to direct access to patients.
- Retail Pharmacies: Increasing accessibility and affordability drives segment growth.
- Online Pharmacies: Growing popularity and convenience contribute to its increasing share.
Oral Transmucosal Drugs Market Product Innovations
Recent years have witnessed notable advancements in oral transmucosal drug formulation. The development of rapidly dissolving oral films and novel spray technologies has significantly improved drug delivery efficiency and patient convenience. These innovations cater to the demand for faster-acting medications with improved bioavailability and reduced side effects. Competition is driving the development of unique product formulations that offer competitive advantages such as enhanced patient compliance and targeted drug delivery.
Report Scope & Segmentation Analysis
This report offers a comprehensive analysis of the oral transmucosal drugs market, segmented by product type (tablets, films, liquid & spray, others), route of administration (sublingual mucosa, buccal mucosa, others), indication (opioid dependence, nausea and vomiting, erectile dysfunction, neurological disorders, others), and distribution channel (hospital pharmacies, retail pharmacies, online pharmacies). Each segment's growth projections, market sizes, and competitive dynamics are thoroughly examined. The forecast period is 2025-2033, providing valuable insights into future market trends.
Key Drivers of Oral Transmucosal Drugs Market Growth
Several factors fuel the growth of the oral transmucosal drugs market. Technological advancements resulting in improved drug delivery systems and enhanced patient compliance are key drivers. The rising prevalence of chronic diseases and the increasing geriatric population contribute significantly to the growing demand for these medications. Favorable regulatory environments in certain regions also stimulate market expansion.
Challenges in the Oral Transmucosal Drugs Market Sector
The oral transmucosal drugs market faces several challenges. Strict regulatory hurdles and lengthy approval processes can delay product launches and increase development costs. Supply chain disruptions and fluctuations in raw material prices pose significant risks. Intense competition from established players and the emergence of new entrants adds to the challenges faced by market participants.
Emerging Opportunities in Oral Transmucosal Drugs Market
The oral transmucosal drugs market offers several promising opportunities. The increasing adoption of personalized medicine approaches presents a significant growth avenue. The expansion into new geographical markets, particularly in emerging economies, offers substantial potential. Advancements in nanotechnology and other drug delivery platforms are likely to create new opportunities for innovation and market expansion.
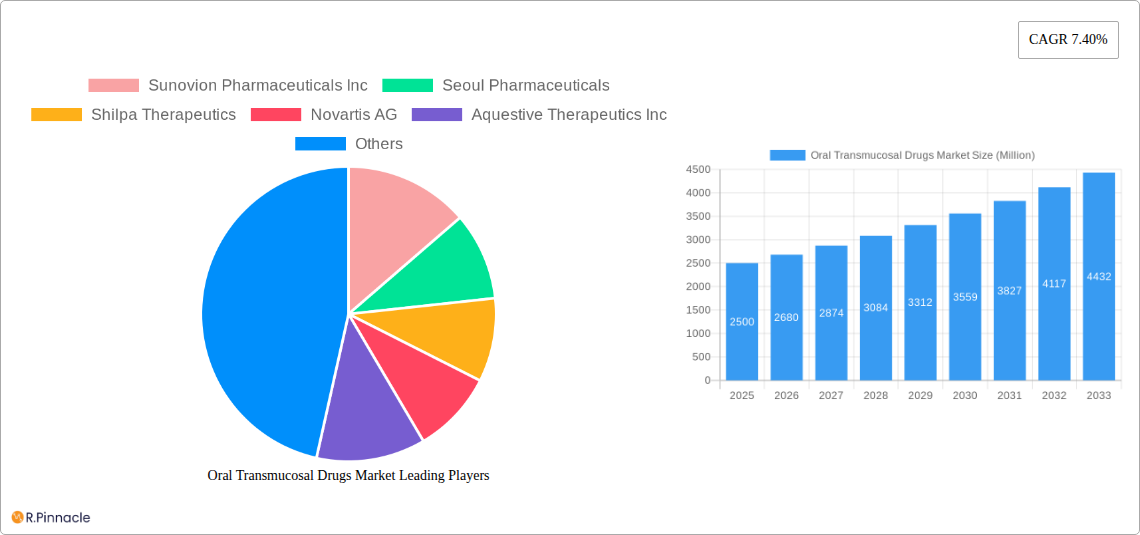
Leading Players in the Oral Transmucosal Drugs Market Market
- Sunovion Pharmaceuticals Inc
- Seoul Pharmaceuticals
- Shilpa Therapeutics
- Novartis AG
- Aquestive Therapeutics Inc
- ZIM Laboratories Limited
- GW Pharmaceuticals plc
- C L Pharm Co Ltd
- IntelGenx Corp
- Pfizer Inc
Key Developments in Oral Transmucosal Drugs Market Industry
- September 2021: IntelGenx Corp. launched RIZAPORT (rizatriptan benzoate oral film) in Spain, with Exeltis Healthcare S.L. as a commercialization partner in the European Union.
- January 2021: CURE Pharmaceutical's CUREfilm Blue (sildenafil citrate oral soluble film) received FDA Investigational New Drug (IND) application approval for erectile dysfunction treatment.
Future Outlook for Oral Transmucosal Drugs Market Market
The future of the oral transmucosal drugs market appears promising, driven by continuous innovation, increasing demand for convenient drug delivery systems, and the growing prevalence of chronic diseases. Strategic partnerships, technological advancements, and expansion into new markets are expected to further propel market growth. The market is poised for significant expansion in the coming years, presenting substantial opportunities for both established and emerging players.
Oral Transmucosal Drugs Market Segmentation
-
1. Product Type
- 1.1. Tablets
- 1.2. Films
- 1.3. Liquid & Spray
- 1.4. Others
-
2. Route of Administration
- 2.1. Sublingual Mucosa
- 2.2. Buccal Mucosa
- 2.3. Others
-
3. Indication
- 3.1. Opioid Dependence
- 3.2. Nausea and Vomiting
- 3.3. Erectile Dysfunction
- 3.4. Neurological Disorders
- 3.5. Others
-
4. Distribution Channel
- 4.1. Hospital Pharmacies
- 4.2. Retail Pharmacies
- 4.3. Online Pharmacies
Oral Transmucosal Drugs Market Segmentation By Geography
-
1. North America
- 1.1. United States
- 1.2. Canada
- 1.3. Mexico
-
2. Europe
- 2.1. Germany
- 2.2. United Kingdom
- 2.3. France
- 2.4. Italy
- 2.5. Spain
- 2.6. Rest of Europe
-
3. Asia Pacific
- 3.1. China
- 3.2. Japan
- 3.3. India
- 3.4. Australia
- 3.5. South Korea
- 3.6. Rest of Asia Pacific
-
4. Middle East and Africa
- 4.1. GCC
- 4.2. South Africa
- 4.3. Rest of Middle East and Africa
-
5. South America
- 5.1. Brazil
- 5.2. Argentina
- 5.3. Rest of South America
Oral Transmucosal Drugs Market REPORT HIGHLIGHTS
| Aspects | Details |
|---|---|
| Study Period | 2019-2033 |
| Base Year | 2024 |
| Estimated Year | 2025 |
| Forecast Period | 2025-2033 |
| Historical Period | 2019-2024 |
| Growth Rate | CAGR of 7.40% from 2019-2033 |
| Segmentation |
|
Table of Contents
- 1. Introduction
- 1.1. Research Scope
- 1.2. Market Segmentation
- 1.3. Research Methodology
- 1.4. Definitions and Assumptions
- 2. Executive Summary
- 2.1. Introduction
- 3. Market Dynamics
- 3.1. Introduction
- 3.2. Market Drivers
- 3.2.1. Growing Burden of Target Diseases; Rise in R&D Activities and Product Launches
- 3.3. Market Restrains
- 3.3.1. Disadvantages Associated With Oral Transmucosal Drug Delivery
- 3.4. Market Trends
- 3.4.1. Tablets segment is Expected to Hold a Significant Share Over the Forecast Period
- 4. Market Factor Analysis
- 4.1. Porters Five Forces
- 4.2. Supply/Value Chain
- 4.3. PESTEL analysis
- 4.4. Market Entropy
- 4.5. Patent/Trademark Analysis
- 5. Global Oral Transmucosal Drugs Market Analysis, Insights and Forecast, 2019-2031
- 5.1. Market Analysis, Insights and Forecast - by Product Type
- 5.1.1. Tablets
- 5.1.2. Films
- 5.1.3. Liquid & Spray
- 5.1.4. Others
- 5.2. Market Analysis, Insights and Forecast - by Route of Administration
- 5.2.1. Sublingual Mucosa
- 5.2.2. Buccal Mucosa
- 5.2.3. Others
- 5.3. Market Analysis, Insights and Forecast - by Indication
- 5.3.1. Opioid Dependence
- 5.3.2. Nausea and Vomiting
- 5.3.3. Erectile Dysfunction
- 5.3.4. Neurological Disorders
- 5.3.5. Others
- 5.4. Market Analysis, Insights and Forecast - by Distribution Channel
- 5.4.1. Hospital Pharmacies
- 5.4.2. Retail Pharmacies
- 5.4.3. Online Pharmacies
- 5.5. Market Analysis, Insights and Forecast - by Region
- 5.5.1. North America
- 5.5.2. Europe
- 5.5.3. Asia Pacific
- 5.5.4. Middle East and Africa
- 5.5.5. South America
- 5.1. Market Analysis, Insights and Forecast - by Product Type
- 6. North America Oral Transmucosal Drugs Market Analysis, Insights and Forecast, 2019-2031
- 6.1. Market Analysis, Insights and Forecast - by Product Type
- 6.1.1. Tablets
- 6.1.2. Films
- 6.1.3. Liquid & Spray
- 6.1.4. Others
- 6.2. Market Analysis, Insights and Forecast - by Route of Administration
- 6.2.1. Sublingual Mucosa
- 6.2.2. Buccal Mucosa
- 6.2.3. Others
- 6.3. Market Analysis, Insights and Forecast - by Indication
- 6.3.1. Opioid Dependence
- 6.3.2. Nausea and Vomiting
- 6.3.3. Erectile Dysfunction
- 6.3.4. Neurological Disorders
- 6.3.5. Others
- 6.4. Market Analysis, Insights and Forecast - by Distribution Channel
- 6.4.1. Hospital Pharmacies
- 6.4.2. Retail Pharmacies
- 6.4.3. Online Pharmacies
- 6.1. Market Analysis, Insights and Forecast - by Product Type
- 7. Europe Oral Transmucosal Drugs Market Analysis, Insights and Forecast, 2019-2031
- 7.1. Market Analysis, Insights and Forecast - by Product Type
- 7.1.1. Tablets
- 7.1.2. Films
- 7.1.3. Liquid & Spray
- 7.1.4. Others
- 7.2. Market Analysis, Insights and Forecast - by Route of Administration
- 7.2.1. Sublingual Mucosa
- 7.2.2. Buccal Mucosa
- 7.2.3. Others
- 7.3. Market Analysis, Insights and Forecast - by Indication
- 7.3.1. Opioid Dependence
- 7.3.2. Nausea and Vomiting
- 7.3.3. Erectile Dysfunction
- 7.3.4. Neurological Disorders
- 7.3.5. Others
- 7.4. Market Analysis, Insights and Forecast - by Distribution Channel
- 7.4.1. Hospital Pharmacies
- 7.4.2. Retail Pharmacies
- 7.4.3. Online Pharmacies
- 7.1. Market Analysis, Insights and Forecast - by Product Type
- 8. Asia Pacific Oral Transmucosal Drugs Market Analysis, Insights and Forecast, 2019-2031
- 8.1. Market Analysis, Insights and Forecast - by Product Type
- 8.1.1. Tablets
- 8.1.2. Films
- 8.1.3. Liquid & Spray
- 8.1.4. Others
- 8.2. Market Analysis, Insights and Forecast - by Route of Administration
- 8.2.1. Sublingual Mucosa
- 8.2.2. Buccal Mucosa
- 8.2.3. Others
- 8.3. Market Analysis, Insights and Forecast - by Indication
- 8.3.1. Opioid Dependence
- 8.3.2. Nausea and Vomiting
- 8.3.3. Erectile Dysfunction
- 8.3.4. Neurological Disorders
- 8.3.5. Others
- 8.4. Market Analysis, Insights and Forecast - by Distribution Channel
- 8.4.1. Hospital Pharmacies
- 8.4.2. Retail Pharmacies
- 8.4.3. Online Pharmacies
- 8.1. Market Analysis, Insights and Forecast - by Product Type
- 9. Middle East and Africa Oral Transmucosal Drugs Market Analysis, Insights and Forecast, 2019-2031
- 9.1. Market Analysis, Insights and Forecast - by Product Type
- 9.1.1. Tablets
- 9.1.2. Films
- 9.1.3. Liquid & Spray
- 9.1.4. Others
- 9.2. Market Analysis, Insights and Forecast - by Route of Administration
- 9.2.1. Sublingual Mucosa
- 9.2.2. Buccal Mucosa
- 9.2.3. Others
- 9.3. Market Analysis, Insights and Forecast - by Indication
- 9.3.1. Opioid Dependence
- 9.3.2. Nausea and Vomiting
- 9.3.3. Erectile Dysfunction
- 9.3.4. Neurological Disorders
- 9.3.5. Others
- 9.4. Market Analysis, Insights and Forecast - by Distribution Channel
- 9.4.1. Hospital Pharmacies
- 9.4.2. Retail Pharmacies
- 9.4.3. Online Pharmacies
- 9.1. Market Analysis, Insights and Forecast - by Product Type
- 10. South America Oral Transmucosal Drugs Market Analysis, Insights and Forecast, 2019-2031
- 10.1. Market Analysis, Insights and Forecast - by Product Type
- 10.1.1. Tablets
- 10.1.2. Films
- 10.1.3. Liquid & Spray
- 10.1.4. Others
- 10.2. Market Analysis, Insights and Forecast - by Route of Administration
- 10.2.1. Sublingual Mucosa
- 10.2.2. Buccal Mucosa
- 10.2.3. Others
- 10.3. Market Analysis, Insights and Forecast - by Indication
- 10.3.1. Opioid Dependence
- 10.3.2. Nausea and Vomiting
- 10.3.3. Erectile Dysfunction
- 10.3.4. Neurological Disorders
- 10.3.5. Others
- 10.4. Market Analysis, Insights and Forecast - by Distribution Channel
- 10.4.1. Hospital Pharmacies
- 10.4.2. Retail Pharmacies
- 10.4.3. Online Pharmacies
- 10.1. Market Analysis, Insights and Forecast - by Product Type
- 11. North America Oral Transmucosal Drugs Market Analysis, Insights and Forecast, 2019-2031
- 11.1. Market Analysis, Insights and Forecast - By Country/Sub-region
- 11.1.1 United States
- 11.1.2 Canada
- 11.1.3 Mexico
- 12. Europe Oral Transmucosal Drugs Market Analysis, Insights and Forecast, 2019-2031
- 12.1. Market Analysis, Insights and Forecast - By Country/Sub-region
- 12.1.1 Germany
- 12.1.2 United Kingdom
- 12.1.3 France
- 12.1.4 Italy
- 12.1.5 Spain
- 12.1.6 Rest of Europe
- 13. Asia Pacific Oral Transmucosal Drugs Market Analysis, Insights and Forecast, 2019-2031
- 13.1. Market Analysis, Insights and Forecast - By Country/Sub-region
- 13.1.1 China
- 13.1.2 Japan
- 13.1.3 India
- 13.1.4 Australia
- 13.1.5 South Korea
- 13.1.6 Rest of Asia Pacific
- 14. Middle East and Africa Oral Transmucosal Drugs Market Analysis, Insights and Forecast, 2019-2031
- 14.1. Market Analysis, Insights and Forecast - By Country/Sub-region
- 14.1.1 GCC
- 14.1.2 South Africa
- 14.1.3 Rest of Middle East and Africa
- 15. South America Oral Transmucosal Drugs Market Analysis, Insights and Forecast, 2019-2031
- 15.1. Market Analysis, Insights and Forecast - By Country/Sub-region
- 15.1.1 Brazil
- 15.1.2 Argentina
- 15.1.3 Rest of South America
- 16. Competitive Analysis
- 16.1. Global Market Share Analysis 2024
- 16.2. Company Profiles
- 16.2.1 Sunovion Pharmaceuticals Inc
- 16.2.1.1. Overview
- 16.2.1.2. Products
- 16.2.1.3. SWOT Analysis
- 16.2.1.4. Recent Developments
- 16.2.1.5. Financials (Based on Availability)
- 16.2.2 Seoul Pharmaceuticals
- 16.2.2.1. Overview
- 16.2.2.2. Products
- 16.2.2.3. SWOT Analysis
- 16.2.2.4. Recent Developments
- 16.2.2.5. Financials (Based on Availability)
- 16.2.3 Shilpa Therapeutics
- 16.2.3.1. Overview
- 16.2.3.2. Products
- 16.2.3.3. SWOT Analysis
- 16.2.3.4. Recent Developments
- 16.2.3.5. Financials (Based on Availability)
- 16.2.4 Novartis AG
- 16.2.4.1. Overview
- 16.2.4.2. Products
- 16.2.4.3. SWOT Analysis
- 16.2.4.4. Recent Developments
- 16.2.4.5. Financials (Based on Availability)
- 16.2.5 Aquestive Therapeutics Inc
- 16.2.5.1. Overview
- 16.2.5.2. Products
- 16.2.5.3. SWOT Analysis
- 16.2.5.4. Recent Developments
- 16.2.5.5. Financials (Based on Availability)
- 16.2.6 ZIM Laboratories Limited
- 16.2.6.1. Overview
- 16.2.6.2. Products
- 16.2.6.3. SWOT Analysis
- 16.2.6.4. Recent Developments
- 16.2.6.5. Financials (Based on Availability)
- 16.2.7 GW Pharmaceuticals plc
- 16.2.7.1. Overview
- 16.2.7.2. Products
- 16.2.7.3. SWOT Analysis
- 16.2.7.4. Recent Developments
- 16.2.7.5. Financials (Based on Availability)
- 16.2.8 C L Pharm Co Ltd
- 16.2.8.1. Overview
- 16.2.8.2. Products
- 16.2.8.3. SWOT Analysis
- 16.2.8.4. Recent Developments
- 16.2.8.5. Financials (Based on Availability)
- 16.2.9 IntelGenx Corp
- 16.2.9.1. Overview
- 16.2.9.2. Products
- 16.2.9.3. SWOT Analysis
- 16.2.9.4. Recent Developments
- 16.2.9.5. Financials (Based on Availability)
- 16.2.10 Pfizer Inc
- 16.2.10.1. Overview
- 16.2.10.2. Products
- 16.2.10.3. SWOT Analysis
- 16.2.10.4. Recent Developments
- 16.2.10.5. Financials (Based on Availability)
- 16.2.1 Sunovion Pharmaceuticals Inc
List of Figures
- Figure 1: Global Oral Transmucosal Drugs Market Revenue Breakdown (Million, %) by Region 2024 & 2032
- Figure 2: Global Oral Transmucosal Drugs Market Volume Breakdown (K Unit, %) by Region 2024 & 2032
- Figure 3: North America Oral Transmucosal Drugs Market Revenue (Million), by Country 2024 & 2032
- Figure 4: North America Oral Transmucosal Drugs Market Volume (K Unit), by Country 2024 & 2032
- Figure 5: North America Oral Transmucosal Drugs Market Revenue Share (%), by Country 2024 & 2032
- Figure 6: North America Oral Transmucosal Drugs Market Volume Share (%), by Country 2024 & 2032
- Figure 7: Europe Oral Transmucosal Drugs Market Revenue (Million), by Country 2024 & 2032
- Figure 8: Europe Oral Transmucosal Drugs Market Volume (K Unit), by Country 2024 & 2032
- Figure 9: Europe Oral Transmucosal Drugs Market Revenue Share (%), by Country 2024 & 2032
- Figure 10: Europe Oral Transmucosal Drugs Market Volume Share (%), by Country 2024 & 2032
- Figure 11: Asia Pacific Oral Transmucosal Drugs Market Revenue (Million), by Country 2024 & 2032
- Figure 12: Asia Pacific Oral Transmucosal Drugs Market Volume (K Unit), by Country 2024 & 2032
- Figure 13: Asia Pacific Oral Transmucosal Drugs Market Revenue Share (%), by Country 2024 & 2032
- Figure 14: Asia Pacific Oral Transmucosal Drugs Market Volume Share (%), by Country 2024 & 2032
- Figure 15: Middle East and Africa Oral Transmucosal Drugs Market Revenue (Million), by Country 2024 & 2032
- Figure 16: Middle East and Africa Oral Transmucosal Drugs Market Volume (K Unit), by Country 2024 & 2032
- Figure 17: Middle East and Africa Oral Transmucosal Drugs Market Revenue Share (%), by Country 2024 & 2032
- Figure 18: Middle East and Africa Oral Transmucosal Drugs Market Volume Share (%), by Country 2024 & 2032
- Figure 19: South America Oral Transmucosal Drugs Market Revenue (Million), by Country 2024 & 2032
- Figure 20: South America Oral Transmucosal Drugs Market Volume (K Unit), by Country 2024 & 2032
- Figure 21: South America Oral Transmucosal Drugs Market Revenue Share (%), by Country 2024 & 2032
- Figure 22: South America Oral Transmucosal Drugs Market Volume Share (%), by Country 2024 & 2032
- Figure 23: North America Oral Transmucosal Drugs Market Revenue (Million), by Product Type 2024 & 2032
- Figure 24: North America Oral Transmucosal Drugs Market Volume (K Unit), by Product Type 2024 & 2032
- Figure 25: North America Oral Transmucosal Drugs Market Revenue Share (%), by Product Type 2024 & 2032
- Figure 26: North America Oral Transmucosal Drugs Market Volume Share (%), by Product Type 2024 & 2032
- Figure 27: North America Oral Transmucosal Drugs Market Revenue (Million), by Route of Administration 2024 & 2032
- Figure 28: North America Oral Transmucosal Drugs Market Volume (K Unit), by Route of Administration 2024 & 2032
- Figure 29: North America Oral Transmucosal Drugs Market Revenue Share (%), by Route of Administration 2024 & 2032
- Figure 30: North America Oral Transmucosal Drugs Market Volume Share (%), by Route of Administration 2024 & 2032
- Figure 31: North America Oral Transmucosal Drugs Market Revenue (Million), by Indication 2024 & 2032
- Figure 32: North America Oral Transmucosal Drugs Market Volume (K Unit), by Indication 2024 & 2032
- Figure 33: North America Oral Transmucosal Drugs Market Revenue Share (%), by Indication 2024 & 2032
- Figure 34: North America Oral Transmucosal Drugs Market Volume Share (%), by Indication 2024 & 2032
- Figure 35: North America Oral Transmucosal Drugs Market Revenue (Million), by Distribution Channel 2024 & 2032
- Figure 36: North America Oral Transmucosal Drugs Market Volume (K Unit), by Distribution Channel 2024 & 2032
- Figure 37: North America Oral Transmucosal Drugs Market Revenue Share (%), by Distribution Channel 2024 & 2032
- Figure 38: North America Oral Transmucosal Drugs Market Volume Share (%), by Distribution Channel 2024 & 2032
- Figure 39: North America Oral Transmucosal Drugs Market Revenue (Million), by Country 2024 & 2032
- Figure 40: North America Oral Transmucosal Drugs Market Volume (K Unit), by Country 2024 & 2032
- Figure 41: North America Oral Transmucosal Drugs Market Revenue Share (%), by Country 2024 & 2032
- Figure 42: North America Oral Transmucosal Drugs Market Volume Share (%), by Country 2024 & 2032
- Figure 43: Europe Oral Transmucosal Drugs Market Revenue (Million), by Product Type 2024 & 2032
- Figure 44: Europe Oral Transmucosal Drugs Market Volume (K Unit), by Product Type 2024 & 2032
- Figure 45: Europe Oral Transmucosal Drugs Market Revenue Share (%), by Product Type 2024 & 2032
- Figure 46: Europe Oral Transmucosal Drugs Market Volume Share (%), by Product Type 2024 & 2032
- Figure 47: Europe Oral Transmucosal Drugs Market Revenue (Million), by Route of Administration 2024 & 2032
- Figure 48: Europe Oral Transmucosal Drugs Market Volume (K Unit), by Route of Administration 2024 & 2032
- Figure 49: Europe Oral Transmucosal Drugs Market Revenue Share (%), by Route of Administration 2024 & 2032
- Figure 50: Europe Oral Transmucosal Drugs Market Volume Share (%), by Route of Administration 2024 & 2032
- Figure 51: Europe Oral Transmucosal Drugs Market Revenue (Million), by Indication 2024 & 2032
- Figure 52: Europe Oral Transmucosal Drugs Market Volume (K Unit), by Indication 2024 & 2032
- Figure 53: Europe Oral Transmucosal Drugs Market Revenue Share (%), by Indication 2024 & 2032
- Figure 54: Europe Oral Transmucosal Drugs Market Volume Share (%), by Indication 2024 & 2032
- Figure 55: Europe Oral Transmucosal Drugs Market Revenue (Million), by Distribution Channel 2024 & 2032
- Figure 56: Europe Oral Transmucosal Drugs Market Volume (K Unit), by Distribution Channel 2024 & 2032
- Figure 57: Europe Oral Transmucosal Drugs Market Revenue Share (%), by Distribution Channel 2024 & 2032
- Figure 58: Europe Oral Transmucosal Drugs Market Volume Share (%), by Distribution Channel 2024 & 2032
- Figure 59: Europe Oral Transmucosal Drugs Market Revenue (Million), by Country 2024 & 2032
- Figure 60: Europe Oral Transmucosal Drugs Market Volume (K Unit), by Country 2024 & 2032
- Figure 61: Europe Oral Transmucosal Drugs Market Revenue Share (%), by Country 2024 & 2032
- Figure 62: Europe Oral Transmucosal Drugs Market Volume Share (%), by Country 2024 & 2032
- Figure 63: Asia Pacific Oral Transmucosal Drugs Market Revenue (Million), by Product Type 2024 & 2032
- Figure 64: Asia Pacific Oral Transmucosal Drugs Market Volume (K Unit), by Product Type 2024 & 2032
- Figure 65: Asia Pacific Oral Transmucosal Drugs Market Revenue Share (%), by Product Type 2024 & 2032
- Figure 66: Asia Pacific Oral Transmucosal Drugs Market Volume Share (%), by Product Type 2024 & 2032
- Figure 67: Asia Pacific Oral Transmucosal Drugs Market Revenue (Million), by Route of Administration 2024 & 2032
- Figure 68: Asia Pacific Oral Transmucosal Drugs Market Volume (K Unit), by Route of Administration 2024 & 2032
- Figure 69: Asia Pacific Oral Transmucosal Drugs Market Revenue Share (%), by Route of Administration 2024 & 2032
- Figure 70: Asia Pacific Oral Transmucosal Drugs Market Volume Share (%), by Route of Administration 2024 & 2032
- Figure 71: Asia Pacific Oral Transmucosal Drugs Market Revenue (Million), by Indication 2024 & 2032
- Figure 72: Asia Pacific Oral Transmucosal Drugs Market Volume (K Unit), by Indication 2024 & 2032
- Figure 73: Asia Pacific Oral Transmucosal Drugs Market Revenue Share (%), by Indication 2024 & 2032
- Figure 74: Asia Pacific Oral Transmucosal Drugs Market Volume Share (%), by Indication 2024 & 2032
- Figure 75: Asia Pacific Oral Transmucosal Drugs Market Revenue (Million), by Distribution Channel 2024 & 2032
- Figure 76: Asia Pacific Oral Transmucosal Drugs Market Volume (K Unit), by Distribution Channel 2024 & 2032
- Figure 77: Asia Pacific Oral Transmucosal Drugs Market Revenue Share (%), by Distribution Channel 2024 & 2032
- Figure 78: Asia Pacific Oral Transmucosal Drugs Market Volume Share (%), by Distribution Channel 2024 & 2032
- Figure 79: Asia Pacific Oral Transmucosal Drugs Market Revenue (Million), by Country 2024 & 2032
- Figure 80: Asia Pacific Oral Transmucosal Drugs Market Volume (K Unit), by Country 2024 & 2032
- Figure 81: Asia Pacific Oral Transmucosal Drugs Market Revenue Share (%), by Country 2024 & 2032
- Figure 82: Asia Pacific Oral Transmucosal Drugs Market Volume Share (%), by Country 2024 & 2032
- Figure 83: Middle East and Africa Oral Transmucosal Drugs Market Revenue (Million), by Product Type 2024 & 2032
- Figure 84: Middle East and Africa Oral Transmucosal Drugs Market Volume (K Unit), by Product Type 2024 & 2032
- Figure 85: Middle East and Africa Oral Transmucosal Drugs Market Revenue Share (%), by Product Type 2024 & 2032
- Figure 86: Middle East and Africa Oral Transmucosal Drugs Market Volume Share (%), by Product Type 2024 & 2032
- Figure 87: Middle East and Africa Oral Transmucosal Drugs Market Revenue (Million), by Route of Administration 2024 & 2032
- Figure 88: Middle East and Africa Oral Transmucosal Drugs Market Volume (K Unit), by Route of Administration 2024 & 2032
- Figure 89: Middle East and Africa Oral Transmucosal Drugs Market Revenue Share (%), by Route of Administration 2024 & 2032
- Figure 90: Middle East and Africa Oral Transmucosal Drugs Market Volume Share (%), by Route of Administration 2024 & 2032
- Figure 91: Middle East and Africa Oral Transmucosal Drugs Market Revenue (Million), by Indication 2024 & 2032
- Figure 92: Middle East and Africa Oral Transmucosal Drugs Market Volume (K Unit), by Indication 2024 & 2032
- Figure 93: Middle East and Africa Oral Transmucosal Drugs Market Revenue Share (%), by Indication 2024 & 2032
- Figure 94: Middle East and Africa Oral Transmucosal Drugs Market Volume Share (%), by Indication 2024 & 2032
- Figure 95: Middle East and Africa Oral Transmucosal Drugs Market Revenue (Million), by Distribution Channel 2024 & 2032
- Figure 96: Middle East and Africa Oral Transmucosal Drugs Market Volume (K Unit), by Distribution Channel 2024 & 2032
- Figure 97: Middle East and Africa Oral Transmucosal Drugs Market Revenue Share (%), by Distribution Channel 2024 & 2032
- Figure 98: Middle East and Africa Oral Transmucosal Drugs Market Volume Share (%), by Distribution Channel 2024 & 2032
- Figure 99: Middle East and Africa Oral Transmucosal Drugs Market Revenue (Million), by Country 2024 & 2032
- Figure 100: Middle East and Africa Oral Transmucosal Drugs Market Volume (K Unit), by Country 2024 & 2032
- Figure 101: Middle East and Africa Oral Transmucosal Drugs Market Revenue Share (%), by Country 2024 & 2032
- Figure 102: Middle East and Africa Oral Transmucosal Drugs Market Volume Share (%), by Country 2024 & 2032
- Figure 103: South America Oral Transmucosal Drugs Market Revenue (Million), by Product Type 2024 & 2032
- Figure 104: South America Oral Transmucosal Drugs Market Volume (K Unit), by Product Type 2024 & 2032
- Figure 105: South America Oral Transmucosal Drugs Market Revenue Share (%), by Product Type 2024 & 2032
- Figure 106: South America Oral Transmucosal Drugs Market Volume Share (%), by Product Type 2024 & 2032
- Figure 107: South America Oral Transmucosal Drugs Market Revenue (Million), by Route of Administration 2024 & 2032
- Figure 108: South America Oral Transmucosal Drugs Market Volume (K Unit), by Route of Administration 2024 & 2032
- Figure 109: South America Oral Transmucosal Drugs Market Revenue Share (%), by Route of Administration 2024 & 2032
- Figure 110: South America Oral Transmucosal Drugs Market Volume Share (%), by Route of Administration 2024 & 2032
- Figure 111: South America Oral Transmucosal Drugs Market Revenue (Million), by Indication 2024 & 2032
- Figure 112: South America Oral Transmucosal Drugs Market Volume (K Unit), by Indication 2024 & 2032
- Figure 113: South America Oral Transmucosal Drugs Market Revenue Share (%), by Indication 2024 & 2032
- Figure 114: South America Oral Transmucosal Drugs Market Volume Share (%), by Indication 2024 & 2032
- Figure 115: South America Oral Transmucosal Drugs Market Revenue (Million), by Distribution Channel 2024 & 2032
- Figure 116: South America Oral Transmucosal Drugs Market Volume (K Unit), by Distribution Channel 2024 & 2032
- Figure 117: South America Oral Transmucosal Drugs Market Revenue Share (%), by Distribution Channel 2024 & 2032
- Figure 118: South America Oral Transmucosal Drugs Market Volume Share (%), by Distribution Channel 2024 & 2032
- Figure 119: South America Oral Transmucosal Drugs Market Revenue (Million), by Country 2024 & 2032
- Figure 120: South America Oral Transmucosal Drugs Market Volume (K Unit), by Country 2024 & 2032
- Figure 121: South America Oral Transmucosal Drugs Market Revenue Share (%), by Country 2024 & 2032
- Figure 122: South America Oral Transmucosal Drugs Market Volume Share (%), by Country 2024 & 2032
List of Tables
- Table 1: Global Oral Transmucosal Drugs Market Revenue Million Forecast, by Region 2019 & 2032
- Table 2: Global Oral Transmucosal Drugs Market Volume K Unit Forecast, by Region 2019 & 2032
- Table 3: Global Oral Transmucosal Drugs Market Revenue Million Forecast, by Product Type 2019 & 2032
- Table 4: Global Oral Transmucosal Drugs Market Volume K Unit Forecast, by Product Type 2019 & 2032
- Table 5: Global Oral Transmucosal Drugs Market Revenue Million Forecast, by Route of Administration 2019 & 2032
- Table 6: Global Oral Transmucosal Drugs Market Volume K Unit Forecast, by Route of Administration 2019 & 2032
- Table 7: Global Oral Transmucosal Drugs Market Revenue Million Forecast, by Indication 2019 & 2032
- Table 8: Global Oral Transmucosal Drugs Market Volume K Unit Forecast, by Indication 2019 & 2032
- Table 9: Global Oral Transmucosal Drugs Market Revenue Million Forecast, by Distribution Channel 2019 & 2032
- Table 10: Global Oral Transmucosal Drugs Market Volume K Unit Forecast, by Distribution Channel 2019 & 2032
- Table 11: Global Oral Transmucosal Drugs Market Revenue Million Forecast, by Region 2019 & 2032
- Table 12: Global Oral Transmucosal Drugs Market Volume K Unit Forecast, by Region 2019 & 2032
- Table 13: Global Oral Transmucosal Drugs Market Revenue Million Forecast, by Country 2019 & 2032
- Table 14: Global Oral Transmucosal Drugs Market Volume K Unit Forecast, by Country 2019 & 2032
- Table 15: United States Oral Transmucosal Drugs Market Revenue (Million) Forecast, by Application 2019 & 2032
- Table 16: United States Oral Transmucosal Drugs Market Volume (K Unit) Forecast, by Application 2019 & 2032
- Table 17: Canada Oral Transmucosal Drugs Market Revenue (Million) Forecast, by Application 2019 & 2032
- Table 18: Canada Oral Transmucosal Drugs Market Volume (K Unit) Forecast, by Application 2019 & 2032
- Table 19: Mexico Oral Transmucosal Drugs Market Revenue (Million) Forecast, by Application 2019 & 2032
- Table 20: Mexico Oral Transmucosal Drugs Market Volume (K Unit) Forecast, by Application 2019 & 2032
- Table 21: Global Oral Transmucosal Drugs Market Revenue Million Forecast, by Country 2019 & 2032
- Table 22: Global Oral Transmucosal Drugs Market Volume K Unit Forecast, by Country 2019 & 2032
- Table 23: Germany Oral Transmucosal Drugs Market Revenue (Million) Forecast, by Application 2019 & 2032
- Table 24: Germany Oral Transmucosal Drugs Market Volume (K Unit) Forecast, by Application 2019 & 2032
- Table 25: United Kingdom Oral Transmucosal Drugs Market Revenue (Million) Forecast, by Application 2019 & 2032
- Table 26: United Kingdom Oral Transmucosal Drugs Market Volume (K Unit) Forecast, by Application 2019 & 2032
- Table 27: France Oral Transmucosal Drugs Market Revenue (Million) Forecast, by Application 2019 & 2032
- Table 28: France Oral Transmucosal Drugs Market Volume (K Unit) Forecast, by Application 2019 & 2032
- Table 29: Italy Oral Transmucosal Drugs Market Revenue (Million) Forecast, by Application 2019 & 2032
- Table 30: Italy Oral Transmucosal Drugs Market Volume (K Unit) Forecast, by Application 2019 & 2032
- Table 31: Spain Oral Transmucosal Drugs Market Revenue (Million) Forecast, by Application 2019 & 2032
- Table 32: Spain Oral Transmucosal Drugs Market Volume (K Unit) Forecast, by Application 2019 & 2032
- Table 33: Rest of Europe Oral Transmucosal Drugs Market Revenue (Million) Forecast, by Application 2019 & 2032
- Table 34: Rest of Europe Oral Transmucosal Drugs Market Volume (K Unit) Forecast, by Application 2019 & 2032
- Table 35: Global Oral Transmucosal Drugs Market Revenue Million Forecast, by Country 2019 & 2032
- Table 36: Global Oral Transmucosal Drugs Market Volume K Unit Forecast, by Country 2019 & 2032
- Table 37: China Oral Transmucosal Drugs Market Revenue (Million) Forecast, by Application 2019 & 2032
- Table 38: China Oral Transmucosal Drugs Market Volume (K Unit) Forecast, by Application 2019 & 2032
- Table 39: Japan Oral Transmucosal Drugs Market Revenue (Million) Forecast, by Application 2019 & 2032
- Table 40: Japan Oral Transmucosal Drugs Market Volume (K Unit) Forecast, by Application 2019 & 2032
- Table 41: India Oral Transmucosal Drugs Market Revenue (Million) Forecast, by Application 2019 & 2032
- Table 42: India Oral Transmucosal Drugs Market Volume (K Unit) Forecast, by Application 2019 & 2032
- Table 43: Australia Oral Transmucosal Drugs Market Revenue (Million) Forecast, by Application 2019 & 2032
- Table 44: Australia Oral Transmucosal Drugs Market Volume (K Unit) Forecast, by Application 2019 & 2032
- Table 45: South Korea Oral Transmucosal Drugs Market Revenue (Million) Forecast, by Application 2019 & 2032
- Table 46: South Korea Oral Transmucosal Drugs Market Volume (K Unit) Forecast, by Application 2019 & 2032
- Table 47: Rest of Asia Pacific Oral Transmucosal Drugs Market Revenue (Million) Forecast, by Application 2019 & 2032
- Table 48: Rest of Asia Pacific Oral Transmucosal Drugs Market Volume (K Unit) Forecast, by Application 2019 & 2032
- Table 49: Global Oral Transmucosal Drugs Market Revenue Million Forecast, by Country 2019 & 2032
- Table 50: Global Oral Transmucosal Drugs Market Volume K Unit Forecast, by Country 2019 & 2032
- Table 51: GCC Oral Transmucosal Drugs Market Revenue (Million) Forecast, by Application 2019 & 2032
- Table 52: GCC Oral Transmucosal Drugs Market Volume (K Unit) Forecast, by Application 2019 & 2032
- Table 53: South Africa Oral Transmucosal Drugs Market Revenue (Million) Forecast, by Application 2019 & 2032
- Table 54: South Africa Oral Transmucosal Drugs Market Volume (K Unit) Forecast, by Application 2019 & 2032
- Table 55: Rest of Middle East and Africa Oral Transmucosal Drugs Market Revenue (Million) Forecast, by Application 2019 & 2032
- Table 56: Rest of Middle East and Africa Oral Transmucosal Drugs Market Volume (K Unit) Forecast, by Application 2019 & 2032
- Table 57: Global Oral Transmucosal Drugs Market Revenue Million Forecast, by Country 2019 & 2032
- Table 58: Global Oral Transmucosal Drugs Market Volume K Unit Forecast, by Country 2019 & 2032
- Table 59: Brazil Oral Transmucosal Drugs Market Revenue (Million) Forecast, by Application 2019 & 2032
- Table 60: Brazil Oral Transmucosal Drugs Market Volume (K Unit) Forecast, by Application 2019 & 2032
- Table 61: Argentina Oral Transmucosal Drugs Market Revenue (Million) Forecast, by Application 2019 & 2032
- Table 62: Argentina Oral Transmucosal Drugs Market Volume (K Unit) Forecast, by Application 2019 & 2032
- Table 63: Rest of South America Oral Transmucosal Drugs Market Revenue (Million) Forecast, by Application 2019 & 2032
- Table 64: Rest of South America Oral Transmucosal Drugs Market Volume (K Unit) Forecast, by Application 2019 & 2032
- Table 65: Global Oral Transmucosal Drugs Market Revenue Million Forecast, by Product Type 2019 & 2032
- Table 66: Global Oral Transmucosal Drugs Market Volume K Unit Forecast, by Product Type 2019 & 2032
- Table 67: Global Oral Transmucosal Drugs Market Revenue Million Forecast, by Route of Administration 2019 & 2032
- Table 68: Global Oral Transmucosal Drugs Market Volume K Unit Forecast, by Route of Administration 2019 & 2032
- Table 69: Global Oral Transmucosal Drugs Market Revenue Million Forecast, by Indication 2019 & 2032
- Table 70: Global Oral Transmucosal Drugs Market Volume K Unit Forecast, by Indication 2019 & 2032
- Table 71: Global Oral Transmucosal Drugs Market Revenue Million Forecast, by Distribution Channel 2019 & 2032
- Table 72: Global Oral Transmucosal Drugs Market Volume K Unit Forecast, by Distribution Channel 2019 & 2032
- Table 73: Global Oral Transmucosal Drugs Market Revenue Million Forecast, by Country 2019 & 2032
- Table 74: Global Oral Transmucosal Drugs Market Volume K Unit Forecast, by Country 2019 & 2032
- Table 75: United States Oral Transmucosal Drugs Market Revenue (Million) Forecast, by Application 2019 & 2032
- Table 76: United States Oral Transmucosal Drugs Market Volume (K Unit) Forecast, by Application 2019 & 2032
- Table 77: Canada Oral Transmucosal Drugs Market Revenue (Million) Forecast, by Application 2019 & 2032
- Table 78: Canada Oral Transmucosal Drugs Market Volume (K Unit) Forecast, by Application 2019 & 2032
- Table 79: Mexico Oral Transmucosal Drugs Market Revenue (Million) Forecast, by Application 2019 & 2032
- Table 80: Mexico Oral Transmucosal Drugs Market Volume (K Unit) Forecast, by Application 2019 & 2032
- Table 81: Global Oral Transmucosal Drugs Market Revenue Million Forecast, by Product Type 2019 & 2032
- Table 82: Global Oral Transmucosal Drugs Market Volume K Unit Forecast, by Product Type 2019 & 2032
- Table 83: Global Oral Transmucosal Drugs Market Revenue Million Forecast, by Route of Administration 2019 & 2032
- Table 84: Global Oral Transmucosal Drugs Market Volume K Unit Forecast, by Route of Administration 2019 & 2032
- Table 85: Global Oral Transmucosal Drugs Market Revenue Million Forecast, by Indication 2019 & 2032
- Table 86: Global Oral Transmucosal Drugs Market Volume K Unit Forecast, by Indication 2019 & 2032
- Table 87: Global Oral Transmucosal Drugs Market Revenue Million Forecast, by Distribution Channel 2019 & 2032
- Table 88: Global Oral Transmucosal Drugs Market Volume K Unit Forecast, by Distribution Channel 2019 & 2032
- Table 89: Global Oral Transmucosal Drugs Market Revenue Million Forecast, by Country 2019 & 2032
- Table 90: Global Oral Transmucosal Drugs Market Volume K Unit Forecast, by Country 2019 & 2032
- Table 91: Germany Oral Transmucosal Drugs Market Revenue (Million) Forecast, by Application 2019 & 2032
- Table 92: Germany Oral Transmucosal Drugs Market Volume (K Unit) Forecast, by Application 2019 & 2032
- Table 93: United Kingdom Oral Transmucosal Drugs Market Revenue (Million) Forecast, by Application 2019 & 2032
- Table 94: United Kingdom Oral Transmucosal Drugs Market Volume (K Unit) Forecast, by Application 2019 & 2032
- Table 95: France Oral Transmucosal Drugs Market Revenue (Million) Forecast, by Application 2019 & 2032
- Table 96: France Oral Transmucosal Drugs Market Volume (K Unit) Forecast, by Application 2019 & 2032
- Table 97: Italy Oral Transmucosal Drugs Market Revenue (Million) Forecast, by Application 2019 & 2032
- Table 98: Italy Oral Transmucosal Drugs Market Volume (K Unit) Forecast, by Application 2019 & 2032
- Table 99: Spain Oral Transmucosal Drugs Market Revenue (Million) Forecast, by Application 2019 & 2032
- Table 100: Spain Oral Transmucosal Drugs Market Volume (K Unit) Forecast, by Application 2019 & 2032
- Table 101: Rest of Europe Oral Transmucosal Drugs Market Revenue (Million) Forecast, by Application 2019 & 2032
- Table 102: Rest of Europe Oral Transmucosal Drugs Market Volume (K Unit) Forecast, by Application 2019 & 2032
- Table 103: Global Oral Transmucosal Drugs Market Revenue Million Forecast, by Product Type 2019 & 2032
- Table 104: Global Oral Transmucosal Drugs Market Volume K Unit Forecast, by Product Type 2019 & 2032
- Table 105: Global Oral Transmucosal Drugs Market Revenue Million Forecast, by Route of Administration 2019 & 2032
- Table 106: Global Oral Transmucosal Drugs Market Volume K Unit Forecast, by Route of Administration 2019 & 2032
- Table 107: Global Oral Transmucosal Drugs Market Revenue Million Forecast, by Indication 2019 & 2032
- Table 108: Global Oral Transmucosal Drugs Market Volume K Unit Forecast, by Indication 2019 & 2032
- Table 109: Global Oral Transmucosal Drugs Market Revenue Million Forecast, by Distribution Channel 2019 & 2032
- Table 110: Global Oral Transmucosal Drugs Market Volume K Unit Forecast, by Distribution Channel 2019 & 2032
- Table 111: Global Oral Transmucosal Drugs Market Revenue Million Forecast, by Country 2019 & 2032
- Table 112: Global Oral Transmucosal Drugs Market Volume K Unit Forecast, by Country 2019 & 2032
- Table 113: China Oral Transmucosal Drugs Market Revenue (Million) Forecast, by Application 2019 & 2032
- Table 114: China Oral Transmucosal Drugs Market Volume (K Unit) Forecast, by Application 2019 & 2032
- Table 115: Japan Oral Transmucosal Drugs Market Revenue (Million) Forecast, by Application 2019 & 2032
- Table 116: Japan Oral Transmucosal Drugs Market Volume (K Unit) Forecast, by Application 2019 & 2032
- Table 117: India Oral Transmucosal Drugs Market Revenue (Million) Forecast, by Application 2019 & 2032
- Table 118: India Oral Transmucosal Drugs Market Volume (K Unit) Forecast, by Application 2019 & 2032
- Table 119: Australia Oral Transmucosal Drugs Market Revenue (Million) Forecast, by Application 2019 & 2032
- Table 120: Australia Oral Transmucosal Drugs Market Volume (K Unit) Forecast, by Application 2019 & 2032
- Table 121: South Korea Oral Transmucosal Drugs Market Revenue (Million) Forecast, by Application 2019 & 2032
- Table 122: South Korea Oral Transmucosal Drugs Market Volume (K Unit) Forecast, by Application 2019 & 2032
- Table 123: Rest of Asia Pacific Oral Transmucosal Drugs Market Revenue (Million) Forecast, by Application 2019 & 2032
- Table 124: Rest of Asia Pacific Oral Transmucosal Drugs Market Volume (K Unit) Forecast, by Application 2019 & 2032
- Table 125: Global Oral Transmucosal Drugs Market Revenue Million Forecast, by Product Type 2019 & 2032
- Table 126: Global Oral Transmucosal Drugs Market Volume K Unit Forecast, by Product Type 2019 & 2032
- Table 127: Global Oral Transmucosal Drugs Market Revenue Million Forecast, by Route of Administration 2019 & 2032
- Table 128: Global Oral Transmucosal Drugs Market Volume K Unit Forecast, by Route of Administration 2019 & 2032
- Table 129: Global Oral Transmucosal Drugs Market Revenue Million Forecast, by Indication 2019 & 2032
- Table 130: Global Oral Transmucosal Drugs Market Volume K Unit Forecast, by Indication 2019 & 2032
- Table 131: Global Oral Transmucosal Drugs Market Revenue Million Forecast, by Distribution Channel 2019 & 2032
- Table 132: Global Oral Transmucosal Drugs Market Volume K Unit Forecast, by Distribution Channel 2019 & 2032
- Table 133: Global Oral Transmucosal Drugs Market Revenue Million Forecast, by Country 2019 & 2032
- Table 134: Global Oral Transmucosal Drugs Market Volume K Unit Forecast, by Country 2019 & 2032
- Table 135: GCC Oral Transmucosal Drugs Market Revenue (Million) Forecast, by Application 2019 & 2032
- Table 136: GCC Oral Transmucosal Drugs Market Volume (K Unit) Forecast, by Application 2019 & 2032
- Table 137: South Africa Oral Transmucosal Drugs Market Revenue (Million) Forecast, by Application 2019 & 2032
- Table 138: South Africa Oral Transmucosal Drugs Market Volume (K Unit) Forecast, by Application 2019 & 2032
- Table 139: Rest of Middle East and Africa Oral Transmucosal Drugs Market Revenue (Million) Forecast, by Application 2019 & 2032
- Table 140: Rest of Middle East and Africa Oral Transmucosal Drugs Market Volume (K Unit) Forecast, by Application 2019 & 2032
- Table 141: Global Oral Transmucosal Drugs Market Revenue Million Forecast, by Product Type 2019 & 2032
- Table 142: Global Oral Transmucosal Drugs Market Volume K Unit Forecast, by Product Type 2019 & 2032
- Table 143: Global Oral Transmucosal Drugs Market Revenue Million Forecast, by Route of Administration 2019 & 2032
- Table 144: Global Oral Transmucosal Drugs Market Volume K Unit Forecast, by Route of Administration 2019 & 2032
- Table 145: Global Oral Transmucosal Drugs Market Revenue Million Forecast, by Indication 2019 & 2032
- Table 146: Global Oral Transmucosal Drugs Market Volume K Unit Forecast, by Indication 2019 & 2032
- Table 147: Global Oral Transmucosal Drugs Market Revenue Million Forecast, by Distribution Channel 2019 & 2032
- Table 148: Global Oral Transmucosal Drugs Market Volume K Unit Forecast, by Distribution Channel 2019 & 2032
- Table 149: Global Oral Transmucosal Drugs Market Revenue Million Forecast, by Country 2019 & 2032
- Table 150: Global Oral Transmucosal Drugs Market Volume K Unit Forecast, by Country 2019 & 2032
- Table 151: Brazil Oral Transmucosal Drugs Market Revenue (Million) Forecast, by Application 2019 & 2032
- Table 152: Brazil Oral Transmucosal Drugs Market Volume (K Unit) Forecast, by Application 2019 & 2032
- Table 153: Argentina Oral Transmucosal Drugs Market Revenue (Million) Forecast, by Application 2019 & 2032
- Table 154: Argentina Oral Transmucosal Drugs Market Volume (K Unit) Forecast, by Application 2019 & 2032
- Table 155: Rest of South America Oral Transmucosal Drugs Market Revenue (Million) Forecast, by Application 2019 & 2032
- Table 156: Rest of South America Oral Transmucosal Drugs Market Volume (K Unit) Forecast, by Application 2019 & 2032
Frequently Asked Questions
1. What is the projected Compound Annual Growth Rate (CAGR) of the Oral Transmucosal Drugs Market?
The projected CAGR is approximately 7.40%.
2. Which companies are prominent players in the Oral Transmucosal Drugs Market?
Key companies in the market include Sunovion Pharmaceuticals Inc, Seoul Pharmaceuticals, Shilpa Therapeutics, Novartis AG, Aquestive Therapeutics Inc, ZIM Laboratories Limited, GW Pharmaceuticals plc , C L Pharm Co Ltd, IntelGenx Corp, Pfizer Inc.
3. What are the main segments of the Oral Transmucosal Drugs Market?
The market segments include Product Type, Route of Administration, Indication, Distribution Channel.
4. Can you provide details about the market size?
The market size is estimated to be USD XX Million as of 2022.
5. What are some drivers contributing to market growth?
Growing Burden of Target Diseases; Rise in R&D Activities and Product Launches.
6. What are the notable trends driving market growth?
Tablets segment is Expected to Hold a Significant Share Over the Forecast Period.
7. Are there any restraints impacting market growth?
Disadvantages Associated With Oral Transmucosal Drug Delivery.
8. Can you provide examples of recent developments in the market?
In September 2021, IntelGenx Corp. launched RIZAPORT in Spain. Exeltis Healthcare S.L. is a commercialization partner of IntelGenx Corp. in the European Union for RIZAPORT. It is an oral film formulation of rizatriptan benzoate.
9. What pricing options are available for accessing the report?
Pricing options include single-user, multi-user, and enterprise licenses priced at USD 4750, USD 5250, and USD 8750 respectively.
10. Is the market size provided in terms of value or volume?
The market size is provided in terms of value, measured in Million and volume, measured in K Unit.
11. Are there any specific market keywords associated with the report?
Yes, the market keyword associated with the report is "Oral Transmucosal Drugs Market," which aids in identifying and referencing the specific market segment covered.
12. How do I determine which pricing option suits my needs best?
The pricing options vary based on user requirements and access needs. Individual users may opt for single-user licenses, while businesses requiring broader access may choose multi-user or enterprise licenses for cost-effective access to the report.
13. Are there any additional resources or data provided in the Oral Transmucosal Drugs Market report?
While the report offers comprehensive insights, it's advisable to review the specific contents or supplementary materials provided to ascertain if additional resources or data are available.
14. How can I stay updated on further developments or reports in the Oral Transmucosal Drugs Market?
To stay informed about further developments, trends, and reports in the Oral Transmucosal Drugs Market, consider subscribing to industry newsletters, following relevant companies and organizations, or regularly checking reputable industry news sources and publications.
Methodology
Step 1 - Identification of Relevant Samples Size from Population Database


Step 2 - Approaches for Defining Global Market Size (Value, Volume* & Price*)

Note*: In applicable scenarios
Step 3 - Data Sources
Primary Research
- Web Analytics
- Survey Reports
- Research Institute
- Latest Research Reports
- Opinion Leaders
Secondary Research
- Annual Reports
- White Paper
- Latest Press Release
- Industry Association
- Paid Database
- Investor Presentations

Step 4 - Data Triangulation
Involves using different sources of information in order to increase the validity of a study
These sources are likely to be stakeholders in a program - participants, other researchers, program staff, other community members, and so on.
Then we put all data in single framework & apply various statistical tools to find out the dynamic on the market.
During the analysis stage, feedback from the stakeholder groups would be compared to determine areas of agreement as well as areas of divergence


