

Key Insights
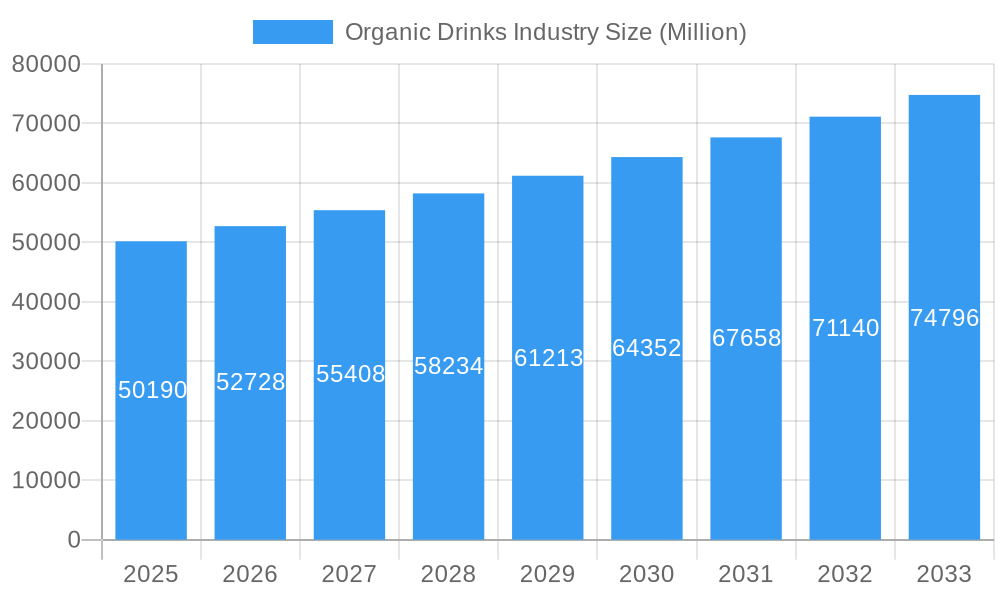
The organic drinks market, valued at $50.19 billion in 2025, is projected to experience robust growth, driven by escalating consumer demand for healthier alternatives and increasing awareness of the benefits of organic products. A compound annual growth rate (CAGR) of 4.91% from 2025 to 2033 indicates a significant expansion of this market. Key drivers include the rising prevalence of health-conscious consumers seeking natural and sustainably sourced beverages, coupled with increased disposable incomes in developing economies fueling premium product consumption. The growing popularity of plant-based and functional beverages, along with the expansion of e-commerce channels, further contributes to market growth. While the market faces constraints such as higher production costs compared to conventional drinks and potential supply chain vulnerabilities related to organic farming practices, the long-term outlook remains positive. The segmentation reveals significant potential within various product types (alcoholic and non-alcoholic organic beverages), with non-alcoholic options potentially leading growth due to health concerns. Distribution channels show a blend of traditional (supermarkets, convenience stores, specialist retailers) and emerging (online) platforms, each exhibiting unique growth trajectories. Companies such as Nestlé, PepsiCo, and Anheuser-Busch InBev are actively investing in the organic drinks sector, underscoring its strategic importance. Regional disparities exist, with North America and Europe currently holding larger market shares, yet significant growth opportunities exist in the Asia-Pacific region due to its expanding middle class and rising health awareness.
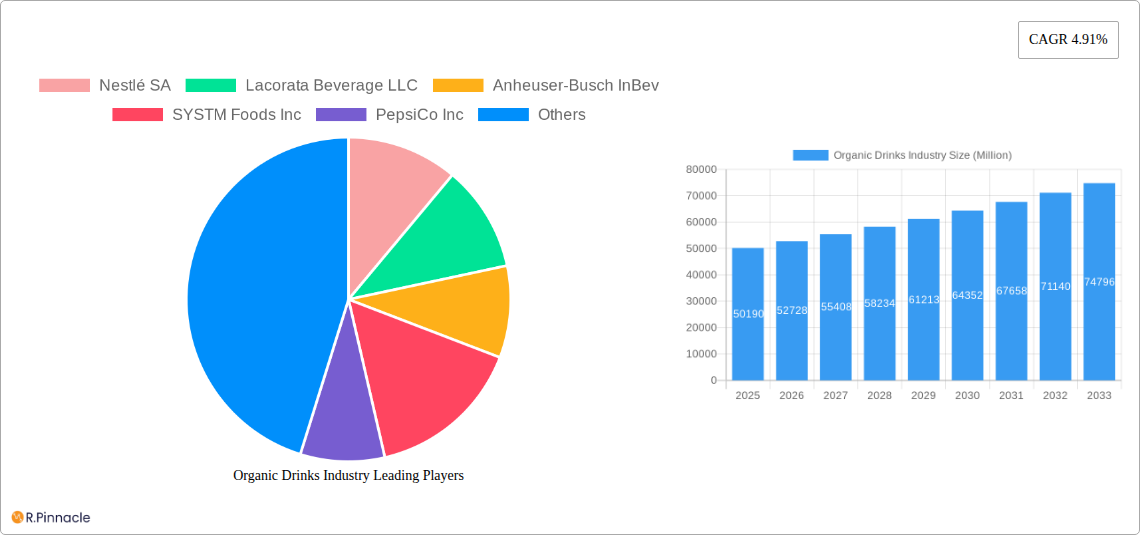
Organic Drinks Industry Market Size (In Billion)
The competitive landscape is characterized by a mix of large multinational corporations and smaller, specialized organic beverage producers. The presence of both large players and niche brands suggests a diverse market with opportunities for both established and emerging companies. Future growth will likely be shaped by advancements in sustainable packaging, innovative product development (e.g., incorporating superfoods and functional ingredients), and effective marketing campaigns that highlight the health and environmental benefits of organic drinks. Maintaining consistent supply chain management and addressing consumer concerns about pricing will be crucial for sustained growth. Government regulations promoting organic farming and labeling practices also influence the industry trajectory positively. The projected growth forecasts reflect a considerable expansion in the organic drinks market, driven by favorable consumer trends and strategic investments by key players, making it an attractive sector for both investment and consumer engagement.
Organic Drinks Industry Company Market Share
Organic Drinks Industry Report: 2019-2033
This comprehensive report provides a detailed analysis of the global organic drinks market, offering invaluable insights for industry professionals, investors, and stakeholders. Covering the period from 2019 to 2033, with a focus on 2025, this report delves into market dynamics, competitive landscapes, and future growth projections, highlighting key opportunities and challenges. The market is valued at xx Million in 2025 and is projected to reach xx Million by 2033, exhibiting a CAGR of xx%.
Organic Drinks Industry Market Structure & Innovation Trends
This section analyzes the competitive landscape of the organic drinks market, focusing on market concentration, innovation drivers, regulatory frameworks, product substitutes, end-user demographics, and mergers & acquisitions (M&A) activities.
The organic drinks market exhibits a moderately concentrated structure, with key players such as Nestlé SA, PepsiCo Inc, and Danone SA holding significant market share. However, smaller, specialized brands also contribute significantly, particularly in niche segments. Market share data for 2025 reveals Nestlé SA holds approximately xx% market share, followed by PepsiCo Inc at xx% and Danone SA at xx%. The remaining share is distributed among numerous smaller players.
Innovation is a key driver, with companies focusing on developing new product types, flavors, and packaging formats to meet evolving consumer preferences. Regulatory frameworks, particularly regarding organic certification and labeling, significantly impact market dynamics. Product substitutes, such as conventionally produced beverages, pose a constant competitive threat. The end-user demographic is largely health-conscious individuals across various age groups, with increasing demand from millennials and Gen Z.
M&A activity has been significant. For instance, the June 2022 acquisition of Chameleon Organic Coffee by SYSTM Foods Inc. showcases the consolidation trend within the industry. The deal value was estimated at xx Million. Other significant M&A activities, while not publicly disclosed in terms of value, contributed to market consolidation and reshaping competitive dynamics.
Organic Drinks Industry Market Dynamics & Trends
This section explores the market's growth drivers, technological disruptions, consumer preferences, and competitive dynamics.
The organic drinks market is experiencing robust growth, driven by increasing consumer awareness of health and wellness, rising disposable incomes in developing economies, and the growing preference for natural and sustainable products. Technological advancements, such as improved packaging and production techniques, further fuel market expansion. The shift towards healthier lifestyles and the growing popularity of functional beverages are key consumer trends shaping demand.
Competitive dynamics are intense, with established players and new entrants vying for market share through innovation, brand building, and strategic partnerships. The market penetration of organic drinks is steadily increasing, with a projected xx% penetration rate by 2033. The CAGR for the forecast period (2025-2033) is estimated at xx%.
Dominant Regions & Segments in Organic Drinks Industry
This section highlights the leading regions and segments within the organic drinks market.
Dominant Region: North America currently holds the largest market share, driven by high consumer awareness of health and wellness and a well-established organic food and beverage industry. Key drivers include strong consumer spending, robust retail infrastructure, and favorable government policies supporting organic agriculture. Europe is another significant region, with a mature organic market and a strong focus on sustainability. Asia-Pacific exhibits high growth potential due to rising disposable incomes and increasing health consciousness.
Dominant Segments:
Product Type: The non-alcoholic segment, encompassing organic juices, teas, and waters, dominates the market, driven by broader consumer appeal and health benefits. The alcoholic segment is a smaller but rapidly growing sector, with increasing interest in organic beers, wines, and spirits.
Distribution Channel: Supermarkets/hypermarkets constitute the largest distribution channel, offering extensive reach and convenience. Online retailers are also gaining traction, providing consumers with convenient access to a wide selection of organic drinks. Convenience stores and specialist retailers play a significant, albeit smaller, role.
Organic Drinks Industry Product Innovations
Recent years have witnessed significant innovation in the organic drinks sector. New product launches, such as Graasi Barley Water's RTD organic waters and Anheuser-Busch InBev's Michelob Ultra organic hard seltzers, exemplify the ongoing trend towards healthier and more diverse options. Technological advancements in packaging, such as sustainable and eco-friendly alternatives, are gaining traction. Product innovation is crucial for meeting evolving consumer preferences and maintaining a competitive edge.
Report Scope & Segmentation Analysis
This report segments the organic drinks market by product type (alcoholic and non-alcoholic), and distribution channel (supermarkets/hypermarkets, convenience stores, specialist retailers, online retailers, and other distribution channels). Each segment's growth projections, market size, and competitive dynamics are analyzed in detail. The alcoholic segment is expected to exhibit a higher CAGR than the non-alcoholic segment over the forecast period due to increasing demand for premium organic alcoholic beverages. The online retail channel is projected to experience substantial growth due to rising e-commerce adoption.
Key Drivers of Organic Drinks Industry Growth
Several factors drive the growth of the organic drinks industry. Increasing consumer awareness of health benefits is a primary driver, along with the growing preference for natural and sustainable products. Favorable government regulations supporting organic farming and production also contribute. Technological advancements in production and packaging play a significant role, enhancing efficiency and product quality.
Challenges in the Organic Drinks Industry Sector
The organic drinks industry faces challenges, including higher production costs compared to conventional beverages, stringent organic certification requirements, and supply chain complexities. Competition from established beverage companies and the price sensitivity of some consumers also pose obstacles. The impact of these challenges on overall market growth is estimated at a projected xx% reduction in potential growth by 2033.
Emerging Opportunities in Organic Drinks Industry
The organic drinks market presents numerous opportunities. The growing demand for functional beverages with added health benefits, the expansion into new markets, particularly in developing economies, and the increasing adoption of sustainable packaging solutions are key opportunities. The development of innovative products catering to niche consumer preferences presents a significant growth pathway.
Leading Players in the Organic Drinks Industry Market
- Nestlé SA
- Lacorata Beverage LLC
- Anheuser-Busch InBev
- SYSTM Foods Inc
- PepsiCo Inc
- Whitewave Foods Company
- James White Drinks
- Bison Organic Beer
- Danone SA
- Organic Valley
- PS Organic LLC
- Drake's Organic Spirits LLC
Key Developments in Organic Drinks Industry
- June 2022: SYSTM Foods Inc. acquired Chameleon Organic Coffee from Nestlé USA, expanding its portfolio of ready-to-drink organic beverages.
- March 2022: Graasi Barley Water introduced a new line of ready-to-drink organic waters, diversifying the market with new flavors.
- March 2022: Anheuser-Busch InBev launched a new line of Michelob Ultra organic hard seltzers, expanding into the growing organic alcoholic beverage segment.
Future Outlook for Organic Drinks Industry Market
The organic drinks market is poised for continued growth, driven by increasing health consciousness and sustainability concerns. Innovation in product offerings, coupled with strategic partnerships and expansion into new markets, will be key to achieving future success. The market's potential is substantial, with significant growth opportunities across various segments and geographic regions.
Organic Drinks Industry Segmentation
-
1. Product Type
-
1.1. Alcoholic
- 1.1.1. Wine
- 1.1.2. Beer
- 1.1.3. Spirits
- 1.1.4. Other Alcoholic Beverages
-
1.2. Non-alcoholic
- 1.2.1. Fruit and Vegetable Juices
- 1.2.2. Dairy
- 1.2.3. Coffee and Tea
- 1.2.4. Other Non-alcoholic Beverages
-
1.1. Alcoholic
-
2. Distribution Channel
- 2.1. Supermarkets/Hypermarkets
- 2.2. Convenience Stores
- 2.3. Specialist Retailers
- 2.4. Online Retailers
- 2.5. Other Distribution Channels
Organic Drinks Industry Segmentation By Geography
-
1. North America
- 1.1. United States
- 1.2. Canada
- 1.3. Mexico
- 1.4. Rest of North America
-
2. Europe
- 2.1. Spain
- 2.2. United Kingdom
- 2.3. Germany
- 2.4. France
- 2.5. Italy
- 2.6. Russia
- 2.7. Rest of Europe
-
3. Asia Pacific
- 3.1. China
- 3.2. Japan
- 3.3. India
- 3.4. Australia
- 3.5. Rest of Asia Pacific
-
4. South America
- 4.1. Brazil
- 4.2. Argentina
- 4.3. Rest of South America
-
5. Middle East and Africa
- 5.1. South Africa
- 5.2. United Arab Emirates
- 5.3. Rest of Middle East and Africa
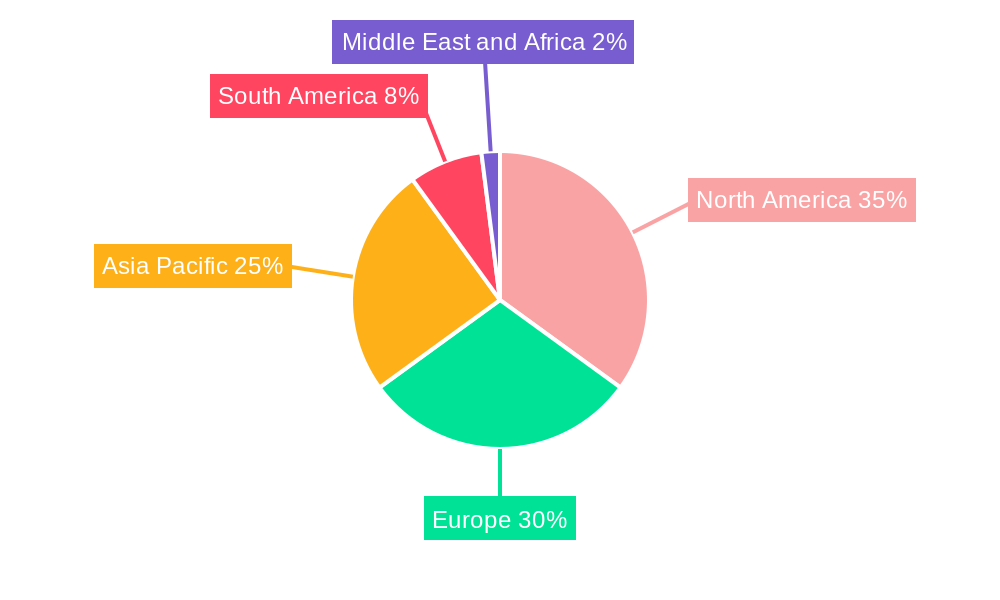
Organic Drinks Industry Regional Market Share
Geographic Coverage of Organic Drinks Industry
Organic Drinks Industry REPORT HIGHLIGHTS
| Aspects | Details |
|---|---|
| Study Period | 2020-2034 |
| Base Year | 2025 |
| Estimated Year | 2026 |
| Forecast Period | 2026-2034 |
| Historical Period | 2020-2025 |
| Growth Rate | CAGR of 4.91% from 2020-2034 |
| Segmentation |
|
Table of Contents
- 1. Introduction
- 1.1. Research Scope
- 1.2. Market Segmentation
- 1.3. Research Objective
- 1.4. Definitions and Assumptions
- 2. Executive Summary
- 2.1. Market Snapshot
- 3. Market Dynamics
- 3.1. Market Drivers
- 3.2. Market Restrains
- 3.3. Market Trends
- 3.4. Market Opportunities
- 4. Market Factor Analysis
- 4.1. Porters Five Forces
- 4.1.1. Bargaining Power of Suppliers
- 4.1.2. Bargaining Power of Buyers
- 4.1.3. Threat of New Entrants
- 4.1.4. Threat of Substitutes
- 4.1.5. Competitive Rivalry
- 4.2. PESTEL analysis
- 4.3. BCG Analysis
- 4.3.1. Stars (High Growth, High Market Share)
- 4.3.2. Cash Cows (Low Growth, High Market Share)
- 4.3.3. Question Mark (High Growth, Low Market Share)
- 4.3.4. Dogs (Low Growth, Low Market Share)
- 4.4. Ansoff Matrix Analysis
- 4.5. Supply Chain Analysis
- 4.6. Regulatory Landscape
- 4.7. Current Market Potential and Opportunity Assessment (TAM–SAM–SOM Framework)
- 4.8. PRI Analyst Note
- 4.1. Porters Five Forces
- 5. Market Analysis, Insights and Forecast 2021-2033
- 5.1. Market Analysis, Insights and Forecast - by Product Type
- 5.1.1. Alcoholic
- 5.1.1.1. Wine
- 5.1.1.2. Beer
- 5.1.1.3. Spirits
- 5.1.1.4. Other Alcoholic Beverages
- 5.1.2. Non-alcoholic
- 5.1.2.1. Fruit and Vegetable Juices
- 5.1.2.2. Dairy
- 5.1.2.3. Coffee and Tea
- 5.1.2.4. Other Non-alcoholic Beverages
- 5.1.1. Alcoholic
- 5.2. Market Analysis, Insights and Forecast - by Distribution Channel
- 5.2.1. Supermarkets/Hypermarkets
- 5.2.2. Convenience Stores
- 5.2.3. Specialist Retailers
- 5.2.4. Online Retailers
- 5.2.5. Other Distribution Channels
- 5.3. Market Analysis, Insights and Forecast - by Region
- 5.3.1. North America
- 5.3.2. Europe
- 5.3.3. Asia Pacific
- 5.3.4. South America
- 5.3.5. Middle East and Africa
- 5.1. Market Analysis, Insights and Forecast - by Product Type
- 6. Global Organic Drinks Industry Analysis, Insights and Forecast, 2021-2033
- 6.1. Market Analysis, Insights and Forecast - by Product Type
- 6.1.1. Alcoholic
- 6.1.1.1. Wine
- 6.1.1.2. Beer
- 6.1.1.3. Spirits
- 6.1.1.4. Other Alcoholic Beverages
- 6.1.2. Non-alcoholic
- 6.1.2.1. Fruit and Vegetable Juices
- 6.1.2.2. Dairy
- 6.1.2.3. Coffee and Tea
- 6.1.2.4. Other Non-alcoholic Beverages
- 6.1.1. Alcoholic
- 6.2. Market Analysis, Insights and Forecast - by Distribution Channel
- 6.2.1. Supermarkets/Hypermarkets
- 6.2.2. Convenience Stores
- 6.2.3. Specialist Retailers
- 6.2.4. Online Retailers
- 6.2.5. Other Distribution Channels
- 6.1. Market Analysis, Insights and Forecast - by Product Type
- 7. North America Organic Drinks Industry Analysis, Insights and Forecast, 2020-2032
- 7.1. Market Analysis, Insights and Forecast - by Product Type
- 7.1.1. Alcoholic
- 7.1.1.1. Wine
- 7.1.1.2. Beer
- 7.1.1.3. Spirits
- 7.1.1.4. Other Alcoholic Beverages
- 7.1.2. Non-alcoholic
- 7.1.2.1. Fruit and Vegetable Juices
- 7.1.2.2. Dairy
- 7.1.2.3. Coffee and Tea
- 7.1.2.4. Other Non-alcoholic Beverages
- 7.1.1. Alcoholic
- 7.2. Market Analysis, Insights and Forecast - by Distribution Channel
- 7.2.1. Supermarkets/Hypermarkets
- 7.2.2. Convenience Stores
- 7.2.3. Specialist Retailers
- 7.2.4. Online Retailers
- 7.2.5. Other Distribution Channels
- 7.1. Market Analysis, Insights and Forecast - by Product Type
- 8. Europe Organic Drinks Industry Analysis, Insights and Forecast, 2020-2032
- 8.1. Market Analysis, Insights and Forecast - by Product Type
- 8.1.1. Alcoholic
- 8.1.1.1. Wine
- 8.1.1.2. Beer
- 8.1.1.3. Spirits
- 8.1.1.4. Other Alcoholic Beverages
- 8.1.2. Non-alcoholic
- 8.1.2.1. Fruit and Vegetable Juices
- 8.1.2.2. Dairy
- 8.1.2.3. Coffee and Tea
- 8.1.2.4. Other Non-alcoholic Beverages
- 8.1.1. Alcoholic
- 8.2. Market Analysis, Insights and Forecast - by Distribution Channel
- 8.2.1. Supermarkets/Hypermarkets
- 8.2.2. Convenience Stores
- 8.2.3. Specialist Retailers
- 8.2.4. Online Retailers
- 8.2.5. Other Distribution Channels
- 8.1. Market Analysis, Insights and Forecast - by Product Type
- 9. Asia Pacific Organic Drinks Industry Analysis, Insights and Forecast, 2020-2032
- 9.1. Market Analysis, Insights and Forecast - by Product Type
- 9.1.1. Alcoholic
- 9.1.1.1. Wine
- 9.1.1.2. Beer
- 9.1.1.3. Spirits
- 9.1.1.4. Other Alcoholic Beverages
- 9.1.2. Non-alcoholic
- 9.1.2.1. Fruit and Vegetable Juices
- 9.1.2.2. Dairy
- 9.1.2.3. Coffee and Tea
- 9.1.2.4. Other Non-alcoholic Beverages
- 9.1.1. Alcoholic
- 9.2. Market Analysis, Insights and Forecast - by Distribution Channel
- 9.2.1. Supermarkets/Hypermarkets
- 9.2.2. Convenience Stores
- 9.2.3. Specialist Retailers
- 9.2.4. Online Retailers
- 9.2.5. Other Distribution Channels
- 9.1. Market Analysis, Insights and Forecast - by Product Type
- 10. South America Organic Drinks Industry Analysis, Insights and Forecast, 2020-2032
- 10.1. Market Analysis, Insights and Forecast - by Product Type
- 10.1.1. Alcoholic
- 10.1.1.1. Wine
- 10.1.1.2. Beer
- 10.1.1.3. Spirits
- 10.1.1.4. Other Alcoholic Beverages
- 10.1.2. Non-alcoholic
- 10.1.2.1. Fruit and Vegetable Juices
- 10.1.2.2. Dairy
- 10.1.2.3. Coffee and Tea
- 10.1.2.4. Other Non-alcoholic Beverages
- 10.1.1. Alcoholic
- 10.2. Market Analysis, Insights and Forecast - by Distribution Channel
- 10.2.1. Supermarkets/Hypermarkets
- 10.2.2. Convenience Stores
- 10.2.3. Specialist Retailers
- 10.2.4. Online Retailers
- 10.2.5. Other Distribution Channels
- 10.1. Market Analysis, Insights and Forecast - by Product Type
- 11. Middle East and Africa Organic Drinks Industry Analysis, Insights and Forecast, 2020-2032
- 11.1. Market Analysis, Insights and Forecast - by Product Type
- 11.1.1. Alcoholic
- 11.1.1.1. Wine
- 11.1.1.2. Beer
- 11.1.1.3. Spirits
- 11.1.1.4. Other Alcoholic Beverages
- 11.1.2. Non-alcoholic
- 11.1.2.1. Fruit and Vegetable Juices
- 11.1.2.2. Dairy
- 11.1.2.3. Coffee and Tea
- 11.1.2.4. Other Non-alcoholic Beverages
- 11.1.1. Alcoholic
- 11.2. Market Analysis, Insights and Forecast - by Distribution Channel
- 11.2.1. Supermarkets/Hypermarkets
- 11.2.2. Convenience Stores
- 11.2.3. Specialist Retailers
- 11.2.4. Online Retailers
- 11.2.5. Other Distribution Channels
- 11.1. Market Analysis, Insights and Forecast - by Product Type
- 12. Competitive Analysis
- 12.1. Company Profiles
- 12.1.1 Nestlé SA
- 12.1.1.1. Company Overview
- 12.1.1.2. Products
- 12.1.1.3. Company Financials
- 12.1.1.4. SWOT Analysis
- 12.1.2 Lacorata Beverage LLC
- 12.1.2.1. Company Overview
- 12.1.2.2. Products
- 12.1.2.3. Company Financials
- 12.1.2.4. SWOT Analysis
- 12.1.3 Anheuser-Busch InBev
- 12.1.3.1. Company Overview
- 12.1.3.2. Products
- 12.1.3.3. Company Financials
- 12.1.3.4. SWOT Analysis
- 12.1.4 SYSTM Foods Inc
- 12.1.4.1. Company Overview
- 12.1.4.2. Products
- 12.1.4.3. Company Financials
- 12.1.4.4. SWOT Analysis
- 12.1.5 PepsiCo Inc
- 12.1.5.1. Company Overview
- 12.1.5.2. Products
- 12.1.5.3. Company Financials
- 12.1.5.4. SWOT Analysis
- 12.1.6 Whitewave Foods Company
- 12.1.6.1. Company Overview
- 12.1.6.2. Products
- 12.1.6.3. Company Financials
- 12.1.6.4. SWOT Analysis
- 12.1.7 James White Drinks
- 12.1.7.1. Company Overview
- 12.1.7.2. Products
- 12.1.7.3. Company Financials
- 12.1.7.4. SWOT Analysis
- 12.1.8 Bison Organic Beer
- 12.1.8.1. Company Overview
- 12.1.8.2. Products
- 12.1.8.3. Company Financials
- 12.1.8.4. SWOT Analysis
- 12.1.9 Danone SA
- 12.1.9.1. Company Overview
- 12.1.9.2. Products
- 12.1.9.3. Company Financials
- 12.1.9.4. SWOT Analysis
- 12.1.10 Organic Valley*List Not Exhaustive
- 12.1.10.1. Company Overview
- 12.1.10.2. Products
- 12.1.10.3. Company Financials
- 12.1.10.4. SWOT Analysis
- 12.1.11 PS Organic LLC
- 12.1.11.1. Company Overview
- 12.1.11.2. Products
- 12.1.11.3. Company Financials
- 12.1.11.4. SWOT Analysis
- 12.1.12 Drake's Organic Spirits LLC
- 12.1.12.1. Company Overview
- 12.1.12.2. Products
- 12.1.12.3. Company Financials
- 12.1.12.4. SWOT Analysis
- 12.1.1 Nestlé SA
- 12.2. Market Entropy
- 12.2.1 Company's Key Areas Served
- 12.2.2 Recent Developments
- 12.3. Company Market Share Analysis 2025
- 12.3.1 Top 5 Companies Market Share Analysis
- 12.3.2 Top 3 Companies Market Share Analysis
- 12.4. List of Potential Customers
- 13. Research Methodology
List of Figures
- Figure 1: Global Organic Drinks Industry Revenue Breakdown (Million, %) by Region 2025 & 2033
- Figure 2: Global Organic Drinks Industry Volume Breakdown (liter , %) by Region 2025 & 2033
- Figure 3: North America Organic Drinks Industry Revenue (Million), by Product Type 2025 & 2033
- Figure 4: North America Organic Drinks Industry Volume (liter ), by Product Type 2025 & 2033
- Figure 5: North America Organic Drinks Industry Revenue Share (%), by Product Type 2025 & 2033
- Figure 6: North America Organic Drinks Industry Volume Share (%), by Product Type 2025 & 2033
- Figure 7: North America Organic Drinks Industry Revenue (Million), by Distribution Channel 2025 & 2033
- Figure 8: North America Organic Drinks Industry Volume (liter ), by Distribution Channel 2025 & 2033
- Figure 9: North America Organic Drinks Industry Revenue Share (%), by Distribution Channel 2025 & 2033
- Figure 10: North America Organic Drinks Industry Volume Share (%), by Distribution Channel 2025 & 2033
- Figure 11: North America Organic Drinks Industry Revenue (Million), by Country 2025 & 2033
- Figure 12: North America Organic Drinks Industry Volume (liter ), by Country 2025 & 2033
- Figure 13: North America Organic Drinks Industry Revenue Share (%), by Country 2025 & 2033
- Figure 14: North America Organic Drinks Industry Volume Share (%), by Country 2025 & 2033
- Figure 15: Europe Organic Drinks Industry Revenue (Million), by Product Type 2025 & 2033
- Figure 16: Europe Organic Drinks Industry Volume (liter ), by Product Type 2025 & 2033
- Figure 17: Europe Organic Drinks Industry Revenue Share (%), by Product Type 2025 & 2033
- Figure 18: Europe Organic Drinks Industry Volume Share (%), by Product Type 2025 & 2033
- Figure 19: Europe Organic Drinks Industry Revenue (Million), by Distribution Channel 2025 & 2033
- Figure 20: Europe Organic Drinks Industry Volume (liter ), by Distribution Channel 2025 & 2033
- Figure 21: Europe Organic Drinks Industry Revenue Share (%), by Distribution Channel 2025 & 2033
- Figure 22: Europe Organic Drinks Industry Volume Share (%), by Distribution Channel 2025 & 2033
- Figure 23: Europe Organic Drinks Industry Revenue (Million), by Country 2025 & 2033
- Figure 24: Europe Organic Drinks Industry Volume (liter ), by Country 2025 & 2033
- Figure 25: Europe Organic Drinks Industry Revenue Share (%), by Country 2025 & 2033
- Figure 26: Europe Organic Drinks Industry Volume Share (%), by Country 2025 & 2033
- Figure 27: Asia Pacific Organic Drinks Industry Revenue (Million), by Product Type 2025 & 2033
- Figure 28: Asia Pacific Organic Drinks Industry Volume (liter ), by Product Type 2025 & 2033
- Figure 29: Asia Pacific Organic Drinks Industry Revenue Share (%), by Product Type 2025 & 2033
- Figure 30: Asia Pacific Organic Drinks Industry Volume Share (%), by Product Type 2025 & 2033
- Figure 31: Asia Pacific Organic Drinks Industry Revenue (Million), by Distribution Channel 2025 & 2033
- Figure 32: Asia Pacific Organic Drinks Industry Volume (liter ), by Distribution Channel 2025 & 2033
- Figure 33: Asia Pacific Organic Drinks Industry Revenue Share (%), by Distribution Channel 2025 & 2033
- Figure 34: Asia Pacific Organic Drinks Industry Volume Share (%), by Distribution Channel 2025 & 2033
- Figure 35: Asia Pacific Organic Drinks Industry Revenue (Million), by Country 2025 & 2033
- Figure 36: Asia Pacific Organic Drinks Industry Volume (liter ), by Country 2025 & 2033
- Figure 37: Asia Pacific Organic Drinks Industry Revenue Share (%), by Country 2025 & 2033
- Figure 38: Asia Pacific Organic Drinks Industry Volume Share (%), by Country 2025 & 2033
- Figure 39: South America Organic Drinks Industry Revenue (Million), by Product Type 2025 & 2033
- Figure 40: South America Organic Drinks Industry Volume (liter ), by Product Type 2025 & 2033
- Figure 41: South America Organic Drinks Industry Revenue Share (%), by Product Type 2025 & 2033
- Figure 42: South America Organic Drinks Industry Volume Share (%), by Product Type 2025 & 2033
- Figure 43: South America Organic Drinks Industry Revenue (Million), by Distribution Channel 2025 & 2033
- Figure 44: South America Organic Drinks Industry Volume (liter ), by Distribution Channel 2025 & 2033
- Figure 45: South America Organic Drinks Industry Revenue Share (%), by Distribution Channel 2025 & 2033
- Figure 46: South America Organic Drinks Industry Volume Share (%), by Distribution Channel 2025 & 2033
- Figure 47: South America Organic Drinks Industry Revenue (Million), by Country 2025 & 2033
- Figure 48: South America Organic Drinks Industry Volume (liter ), by Country 2025 & 2033
- Figure 49: South America Organic Drinks Industry Revenue Share (%), by Country 2025 & 2033
- Figure 50: South America Organic Drinks Industry Volume Share (%), by Country 2025 & 2033
- Figure 51: Middle East and Africa Organic Drinks Industry Revenue (Million), by Product Type 2025 & 2033
- Figure 52: Middle East and Africa Organic Drinks Industry Volume (liter ), by Product Type 2025 & 2033
- Figure 53: Middle East and Africa Organic Drinks Industry Revenue Share (%), by Product Type 2025 & 2033
- Figure 54: Middle East and Africa Organic Drinks Industry Volume Share (%), by Product Type 2025 & 2033
- Figure 55: Middle East and Africa Organic Drinks Industry Revenue (Million), by Distribution Channel 2025 & 2033
- Figure 56: Middle East and Africa Organic Drinks Industry Volume (liter ), by Distribution Channel 2025 & 2033
- Figure 57: Middle East and Africa Organic Drinks Industry Revenue Share (%), by Distribution Channel 2025 & 2033
- Figure 58: Middle East and Africa Organic Drinks Industry Volume Share (%), by Distribution Channel 2025 & 2033
- Figure 59: Middle East and Africa Organic Drinks Industry Revenue (Million), by Country 2025 & 2033
- Figure 60: Middle East and Africa Organic Drinks Industry Volume (liter ), by Country 2025 & 2033
- Figure 61: Middle East and Africa Organic Drinks Industry Revenue Share (%), by Country 2025 & 2033
- Figure 62: Middle East and Africa Organic Drinks Industry Volume Share (%), by Country 2025 & 2033
List of Tables
- Table 1: Global Organic Drinks Industry Revenue Million Forecast, by Product Type 2020 & 2033
- Table 2: Global Organic Drinks Industry Volume liter Forecast, by Product Type 2020 & 2033
- Table 3: Global Organic Drinks Industry Revenue Million Forecast, by Distribution Channel 2020 & 2033
- Table 4: Global Organic Drinks Industry Volume liter Forecast, by Distribution Channel 2020 & 2033
- Table 5: Global Organic Drinks Industry Revenue Million Forecast, by Region 2020 & 2033
- Table 6: Global Organic Drinks Industry Volume liter Forecast, by Region 2020 & 2033
- Table 7: Global Organic Drinks Industry Revenue Million Forecast, by Product Type 2020 & 2033
- Table 8: Global Organic Drinks Industry Volume liter Forecast, by Product Type 2020 & 2033
- Table 9: Global Organic Drinks Industry Revenue Million Forecast, by Distribution Channel 2020 & 2033
- Table 10: Global Organic Drinks Industry Volume liter Forecast, by Distribution Channel 2020 & 2033
- Table 11: Global Organic Drinks Industry Revenue Million Forecast, by Country 2020 & 2033
- Table 12: Global Organic Drinks Industry Volume liter Forecast, by Country 2020 & 2033
- Table 13: United States Organic Drinks Industry Revenue (Million) Forecast, by Application 2020 & 2033
- Table 14: United States Organic Drinks Industry Volume (liter ) Forecast, by Application 2020 & 2033
- Table 15: Canada Organic Drinks Industry Revenue (Million) Forecast, by Application 2020 & 2033
- Table 16: Canada Organic Drinks Industry Volume (liter ) Forecast, by Application 2020 & 2033
- Table 17: Mexico Organic Drinks Industry Revenue (Million) Forecast, by Application 2020 & 2033
- Table 18: Mexico Organic Drinks Industry Volume (liter ) Forecast, by Application 2020 & 2033
- Table 19: Rest of North America Organic Drinks Industry Revenue (Million) Forecast, by Application 2020 & 2033
- Table 20: Rest of North America Organic Drinks Industry Volume (liter ) Forecast, by Application 2020 & 2033
- Table 21: Global Organic Drinks Industry Revenue Million Forecast, by Product Type 2020 & 2033
- Table 22: Global Organic Drinks Industry Volume liter Forecast, by Product Type 2020 & 2033
- Table 23: Global Organic Drinks Industry Revenue Million Forecast, by Distribution Channel 2020 & 2033
- Table 24: Global Organic Drinks Industry Volume liter Forecast, by Distribution Channel 2020 & 2033
- Table 25: Global Organic Drinks Industry Revenue Million Forecast, by Country 2020 & 2033
- Table 26: Global Organic Drinks Industry Volume liter Forecast, by Country 2020 & 2033
- Table 27: Spain Organic Drinks Industry Revenue (Million) Forecast, by Application 2020 & 2033
- Table 28: Spain Organic Drinks Industry Volume (liter ) Forecast, by Application 2020 & 2033
- Table 29: United Kingdom Organic Drinks Industry Revenue (Million) Forecast, by Application 2020 & 2033
- Table 30: United Kingdom Organic Drinks Industry Volume (liter ) Forecast, by Application 2020 & 2033
- Table 31: Germany Organic Drinks Industry Revenue (Million) Forecast, by Application 2020 & 2033
- Table 32: Germany Organic Drinks Industry Volume (liter ) Forecast, by Application 2020 & 2033
- Table 33: France Organic Drinks Industry Revenue (Million) Forecast, by Application 2020 & 2033
- Table 34: France Organic Drinks Industry Volume (liter ) Forecast, by Application 2020 & 2033
- Table 35: Italy Organic Drinks Industry Revenue (Million) Forecast, by Application 2020 & 2033
- Table 36: Italy Organic Drinks Industry Volume (liter ) Forecast, by Application 2020 & 2033
- Table 37: Russia Organic Drinks Industry Revenue (Million) Forecast, by Application 2020 & 2033
- Table 38: Russia Organic Drinks Industry Volume (liter ) Forecast, by Application 2020 & 2033
- Table 39: Rest of Europe Organic Drinks Industry Revenue (Million) Forecast, by Application 2020 & 2033
- Table 40: Rest of Europe Organic Drinks Industry Volume (liter ) Forecast, by Application 2020 & 2033
- Table 41: Global Organic Drinks Industry Revenue Million Forecast, by Product Type 2020 & 2033
- Table 42: Global Organic Drinks Industry Volume liter Forecast, by Product Type 2020 & 2033
- Table 43: Global Organic Drinks Industry Revenue Million Forecast, by Distribution Channel 2020 & 2033
- Table 44: Global Organic Drinks Industry Volume liter Forecast, by Distribution Channel 2020 & 2033
- Table 45: Global Organic Drinks Industry Revenue Million Forecast, by Country 2020 & 2033
- Table 46: Global Organic Drinks Industry Volume liter Forecast, by Country 2020 & 2033
- Table 47: China Organic Drinks Industry Revenue (Million) Forecast, by Application 2020 & 2033
- Table 48: China Organic Drinks Industry Volume (liter ) Forecast, by Application 2020 & 2033
- Table 49: Japan Organic Drinks Industry Revenue (Million) Forecast, by Application 2020 & 2033
- Table 50: Japan Organic Drinks Industry Volume (liter ) Forecast, by Application 2020 & 2033
- Table 51: India Organic Drinks Industry Revenue (Million) Forecast, by Application 2020 & 2033
- Table 52: India Organic Drinks Industry Volume (liter ) Forecast, by Application 2020 & 2033
- Table 53: Australia Organic Drinks Industry Revenue (Million) Forecast, by Application 2020 & 2033
- Table 54: Australia Organic Drinks Industry Volume (liter ) Forecast, by Application 2020 & 2033
- Table 55: Rest of Asia Pacific Organic Drinks Industry Revenue (Million) Forecast, by Application 2020 & 2033
- Table 56: Rest of Asia Pacific Organic Drinks Industry Volume (liter ) Forecast, by Application 2020 & 2033
- Table 57: Global Organic Drinks Industry Revenue Million Forecast, by Product Type 2020 & 2033
- Table 58: Global Organic Drinks Industry Volume liter Forecast, by Product Type 2020 & 2033
- Table 59: Global Organic Drinks Industry Revenue Million Forecast, by Distribution Channel 2020 & 2033
- Table 60: Global Organic Drinks Industry Volume liter Forecast, by Distribution Channel 2020 & 2033
- Table 61: Global Organic Drinks Industry Revenue Million Forecast, by Country 2020 & 2033
- Table 62: Global Organic Drinks Industry Volume liter Forecast, by Country 2020 & 2033
- Table 63: Brazil Organic Drinks Industry Revenue (Million) Forecast, by Application 2020 & 2033
- Table 64: Brazil Organic Drinks Industry Volume (liter ) Forecast, by Application 2020 & 2033
- Table 65: Argentina Organic Drinks Industry Revenue (Million) Forecast, by Application 2020 & 2033
- Table 66: Argentina Organic Drinks Industry Volume (liter ) Forecast, by Application 2020 & 2033
- Table 67: Rest of South America Organic Drinks Industry Revenue (Million) Forecast, by Application 2020 & 2033
- Table 68: Rest of South America Organic Drinks Industry Volume (liter ) Forecast, by Application 2020 & 2033
- Table 69: Global Organic Drinks Industry Revenue Million Forecast, by Product Type 2020 & 2033
- Table 70: Global Organic Drinks Industry Volume liter Forecast, by Product Type 2020 & 2033
- Table 71: Global Organic Drinks Industry Revenue Million Forecast, by Distribution Channel 2020 & 2033
- Table 72: Global Organic Drinks Industry Volume liter Forecast, by Distribution Channel 2020 & 2033
- Table 73: Global Organic Drinks Industry Revenue Million Forecast, by Country 2020 & 2033
- Table 74: Global Organic Drinks Industry Volume liter Forecast, by Country 2020 & 2033
- Table 75: South Africa Organic Drinks Industry Revenue (Million) Forecast, by Application 2020 & 2033
- Table 76: South Africa Organic Drinks Industry Volume (liter ) Forecast, by Application 2020 & 2033
- Table 77: United Arab Emirates Organic Drinks Industry Revenue (Million) Forecast, by Application 2020 & 2033
- Table 78: United Arab Emirates Organic Drinks Industry Volume (liter ) Forecast, by Application 2020 & 2033
- Table 79: Rest of Middle East and Africa Organic Drinks Industry Revenue (Million) Forecast, by Application 2020 & 2033
- Table 80: Rest of Middle East and Africa Organic Drinks Industry Volume (liter ) Forecast, by Application 2020 & 2033
Frequently Asked Questions
1. What is the projected Compound Annual Growth Rate (CAGR) of the Organic Drinks Industry?
The projected CAGR is approximately 4.91%.
2. Which companies are prominent players in the Organic Drinks Industry?
Key companies in the market include Nestlé SA, Lacorata Beverage LLC, Anheuser-Busch InBev, SYSTM Foods Inc, PepsiCo Inc, Whitewave Foods Company, James White Drinks, Bison Organic Beer, Danone SA, Organic Valley*List Not Exhaustive, PS Organic LLC, Drake's Organic Spirits LLC.
3. What are the main segments of the Organic Drinks Industry?
The market segments include Product Type, Distribution Channel.
4. Can you provide details about the market size?
The market size is estimated to be USD 50.19 Million as of 2022.
5. What are some drivers contributing to market growth?
Growing Demand for Nutricosmetics Among Millennials; Growing Beauty and Wellness Trend.
6. What are the notable trends driving market growth?
Health-conscious consumers are increasingly demanding organic beverages.
7. Are there any restraints impacting market growth?
Stringent Government Regulations and Product Guidelines.
8. Can you provide examples of recent developments in the market?
In June 2022, the food and beverage brand, Systm Foods acquired Chameleon Organic Coffee from Nestlé USA. Chameleon Organic Coffee's product portfolio includes single-serve ready-to-drink products as well as multi-serve concentrates.
9. What pricing options are available for accessing the report?
Pricing options include single-user, multi-user, and enterprise licenses priced at USD 4750, USD 5250, and USD 8750 respectively.
10. Is the market size provided in terms of value or volume?
The market size is provided in terms of value, measured in Million and volume, measured in liter .
11. Are there any specific market keywords associated with the report?
Yes, the market keyword associated with the report is "Organic Drinks Industry," which aids in identifying and referencing the specific market segment covered.
12. How do I determine which pricing option suits my needs best?
The pricing options vary based on user requirements and access needs. Individual users may opt for single-user licenses, while businesses requiring broader access may choose multi-user or enterprise licenses for cost-effective access to the report.
13. Are there any additional resources or data provided in the Organic Drinks Industry report?
While the report offers comprehensive insights, it's advisable to review the specific contents or supplementary materials provided to ascertain if additional resources or data are available.
14. How can I stay updated on further developments or reports in the Organic Drinks Industry?
To stay informed about further developments, trends, and reports in the Organic Drinks Industry, consider subscribing to industry newsletters, following relevant companies and organizations, or regularly checking reputable industry news sources and publications.
Methodology
Step 1 - Identification of Relevant Samples Size from Population Database


Step 2 - Approaches for Defining Global Market Size (Value, Volume* & Price*)

Note*: In applicable scenarios
Step 3 - Data Sources
Primary Research
- Web Analytics
- Survey Reports
- Research Institute
- Latest Research Reports
- Opinion Leaders
Secondary Research
- Annual Reports
- White Paper
- Latest Press Release
- Industry Association
- Paid Database
- Investor Presentations

Step 4 - Data Triangulation
Involves using different sources of information in order to increase the validity of a study
These sources are likely to be stakeholders in a program - participants, other researchers, program staff, other community members, and so on.
Then we put all data in single framework & apply various statistical tools to find out the dynamic on the market.
During the analysis stage, feedback from the stakeholder groups would be compared to determine areas of agreement as well as areas of divergence