
Key Insights
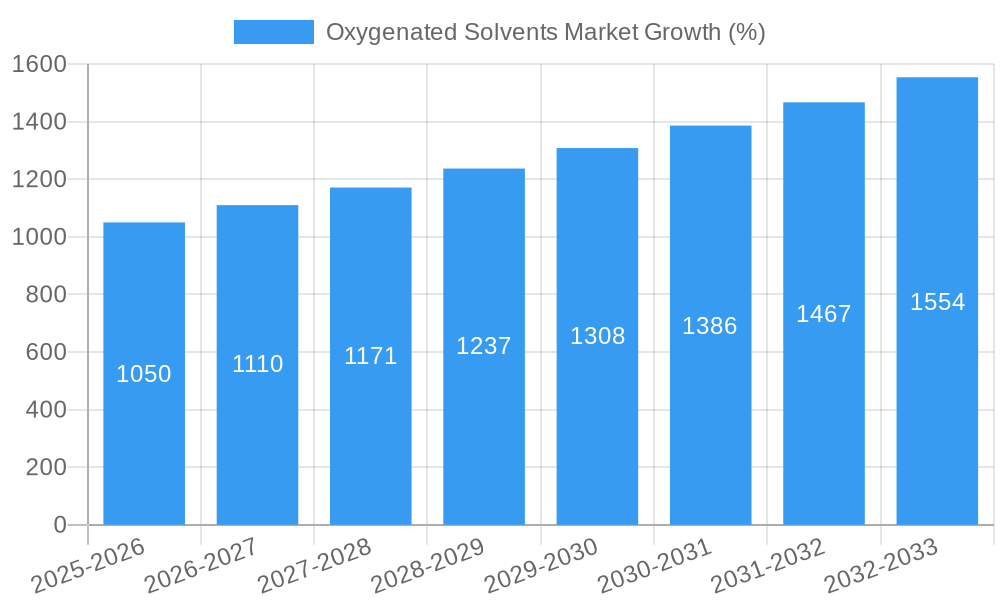
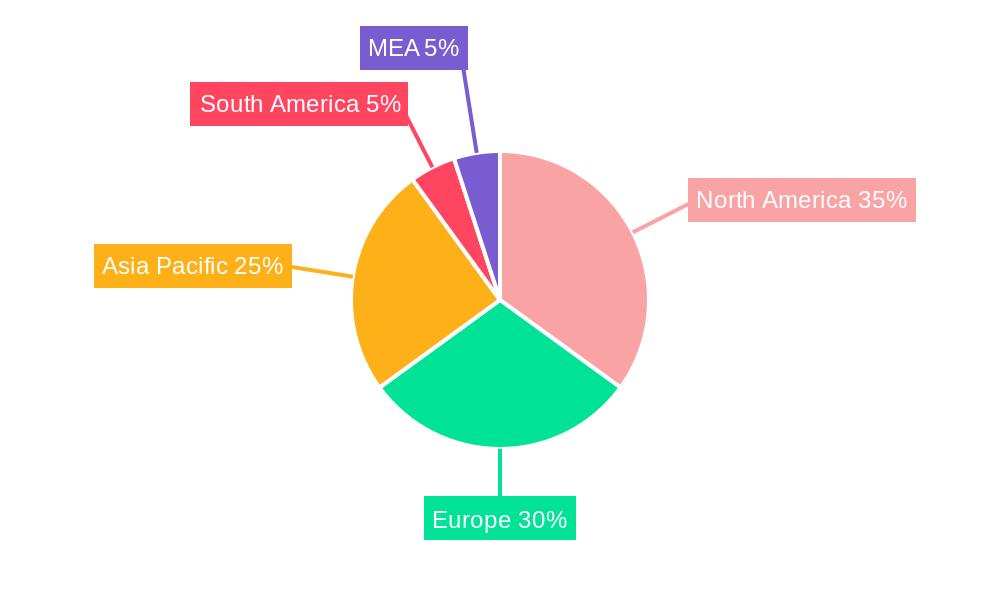
The Oxygenated Solvents market is experiencing robust growth, projected to maintain a Compound Annual Growth Rate (CAGR) exceeding 7% from 2025 to 2033. This expansion is driven by increasing demand across diverse sectors. The paints and coatings industry remains a significant consumer, fueled by the need for high-performance, environmentally friendly formulations. Simultaneously, the pharmaceuticals and cosmetics sectors are contributing substantially to market growth, driven by the use of oxygenated solvents as essential ingredients and processing aids. The cleaning products segment also displays a notable growth trajectory, reflecting the rising preference for effective and safer cleaning solutions. Furthermore, the agricultural sector's adoption of oxygenated solvents as crop protection agents and in various agricultural formulations is contributing to the overall market expansion. Growth is geographically diverse, with North America and Europe currently holding substantial market shares due to established industrial bases and stringent regulatory frameworks. However, the Asia-Pacific region is expected to witness significant growth in the forecast period due to rapid industrialization and rising consumer demand.
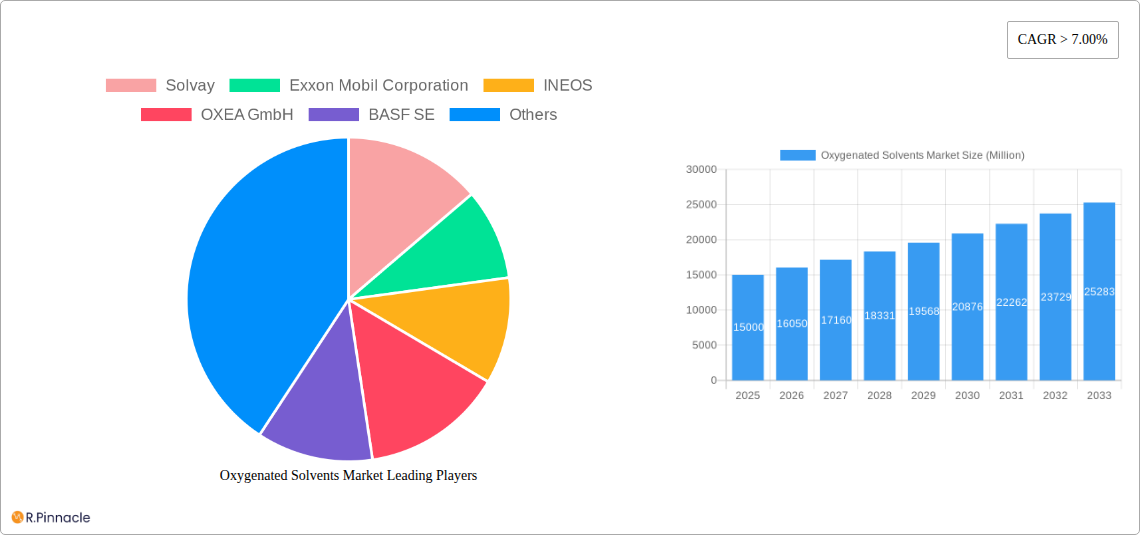
While several factors contribute to this positive outlook, potential restraints include fluctuating raw material prices and evolving environmental regulations. The market is segmented by type (alcohols, ketones, glycols, esters, and others) and application (paints and coatings, pharmaceuticals, cleaning products, cosmetics, agriculture, and others). Key players like Solvay, ExxonMobil, INEOS, OXEA, BASF, Shell, Arkema, Dow, and Eastman Chemical Company are actively shaping market dynamics through innovation and strategic partnerships. Competition is intense, with companies focusing on product diversification, cost optimization, and sustainable manufacturing practices to gain a competitive edge. The market is witnessing a shift towards bio-based and sustainable oxygenated solvents, driven by increasing environmental concerns and growing regulatory pressures, presenting both opportunities and challenges for market players.
Oxygenated Solvents Market: A Comprehensive Report (2019-2033)
This in-depth report provides a comprehensive analysis of the Oxygenated Solvents market, offering valuable insights for industry professionals, investors, and strategic decision-makers. Covering the period from 2019 to 2033, with a base year of 2025 and a forecast period of 2025-2033, this report meticulously examines market dynamics, segmentation, key players, and future trends. The market is expected to reach xx Million by 2033, exhibiting a CAGR of xx% during the forecast period.
Oxygenated Solvents Market Structure & Innovation Trends
This section analyzes the competitive landscape of the Oxygenated Solvents market, assessing market concentration, innovation drivers, regulatory frameworks, and M&A activities. The market exhibits a moderately consolidated structure, with key players such as Solvay, Exxon Mobil Corporation, INEOS, OXEA GmbH, BASF SE, Royal Dutch Shell Plc, Arkema Group, Dow, and Eastman Chemical Company holding significant market share.
- Market Concentration: The top 5 players collectively hold approximately xx% of the global market share in 2025.
- Innovation Drivers: Sustainability concerns are driving innovation towards biodegradable and less toxic solvents. Research and development efforts focus on enhancing solvent performance, reducing environmental impact, and improving process efficiency.
- Regulatory Frameworks: Stringent environmental regulations regarding volatile organic compounds (VOCs) are influencing product development and adoption.
- Product Substitutes: The market faces competition from alternative solvents, such as water-based and supercritical fluid solvents.
- End-User Demographics: The major end-use sectors include paints and coatings, pharmaceuticals, cleaning products, cosmetics, and agriculture.
- M&A Activities: The past five years have witnessed xx M&A deals in the Oxygenated Solvents market, with a total deal value of approximately xx Million. These activities reflect the strategic efforts of players to expand their product portfolios and market reach.
Oxygenated Solvents Market Dynamics & Trends
The Oxygenated Solvents market is experiencing robust growth, driven by increasing demand from various end-use industries. Factors such as rising consumer disposable income, industrialization, and urbanization are propelling market expansion. Technological advancements, such as the development of more efficient and environmentally friendly solvents, are also contributing to market growth. The competitive landscape is characterized by intense rivalry among established players and the emergence of new entrants. Market penetration rates vary significantly across different regions and applications, with higher penetration observed in developed economies and sectors with stringent environmental regulations. Specific growth drivers include: increasing demand from the paints and coatings industry, the expanding pharmaceutical sector, and the rising use of cleaning products. The market is expected to witness technological disruptions in the form of novel solvent formulations and sustainable manufacturing processes. The CAGR for the forecast period is projected at xx%.
Dominant Regions & Segments in Oxygenated Solvents Market
The [insert dominant region, e.g., North America] region currently dominates the Oxygenated Solvents market, driven by robust economic growth, strong industrial infrastructure, and significant demand from end-use sectors such as paints and coatings and pharmaceuticals.
Key Drivers in Dominant Region:
- Strong economic growth and industrial development.
- Well-established infrastructure for manufacturing and distribution.
- High consumer spending on paints and coatings and other consumer products.
- Stringent environmental regulations driving the demand for eco-friendly solvents.
Dominant Segments:
- Type: Alcohols currently hold the largest market share among the various types of oxygenated solvents, driven by their widespread applications in various industries. Esters are also a significant segment, with growth prospects driven by their use in specialty applications.
- Application: Paints and coatings segment is the largest application area for oxygenated solvents due to their use as solvents and diluents in paints, coatings, and adhesives. The pharmaceutical and cosmetics segments are exhibiting strong growth potential.
Detailed dominance analysis will be provided in the full report.
Oxygenated Solvents Market Product Innovations
Recent product developments focus on eco-friendly, high-performance solvents with reduced VOC emissions. Innovations include bio-based solvents and solvents with enhanced solvency power and reduced toxicity. These advancements cater to the increasing demand for sustainable and environmentally friendly products, aligning with global environmental regulations. The market is witnessing a shift towards solvent blends that offer optimized performance characteristics tailored to specific applications.
Report Scope & Segmentation Analysis
The report segments the Oxygenated Solvents market by type (Alcohols, Ketones, Glycols, Esters, Other Types) and application (Paints and Coatings, Pharmaceuticals, Cleaning Products, Cosmetics, Agriculture, Other Applications). Each segment's growth projections, market size, and competitive dynamics are analyzed in detail. For example, the Alcohols segment is projected to exhibit a CAGR of xx% during the forecast period due to its extensive applications in various industries. The Paints and Coatings application segment dominates the market, and is forecast to grow at xx% CAGR.
Key Drivers of Oxygenated Solvents Market Growth
The Oxygenated Solvents market is driven by several key factors: Firstly, the increasing demand from the paints and coatings industry, fueled by the growth in construction and automotive sectors. Secondly, the expanding pharmaceutical industry, which utilizes oxygenated solvents in the manufacturing of drugs and medicines. Finally, growing consumer spending and rising disposable incomes globally contribute to the overall market expansion.
Challenges in the Oxygenated Solvents Market Sector
The Oxygenated Solvents market faces several challenges, including stringent environmental regulations that necessitate the development of eco-friendly solvents, impacting production costs. Supply chain disruptions and volatility in raw material prices also pose challenges. Furthermore, intense competition among existing players and the emergence of new entrants create pressure on profit margins.
Emerging Opportunities in Oxygenated Solvents Market
Emerging opportunities include the development of biodegradable and sustainable solvents, catering to the growing demand for environmentally friendly products. Expansion into new geographic markets, particularly in developing economies, presents significant potential for growth. The development of specialized solvents for niche applications, such as in the electronics and aerospace industries, also offers attractive opportunities.
Leading Players in the Oxygenated Solvents Market Market
- Solvay
- Exxon Mobil Corporation
- INEOS
- OXEA GmbH
- BASF SE
- Royal Dutch Shell Plc
- Arkema Group
- Dow
- Eastman Chemical Company
Key Developments in Oxygenated Solvents Market Industry
- 2022-Q4: Solvay launched a new range of sustainable solvents.
- 2023-Q1: BASF announced a strategic partnership for the development of bio-based solvents.
- 2023-Q2: INEOS invested xx Million in expanding its production capacity for a specific oxygenated solvent. (Further details will be provided in the full report)
Future Outlook for Oxygenated Solvents Market Market
The Oxygenated Solvents market is poised for continued growth, driven by increasing demand from various end-use sectors and the development of innovative, sustainable products. Strategic partnerships and investments in research and development will shape the future of the market. The focus on eco-friendly solutions will be a key growth accelerator, with significant opportunities for companies that can deliver sustainable and high-performance solvents.
Oxygenated Solvents Market Segmentation
-
1. Type
- 1.1. Alcohols
- 1.2. Ketones
- 1.3. Glycols
- 1.4. Esters
- 1.5. Other Types
-
2. Application
- 2.1. Paints and Coatings
- 2.2. Pharmaceuticals
- 2.3. Cleaning Products
- 2.4. Cosmetics
- 2.5. Agriculture
- 2.6. Other Applications
Oxygenated Solvents Market Segmentation By Geography
-
1. Asia Pacific
- 1.1. China
- 1.2. India
- 1.3. Japan
- 1.4. South Korea
- 1.5. Rest of Asia Pacific
-
2. North America
- 2.1. United States
- 2.2. Canada
- 2.3. Mexico
-
3. Europe
- 3.1. Germany
- 3.2. United Kingdom
- 3.3. France
- 3.4. Italy
- 3.5. Rest of Europe
-
4. South America
- 4.1. Brazil
- 4.2. Argentina
- 4.3. Rest of South America
- 5. Middle East
-
6. Saudi Arabia
- 6.1. South Africa
- 6.2. Rest of Middle East
Oxygenated Solvents Market REPORT HIGHLIGHTS
| Aspects | Details |
|---|---|
| Study Period | 2019-2033 |
| Base Year | 2024 |
| Estimated Year | 2025 |
| Forecast Period | 2025-2033 |
| Historical Period | 2019-2024 |
| Growth Rate | CAGR of > 7.00% from 2019-2033 |
| Segmentation |
|
Table of Contents
- 1. Introduction
- 1.1. Research Scope
- 1.2. Market Segmentation
- 1.3. Research Methodology
- 1.4. Definitions and Assumptions
- 2. Executive Summary
- 2.1. Introduction
- 3. Market Dynamics
- 3.1. Introduction
- 3.2. Market Drivers
- 3.2.1. ; Growing Applications across Various Industries; Other Drivers
- 3.3. Market Restrains
- 3.3.1. ; Unfavourable Conditions Arising due to the COVID-19 Outbreak; Other Restraints
- 3.4. Market Trends
- 3.4.1. Paints & Coatings Segment to Propel the Demand
- 4. Market Factor Analysis
- 4.1. Porters Five Forces
- 4.2. Supply/Value Chain
- 4.3. PESTEL analysis
- 4.4. Market Entropy
- 4.5. Patent/Trademark Analysis
- 5. Global Oxygenated Solvents Market Analysis, Insights and Forecast, 2019-2031
- 5.1. Market Analysis, Insights and Forecast - by Type
- 5.1.1. Alcohols
- 5.1.2. Ketones
- 5.1.3. Glycols
- 5.1.4. Esters
- 5.1.5. Other Types
- 5.2. Market Analysis, Insights and Forecast - by Application
- 5.2.1. Paints and Coatings
- 5.2.2. Pharmaceuticals
- 5.2.3. Cleaning Products
- 5.2.4. Cosmetics
- 5.2.5. Agriculture
- 5.2.6. Other Applications
- 5.3. Market Analysis, Insights and Forecast - by Region
- 5.3.1. Asia Pacific
- 5.3.2. North America
- 5.3.3. Europe
- 5.3.4. South America
- 5.3.5. Middle East
- 5.3.6. Saudi Arabia
- 5.1. Market Analysis, Insights and Forecast - by Type
- 6. Asia Pacific Oxygenated Solvents Market Analysis, Insights and Forecast, 2019-2031
- 6.1. Market Analysis, Insights and Forecast - by Type
- 6.1.1. Alcohols
- 6.1.2. Ketones
- 6.1.3. Glycols
- 6.1.4. Esters
- 6.1.5. Other Types
- 6.2. Market Analysis, Insights and Forecast - by Application
- 6.2.1. Paints and Coatings
- 6.2.2. Pharmaceuticals
- 6.2.3. Cleaning Products
- 6.2.4. Cosmetics
- 6.2.5. Agriculture
- 6.2.6. Other Applications
- 6.1. Market Analysis, Insights and Forecast - by Type
- 7. North America Oxygenated Solvents Market Analysis, Insights and Forecast, 2019-2031
- 7.1. Market Analysis, Insights and Forecast - by Type
- 7.1.1. Alcohols
- 7.1.2. Ketones
- 7.1.3. Glycols
- 7.1.4. Esters
- 7.1.5. Other Types
- 7.2. Market Analysis, Insights and Forecast - by Application
- 7.2.1. Paints and Coatings
- 7.2.2. Pharmaceuticals
- 7.2.3. Cleaning Products
- 7.2.4. Cosmetics
- 7.2.5. Agriculture
- 7.2.6. Other Applications
- 7.1. Market Analysis, Insights and Forecast - by Type
- 8. Europe Oxygenated Solvents Market Analysis, Insights and Forecast, 2019-2031
- 8.1. Market Analysis, Insights and Forecast - by Type
- 8.1.1. Alcohols
- 8.1.2. Ketones
- 8.1.3. Glycols
- 8.1.4. Esters
- 8.1.5. Other Types
- 8.2. Market Analysis, Insights and Forecast - by Application
- 8.2.1. Paints and Coatings
- 8.2.2. Pharmaceuticals
- 8.2.3. Cleaning Products
- 8.2.4. Cosmetics
- 8.2.5. Agriculture
- 8.2.6. Other Applications
- 8.1. Market Analysis, Insights and Forecast - by Type
- 9. South America Oxygenated Solvents Market Analysis, Insights and Forecast, 2019-2031
- 9.1. Market Analysis, Insights and Forecast - by Type
- 9.1.1. Alcohols
- 9.1.2. Ketones
- 9.1.3. Glycols
- 9.1.4. Esters
- 9.1.5. Other Types
- 9.2. Market Analysis, Insights and Forecast - by Application
- 9.2.1. Paints and Coatings
- 9.2.2. Pharmaceuticals
- 9.2.3. Cleaning Products
- 9.2.4. Cosmetics
- 9.2.5. Agriculture
- 9.2.6. Other Applications
- 9.1. Market Analysis, Insights and Forecast - by Type
- 10. Middle East Oxygenated Solvents Market Analysis, Insights and Forecast, 2019-2031
- 10.1. Market Analysis, Insights and Forecast - by Type
- 10.1.1. Alcohols
- 10.1.2. Ketones
- 10.1.3. Glycols
- 10.1.4. Esters
- 10.1.5. Other Types
- 10.2. Market Analysis, Insights and Forecast - by Application
- 10.2.1. Paints and Coatings
- 10.2.2. Pharmaceuticals
- 10.2.3. Cleaning Products
- 10.2.4. Cosmetics
- 10.2.5. Agriculture
- 10.2.6. Other Applications
- 10.1. Market Analysis, Insights and Forecast - by Type
- 11. Saudi Arabia Oxygenated Solvents Market Analysis, Insights and Forecast, 2019-2031
- 11.1. Market Analysis, Insights and Forecast - by Type
- 11.1.1. Alcohols
- 11.1.2. Ketones
- 11.1.3. Glycols
- 11.1.4. Esters
- 11.1.5. Other Types
- 11.2. Market Analysis, Insights and Forecast - by Application
- 11.2.1. Paints and Coatings
- 11.2.2. Pharmaceuticals
- 11.2.3. Cleaning Products
- 11.2.4. Cosmetics
- 11.2.5. Agriculture
- 11.2.6. Other Applications
- 11.1. Market Analysis, Insights and Forecast - by Type
- 12. North America Oxygenated Solvents Market Analysis, Insights and Forecast, 2019-2031
- 12.1. Market Analysis, Insights and Forecast - By Country/Sub-region
- 12.1.1 United States
- 12.1.2 Canada
- 12.1.3 Mexico
- 13. Europe Oxygenated Solvents Market Analysis, Insights and Forecast, 2019-2031
- 13.1. Market Analysis, Insights and Forecast - By Country/Sub-region
- 13.1.1 Germany
- 13.1.2 France
- 13.1.3 Italy
- 13.1.4 United Kingdom
- 13.1.5 Netherlands
- 13.1.6 Rest of Europe
- 14. Asia Pacific Oxygenated Solvents Market Analysis, Insights and Forecast, 2019-2031
- 14.1. Market Analysis, Insights and Forecast - By Country/Sub-region
- 14.1.1 China
- 14.1.2 Japan
- 14.1.3 India
- 14.1.4 South Korea
- 14.1.5 Taiwan
- 14.1.6 Australia
- 14.1.7 Rest of Asia-Pacific
- 15. South America Oxygenated Solvents Market Analysis, Insights and Forecast, 2019-2031
- 15.1. Market Analysis, Insights and Forecast - By Country/Sub-region
- 15.1.1 Brazil
- 15.1.2 Argentina
- 15.1.3 Rest of South America
- 16. MEA Oxygenated Solvents Market Analysis, Insights and Forecast, 2019-2031
- 16.1. Market Analysis, Insights and Forecast - By Country/Sub-region
- 16.1.1 Middle East
- 16.1.2 Africa
- 17. Competitive Analysis
- 17.1. Global Market Share Analysis 2024
- 17.2. Company Profiles
- 17.2.1 Solvay
- 17.2.1.1. Overview
- 17.2.1.2. Products
- 17.2.1.3. SWOT Analysis
- 17.2.1.4. Recent Developments
- 17.2.1.5. Financials (Based on Availability)
- 17.2.2 Exxon Mobil Corporation
- 17.2.2.1. Overview
- 17.2.2.2. Products
- 17.2.2.3. SWOT Analysis
- 17.2.2.4. Recent Developments
- 17.2.2.5. Financials (Based on Availability)
- 17.2.3 INEOS
- 17.2.3.1. Overview
- 17.2.3.2. Products
- 17.2.3.3. SWOT Analysis
- 17.2.3.4. Recent Developments
- 17.2.3.5. Financials (Based on Availability)
- 17.2.4 OXEA GmbH
- 17.2.4.1. Overview
- 17.2.4.2. Products
- 17.2.4.3. SWOT Analysis
- 17.2.4.4. Recent Developments
- 17.2.4.5. Financials (Based on Availability)
- 17.2.5 BASF SE
- 17.2.5.1. Overview
- 17.2.5.2. Products
- 17.2.5.3. SWOT Analysis
- 17.2.5.4. Recent Developments
- 17.2.5.5. Financials (Based on Availability)
- 17.2.6 Royal Dutch Shell Plc
- 17.2.6.1. Overview
- 17.2.6.2. Products
- 17.2.6.3. SWOT Analysis
- 17.2.6.4. Recent Developments
- 17.2.6.5. Financials (Based on Availability)
- 17.2.7 Arkema Group
- 17.2.7.1. Overview
- 17.2.7.2. Products
- 17.2.7.3. SWOT Analysis
- 17.2.7.4. Recent Developments
- 17.2.7.5. Financials (Based on Availability)
- 17.2.8 Dow
- 17.2.8.1. Overview
- 17.2.8.2. Products
- 17.2.8.3. SWOT Analysis
- 17.2.8.4. Recent Developments
- 17.2.8.5. Financials (Based on Availability)
- 17.2.9 Eastman Chemical Company
- 17.2.9.1. Overview
- 17.2.9.2. Products
- 17.2.9.3. SWOT Analysis
- 17.2.9.4. Recent Developments
- 17.2.9.5. Financials (Based on Availability)
- 17.2.1 Solvay
List of Figures
- Figure 1: Global Oxygenated Solvents Market Revenue Breakdown (Million, %) by Region 2024 & 2032
- Figure 2: Global Oxygenated Solvents Market Volume Breakdown (K Tons, %) by Region 2024 & 2032
- Figure 3: North America Oxygenated Solvents Market Revenue (Million), by Country 2024 & 2032
- Figure 4: North America Oxygenated Solvents Market Volume (K Tons), by Country 2024 & 2032
- Figure 5: North America Oxygenated Solvents Market Revenue Share (%), by Country 2024 & 2032
- Figure 6: North America Oxygenated Solvents Market Volume Share (%), by Country 2024 & 2032
- Figure 7: Europe Oxygenated Solvents Market Revenue (Million), by Country 2024 & 2032
- Figure 8: Europe Oxygenated Solvents Market Volume (K Tons), by Country 2024 & 2032
- Figure 9: Europe Oxygenated Solvents Market Revenue Share (%), by Country 2024 & 2032
- Figure 10: Europe Oxygenated Solvents Market Volume Share (%), by Country 2024 & 2032
- Figure 11: Asia Pacific Oxygenated Solvents Market Revenue (Million), by Country 2024 & 2032
- Figure 12: Asia Pacific Oxygenated Solvents Market Volume (K Tons), by Country 2024 & 2032
- Figure 13: Asia Pacific Oxygenated Solvents Market Revenue Share (%), by Country 2024 & 2032
- Figure 14: Asia Pacific Oxygenated Solvents Market Volume Share (%), by Country 2024 & 2032
- Figure 15: South America Oxygenated Solvents Market Revenue (Million), by Country 2024 & 2032
- Figure 16: South America Oxygenated Solvents Market Volume (K Tons), by Country 2024 & 2032
- Figure 17: South America Oxygenated Solvents Market Revenue Share (%), by Country 2024 & 2032
- Figure 18: South America Oxygenated Solvents Market Volume Share (%), by Country 2024 & 2032
- Figure 19: MEA Oxygenated Solvents Market Revenue (Million), by Country 2024 & 2032
- Figure 20: MEA Oxygenated Solvents Market Volume (K Tons), by Country 2024 & 2032
- Figure 21: MEA Oxygenated Solvents Market Revenue Share (%), by Country 2024 & 2032
- Figure 22: MEA Oxygenated Solvents Market Volume Share (%), by Country 2024 & 2032
- Figure 23: Asia Pacific Oxygenated Solvents Market Revenue (Million), by Type 2024 & 2032
- Figure 24: Asia Pacific Oxygenated Solvents Market Volume (K Tons), by Type 2024 & 2032
- Figure 25: Asia Pacific Oxygenated Solvents Market Revenue Share (%), by Type 2024 & 2032
- Figure 26: Asia Pacific Oxygenated Solvents Market Volume Share (%), by Type 2024 & 2032
- Figure 27: Asia Pacific Oxygenated Solvents Market Revenue (Million), by Application 2024 & 2032
- Figure 28: Asia Pacific Oxygenated Solvents Market Volume (K Tons), by Application 2024 & 2032
- Figure 29: Asia Pacific Oxygenated Solvents Market Revenue Share (%), by Application 2024 & 2032
- Figure 30: Asia Pacific Oxygenated Solvents Market Volume Share (%), by Application 2024 & 2032
- Figure 31: Asia Pacific Oxygenated Solvents Market Revenue (Million), by Country 2024 & 2032
- Figure 32: Asia Pacific Oxygenated Solvents Market Volume (K Tons), by Country 2024 & 2032
- Figure 33: Asia Pacific Oxygenated Solvents Market Revenue Share (%), by Country 2024 & 2032
- Figure 34: Asia Pacific Oxygenated Solvents Market Volume Share (%), by Country 2024 & 2032
- Figure 35: North America Oxygenated Solvents Market Revenue (Million), by Type 2024 & 2032
- Figure 36: North America Oxygenated Solvents Market Volume (K Tons), by Type 2024 & 2032
- Figure 37: North America Oxygenated Solvents Market Revenue Share (%), by Type 2024 & 2032
- Figure 38: North America Oxygenated Solvents Market Volume Share (%), by Type 2024 & 2032
- Figure 39: North America Oxygenated Solvents Market Revenue (Million), by Application 2024 & 2032
- Figure 40: North America Oxygenated Solvents Market Volume (K Tons), by Application 2024 & 2032
- Figure 41: North America Oxygenated Solvents Market Revenue Share (%), by Application 2024 & 2032
- Figure 42: North America Oxygenated Solvents Market Volume Share (%), by Application 2024 & 2032
- Figure 43: North America Oxygenated Solvents Market Revenue (Million), by Country 2024 & 2032
- Figure 44: North America Oxygenated Solvents Market Volume (K Tons), by Country 2024 & 2032
- Figure 45: North America Oxygenated Solvents Market Revenue Share (%), by Country 2024 & 2032
- Figure 46: North America Oxygenated Solvents Market Volume Share (%), by Country 2024 & 2032
- Figure 47: Europe Oxygenated Solvents Market Revenue (Million), by Type 2024 & 2032
- Figure 48: Europe Oxygenated Solvents Market Volume (K Tons), by Type 2024 & 2032
- Figure 49: Europe Oxygenated Solvents Market Revenue Share (%), by Type 2024 & 2032
- Figure 50: Europe Oxygenated Solvents Market Volume Share (%), by Type 2024 & 2032
- Figure 51: Europe Oxygenated Solvents Market Revenue (Million), by Application 2024 & 2032
- Figure 52: Europe Oxygenated Solvents Market Volume (K Tons), by Application 2024 & 2032
- Figure 53: Europe Oxygenated Solvents Market Revenue Share (%), by Application 2024 & 2032
- Figure 54: Europe Oxygenated Solvents Market Volume Share (%), by Application 2024 & 2032
- Figure 55: Europe Oxygenated Solvents Market Revenue (Million), by Country 2024 & 2032
- Figure 56: Europe Oxygenated Solvents Market Volume (K Tons), by Country 2024 & 2032
- Figure 57: Europe Oxygenated Solvents Market Revenue Share (%), by Country 2024 & 2032
- Figure 58: Europe Oxygenated Solvents Market Volume Share (%), by Country 2024 & 2032
- Figure 59: South America Oxygenated Solvents Market Revenue (Million), by Type 2024 & 2032
- Figure 60: South America Oxygenated Solvents Market Volume (K Tons), by Type 2024 & 2032
- Figure 61: South America Oxygenated Solvents Market Revenue Share (%), by Type 2024 & 2032
- Figure 62: South America Oxygenated Solvents Market Volume Share (%), by Type 2024 & 2032
- Figure 63: South America Oxygenated Solvents Market Revenue (Million), by Application 2024 & 2032
- Figure 64: South America Oxygenated Solvents Market Volume (K Tons), by Application 2024 & 2032
- Figure 65: South America Oxygenated Solvents Market Revenue Share (%), by Application 2024 & 2032
- Figure 66: South America Oxygenated Solvents Market Volume Share (%), by Application 2024 & 2032
- Figure 67: South America Oxygenated Solvents Market Revenue (Million), by Country 2024 & 2032
- Figure 68: South America Oxygenated Solvents Market Volume (K Tons), by Country 2024 & 2032
- Figure 69: South America Oxygenated Solvents Market Revenue Share (%), by Country 2024 & 2032
- Figure 70: South America Oxygenated Solvents Market Volume Share (%), by Country 2024 & 2032
- Figure 71: Middle East Oxygenated Solvents Market Revenue (Million), by Type 2024 & 2032
- Figure 72: Middle East Oxygenated Solvents Market Volume (K Tons), by Type 2024 & 2032
- Figure 73: Middle East Oxygenated Solvents Market Revenue Share (%), by Type 2024 & 2032
- Figure 74: Middle East Oxygenated Solvents Market Volume Share (%), by Type 2024 & 2032
- Figure 75: Middle East Oxygenated Solvents Market Revenue (Million), by Application 2024 & 2032
- Figure 76: Middle East Oxygenated Solvents Market Volume (K Tons), by Application 2024 & 2032
- Figure 77: Middle East Oxygenated Solvents Market Revenue Share (%), by Application 2024 & 2032
- Figure 78: Middle East Oxygenated Solvents Market Volume Share (%), by Application 2024 & 2032
- Figure 79: Middle East Oxygenated Solvents Market Revenue (Million), by Country 2024 & 2032
- Figure 80: Middle East Oxygenated Solvents Market Volume (K Tons), by Country 2024 & 2032
- Figure 81: Middle East Oxygenated Solvents Market Revenue Share (%), by Country 2024 & 2032
- Figure 82: Middle East Oxygenated Solvents Market Volume Share (%), by Country 2024 & 2032
- Figure 83: Saudi Arabia Oxygenated Solvents Market Revenue (Million), by Type 2024 & 2032
- Figure 84: Saudi Arabia Oxygenated Solvents Market Volume (K Tons), by Type 2024 & 2032
- Figure 85: Saudi Arabia Oxygenated Solvents Market Revenue Share (%), by Type 2024 & 2032
- Figure 86: Saudi Arabia Oxygenated Solvents Market Volume Share (%), by Type 2024 & 2032
- Figure 87: Saudi Arabia Oxygenated Solvents Market Revenue (Million), by Application 2024 & 2032
- Figure 88: Saudi Arabia Oxygenated Solvents Market Volume (K Tons), by Application 2024 & 2032
- Figure 89: Saudi Arabia Oxygenated Solvents Market Revenue Share (%), by Application 2024 & 2032
- Figure 90: Saudi Arabia Oxygenated Solvents Market Volume Share (%), by Application 2024 & 2032
- Figure 91: Saudi Arabia Oxygenated Solvents Market Revenue (Million), by Country 2024 & 2032
- Figure 92: Saudi Arabia Oxygenated Solvents Market Volume (K Tons), by Country 2024 & 2032
- Figure 93: Saudi Arabia Oxygenated Solvents Market Revenue Share (%), by Country 2024 & 2032
- Figure 94: Saudi Arabia Oxygenated Solvents Market Volume Share (%), by Country 2024 & 2032
List of Tables
- Table 1: Global Oxygenated Solvents Market Revenue Million Forecast, by Region 2019 & 2032
- Table 2: Global Oxygenated Solvents Market Volume K Tons Forecast, by Region 2019 & 2032
- Table 3: Global Oxygenated Solvents Market Revenue Million Forecast, by Type 2019 & 2032
- Table 4: Global Oxygenated Solvents Market Volume K Tons Forecast, by Type 2019 & 2032
- Table 5: Global Oxygenated Solvents Market Revenue Million Forecast, by Application 2019 & 2032
- Table 6: Global Oxygenated Solvents Market Volume K Tons Forecast, by Application 2019 & 2032
- Table 7: Global Oxygenated Solvents Market Revenue Million Forecast, by Region 2019 & 2032
- Table 8: Global Oxygenated Solvents Market Volume K Tons Forecast, by Region 2019 & 2032
- Table 9: Global Oxygenated Solvents Market Revenue Million Forecast, by Country 2019 & 2032
- Table 10: Global Oxygenated Solvents Market Volume K Tons Forecast, by Country 2019 & 2032
- Table 11: United States Oxygenated Solvents Market Revenue (Million) Forecast, by Application 2019 & 2032
- Table 12: United States Oxygenated Solvents Market Volume (K Tons) Forecast, by Application 2019 & 2032
- Table 13: Canada Oxygenated Solvents Market Revenue (Million) Forecast, by Application 2019 & 2032
- Table 14: Canada Oxygenated Solvents Market Volume (K Tons) Forecast, by Application 2019 & 2032
- Table 15: Mexico Oxygenated Solvents Market Revenue (Million) Forecast, by Application 2019 & 2032
- Table 16: Mexico Oxygenated Solvents Market Volume (K Tons) Forecast, by Application 2019 & 2032
- Table 17: Global Oxygenated Solvents Market Revenue Million Forecast, by Country 2019 & 2032
- Table 18: Global Oxygenated Solvents Market Volume K Tons Forecast, by Country 2019 & 2032
- Table 19: Germany Oxygenated Solvents Market Revenue (Million) Forecast, by Application 2019 & 2032
- Table 20: Germany Oxygenated Solvents Market Volume (K Tons) Forecast, by Application 2019 & 2032
- Table 21: France Oxygenated Solvents Market Revenue (Million) Forecast, by Application 2019 & 2032
- Table 22: France Oxygenated Solvents Market Volume (K Tons) Forecast, by Application 2019 & 2032
- Table 23: Italy Oxygenated Solvents Market Revenue (Million) Forecast, by Application 2019 & 2032
- Table 24: Italy Oxygenated Solvents Market Volume (K Tons) Forecast, by Application 2019 & 2032
- Table 25: United Kingdom Oxygenated Solvents Market Revenue (Million) Forecast, by Application 2019 & 2032
- Table 26: United Kingdom Oxygenated Solvents Market Volume (K Tons) Forecast, by Application 2019 & 2032
- Table 27: Netherlands Oxygenated Solvents Market Revenue (Million) Forecast, by Application 2019 & 2032
- Table 28: Netherlands Oxygenated Solvents Market Volume (K Tons) Forecast, by Application 2019 & 2032
- Table 29: Rest of Europe Oxygenated Solvents Market Revenue (Million) Forecast, by Application 2019 & 2032
- Table 30: Rest of Europe Oxygenated Solvents Market Volume (K Tons) Forecast, by Application 2019 & 2032
- Table 31: Global Oxygenated Solvents Market Revenue Million Forecast, by Country 2019 & 2032
- Table 32: Global Oxygenated Solvents Market Volume K Tons Forecast, by Country 2019 & 2032
- Table 33: China Oxygenated Solvents Market Revenue (Million) Forecast, by Application 2019 & 2032
- Table 34: China Oxygenated Solvents Market Volume (K Tons) Forecast, by Application 2019 & 2032
- Table 35: Japan Oxygenated Solvents Market Revenue (Million) Forecast, by Application 2019 & 2032
- Table 36: Japan Oxygenated Solvents Market Volume (K Tons) Forecast, by Application 2019 & 2032
- Table 37: India Oxygenated Solvents Market Revenue (Million) Forecast, by Application 2019 & 2032
- Table 38: India Oxygenated Solvents Market Volume (K Tons) Forecast, by Application 2019 & 2032
- Table 39: South Korea Oxygenated Solvents Market Revenue (Million) Forecast, by Application 2019 & 2032
- Table 40: South Korea Oxygenated Solvents Market Volume (K Tons) Forecast, by Application 2019 & 2032
- Table 41: Taiwan Oxygenated Solvents Market Revenue (Million) Forecast, by Application 2019 & 2032
- Table 42: Taiwan Oxygenated Solvents Market Volume (K Tons) Forecast, by Application 2019 & 2032
- Table 43: Australia Oxygenated Solvents Market Revenue (Million) Forecast, by Application 2019 & 2032
- Table 44: Australia Oxygenated Solvents Market Volume (K Tons) Forecast, by Application 2019 & 2032
- Table 45: Rest of Asia-Pacific Oxygenated Solvents Market Revenue (Million) Forecast, by Application 2019 & 2032
- Table 46: Rest of Asia-Pacific Oxygenated Solvents Market Volume (K Tons) Forecast, by Application 2019 & 2032
- Table 47: Global Oxygenated Solvents Market Revenue Million Forecast, by Country 2019 & 2032
- Table 48: Global Oxygenated Solvents Market Volume K Tons Forecast, by Country 2019 & 2032
- Table 49: Brazil Oxygenated Solvents Market Revenue (Million) Forecast, by Application 2019 & 2032
- Table 50: Brazil Oxygenated Solvents Market Volume (K Tons) Forecast, by Application 2019 & 2032
- Table 51: Argentina Oxygenated Solvents Market Revenue (Million) Forecast, by Application 2019 & 2032
- Table 52: Argentina Oxygenated Solvents Market Volume (K Tons) Forecast, by Application 2019 & 2032
- Table 53: Rest of South America Oxygenated Solvents Market Revenue (Million) Forecast, by Application 2019 & 2032
- Table 54: Rest of South America Oxygenated Solvents Market Volume (K Tons) Forecast, by Application 2019 & 2032
- Table 55: Global Oxygenated Solvents Market Revenue Million Forecast, by Country 2019 & 2032
- Table 56: Global Oxygenated Solvents Market Volume K Tons Forecast, by Country 2019 & 2032
- Table 57: Middle East Oxygenated Solvents Market Revenue (Million) Forecast, by Application 2019 & 2032
- Table 58: Middle East Oxygenated Solvents Market Volume (K Tons) Forecast, by Application 2019 & 2032
- Table 59: Africa Oxygenated Solvents Market Revenue (Million) Forecast, by Application 2019 & 2032
- Table 60: Africa Oxygenated Solvents Market Volume (K Tons) Forecast, by Application 2019 & 2032
- Table 61: Global Oxygenated Solvents Market Revenue Million Forecast, by Type 2019 & 2032
- Table 62: Global Oxygenated Solvents Market Volume K Tons Forecast, by Type 2019 & 2032
- Table 63: Global Oxygenated Solvents Market Revenue Million Forecast, by Application 2019 & 2032
- Table 64: Global Oxygenated Solvents Market Volume K Tons Forecast, by Application 2019 & 2032
- Table 65: Global Oxygenated Solvents Market Revenue Million Forecast, by Country 2019 & 2032
- Table 66: Global Oxygenated Solvents Market Volume K Tons Forecast, by Country 2019 & 2032
- Table 67: China Oxygenated Solvents Market Revenue (Million) Forecast, by Application 2019 & 2032
- Table 68: China Oxygenated Solvents Market Volume (K Tons) Forecast, by Application 2019 & 2032
- Table 69: India Oxygenated Solvents Market Revenue (Million) Forecast, by Application 2019 & 2032
- Table 70: India Oxygenated Solvents Market Volume (K Tons) Forecast, by Application 2019 & 2032
- Table 71: Japan Oxygenated Solvents Market Revenue (Million) Forecast, by Application 2019 & 2032
- Table 72: Japan Oxygenated Solvents Market Volume (K Tons) Forecast, by Application 2019 & 2032
- Table 73: South Korea Oxygenated Solvents Market Revenue (Million) Forecast, by Application 2019 & 2032
- Table 74: South Korea Oxygenated Solvents Market Volume (K Tons) Forecast, by Application 2019 & 2032
- Table 75: Rest of Asia Pacific Oxygenated Solvents Market Revenue (Million) Forecast, by Application 2019 & 2032
- Table 76: Rest of Asia Pacific Oxygenated Solvents Market Volume (K Tons) Forecast, by Application 2019 & 2032
- Table 77: Global Oxygenated Solvents Market Revenue Million Forecast, by Type 2019 & 2032
- Table 78: Global Oxygenated Solvents Market Volume K Tons Forecast, by Type 2019 & 2032
- Table 79: Global Oxygenated Solvents Market Revenue Million Forecast, by Application 2019 & 2032
- Table 80: Global Oxygenated Solvents Market Volume K Tons Forecast, by Application 2019 & 2032
- Table 81: Global Oxygenated Solvents Market Revenue Million Forecast, by Country 2019 & 2032
- Table 82: Global Oxygenated Solvents Market Volume K Tons Forecast, by Country 2019 & 2032
- Table 83: United States Oxygenated Solvents Market Revenue (Million) Forecast, by Application 2019 & 2032
- Table 84: United States Oxygenated Solvents Market Volume (K Tons) Forecast, by Application 2019 & 2032
- Table 85: Canada Oxygenated Solvents Market Revenue (Million) Forecast, by Application 2019 & 2032
- Table 86: Canada Oxygenated Solvents Market Volume (K Tons) Forecast, by Application 2019 & 2032
- Table 87: Mexico Oxygenated Solvents Market Revenue (Million) Forecast, by Application 2019 & 2032
- Table 88: Mexico Oxygenated Solvents Market Volume (K Tons) Forecast, by Application 2019 & 2032
- Table 89: Global Oxygenated Solvents Market Revenue Million Forecast, by Type 2019 & 2032
- Table 90: Global Oxygenated Solvents Market Volume K Tons Forecast, by Type 2019 & 2032
- Table 91: Global Oxygenated Solvents Market Revenue Million Forecast, by Application 2019 & 2032
- Table 92: Global Oxygenated Solvents Market Volume K Tons Forecast, by Application 2019 & 2032
- Table 93: Global Oxygenated Solvents Market Revenue Million Forecast, by Country 2019 & 2032
- Table 94: Global Oxygenated Solvents Market Volume K Tons Forecast, by Country 2019 & 2032
- Table 95: Germany Oxygenated Solvents Market Revenue (Million) Forecast, by Application 2019 & 2032
- Table 96: Germany Oxygenated Solvents Market Volume (K Tons) Forecast, by Application 2019 & 2032
- Table 97: United Kingdom Oxygenated Solvents Market Revenue (Million) Forecast, by Application 2019 & 2032
- Table 98: United Kingdom Oxygenated Solvents Market Volume (K Tons) Forecast, by Application 2019 & 2032
- Table 99: France Oxygenated Solvents Market Revenue (Million) Forecast, by Application 2019 & 2032
- Table 100: France Oxygenated Solvents Market Volume (K Tons) Forecast, by Application 2019 & 2032
- Table 101: Italy Oxygenated Solvents Market Revenue (Million) Forecast, by Application 2019 & 2032
- Table 102: Italy Oxygenated Solvents Market Volume (K Tons) Forecast, by Application 2019 & 2032
- Table 103: Rest of Europe Oxygenated Solvents Market Revenue (Million) Forecast, by Application 2019 & 2032
- Table 104: Rest of Europe Oxygenated Solvents Market Volume (K Tons) Forecast, by Application 2019 & 2032
- Table 105: Global Oxygenated Solvents Market Revenue Million Forecast, by Type 2019 & 2032
- Table 106: Global Oxygenated Solvents Market Volume K Tons Forecast, by Type 2019 & 2032
- Table 107: Global Oxygenated Solvents Market Revenue Million Forecast, by Application 2019 & 2032
- Table 108: Global Oxygenated Solvents Market Volume K Tons Forecast, by Application 2019 & 2032
- Table 109: Global Oxygenated Solvents Market Revenue Million Forecast, by Country 2019 & 2032
- Table 110: Global Oxygenated Solvents Market Volume K Tons Forecast, by Country 2019 & 2032
- Table 111: Brazil Oxygenated Solvents Market Revenue (Million) Forecast, by Application 2019 & 2032
- Table 112: Brazil Oxygenated Solvents Market Volume (K Tons) Forecast, by Application 2019 & 2032
- Table 113: Argentina Oxygenated Solvents Market Revenue (Million) Forecast, by Application 2019 & 2032
- Table 114: Argentina Oxygenated Solvents Market Volume (K Tons) Forecast, by Application 2019 & 2032
- Table 115: Rest of South America Oxygenated Solvents Market Revenue (Million) Forecast, by Application 2019 & 2032
- Table 116: Rest of South America Oxygenated Solvents Market Volume (K Tons) Forecast, by Application 2019 & 2032
- Table 117: Global Oxygenated Solvents Market Revenue Million Forecast, by Type 2019 & 2032
- Table 118: Global Oxygenated Solvents Market Volume K Tons Forecast, by Type 2019 & 2032
- Table 119: Global Oxygenated Solvents Market Revenue Million Forecast, by Application 2019 & 2032
- Table 120: Global Oxygenated Solvents Market Volume K Tons Forecast, by Application 2019 & 2032
- Table 121: Global Oxygenated Solvents Market Revenue Million Forecast, by Country 2019 & 2032
- Table 122: Global Oxygenated Solvents Market Volume K Tons Forecast, by Country 2019 & 2032
- Table 123: Global Oxygenated Solvents Market Revenue Million Forecast, by Type 2019 & 2032
- Table 124: Global Oxygenated Solvents Market Volume K Tons Forecast, by Type 2019 & 2032
- Table 125: Global Oxygenated Solvents Market Revenue Million Forecast, by Application 2019 & 2032
- Table 126: Global Oxygenated Solvents Market Volume K Tons Forecast, by Application 2019 & 2032
- Table 127: Global Oxygenated Solvents Market Revenue Million Forecast, by Country 2019 & 2032
- Table 128: Global Oxygenated Solvents Market Volume K Tons Forecast, by Country 2019 & 2032
- Table 129: South Africa Oxygenated Solvents Market Revenue (Million) Forecast, by Application 2019 & 2032
- Table 130: South Africa Oxygenated Solvents Market Volume (K Tons) Forecast, by Application 2019 & 2032
- Table 131: Rest of Middle East Oxygenated Solvents Market Revenue (Million) Forecast, by Application 2019 & 2032
- Table 132: Rest of Middle East Oxygenated Solvents Market Volume (K Tons) Forecast, by Application 2019 & 2032
Frequently Asked Questions
1. What is the projected Compound Annual Growth Rate (CAGR) of the Oxygenated Solvents Market?
The projected CAGR is approximately > 7.00%.
2. Which companies are prominent players in the Oxygenated Solvents Market?
Key companies in the market include Solvay, Exxon Mobil Corporation, INEOS, OXEA GmbH, BASF SE, Royal Dutch Shell Plc, Arkema Group, Dow, Eastman Chemical Company.
3. What are the main segments of the Oxygenated Solvents Market?
The market segments include Type, Application.
4. Can you provide details about the market size?
The market size is estimated to be USD XX Million as of 2022.
5. What are some drivers contributing to market growth?
; Growing Applications across Various Industries; Other Drivers.
6. What are the notable trends driving market growth?
Paints & Coatings Segment to Propel the Demand.
7. Are there any restraints impacting market growth?
; Unfavourable Conditions Arising due to the COVID-19 Outbreak; Other Restraints.
8. Can you provide examples of recent developments in the market?
N/A
9. What pricing options are available for accessing the report?
Pricing options include single-user, multi-user, and enterprise licenses priced at USD 4750, USD 5250, and USD 8750 respectively.
10. Is the market size provided in terms of value or volume?
The market size is provided in terms of value, measured in Million and volume, measured in K Tons.
11. Are there any specific market keywords associated with the report?
Yes, the market keyword associated with the report is "Oxygenated Solvents Market," which aids in identifying and referencing the specific market segment covered.
12. How do I determine which pricing option suits my needs best?
The pricing options vary based on user requirements and access needs. Individual users may opt for single-user licenses, while businesses requiring broader access may choose multi-user or enterprise licenses for cost-effective access to the report.
13. Are there any additional resources or data provided in the Oxygenated Solvents Market report?
While the report offers comprehensive insights, it's advisable to review the specific contents or supplementary materials provided to ascertain if additional resources or data are available.
14. How can I stay updated on further developments or reports in the Oxygenated Solvents Market?
To stay informed about further developments, trends, and reports in the Oxygenated Solvents Market, consider subscribing to industry newsletters, following relevant companies and organizations, or regularly checking reputable industry news sources and publications.
Methodology
Step 1 - Identification of Relevant Samples Size from Population Database


Step 2 - Approaches for Defining Global Market Size (Value, Volume* & Price*)

Note*: In applicable scenarios
Step 3 - Data Sources
Primary Research
- Web Analytics
- Survey Reports
- Research Institute
- Latest Research Reports
- Opinion Leaders
Secondary Research
- Annual Reports
- White Paper
- Latest Press Release
- Industry Association
- Paid Database
- Investor Presentations

Step 4 - Data Triangulation
Involves using different sources of information in order to increase the validity of a study
These sources are likely to be stakeholders in a program - participants, other researchers, program staff, other community members, and so on.
Then we put all data in single framework & apply various statistical tools to find out the dynamic on the market.
During the analysis stage, feedback from the stakeholder groups would be compared to determine areas of agreement as well as areas of divergence


