
Key Insights
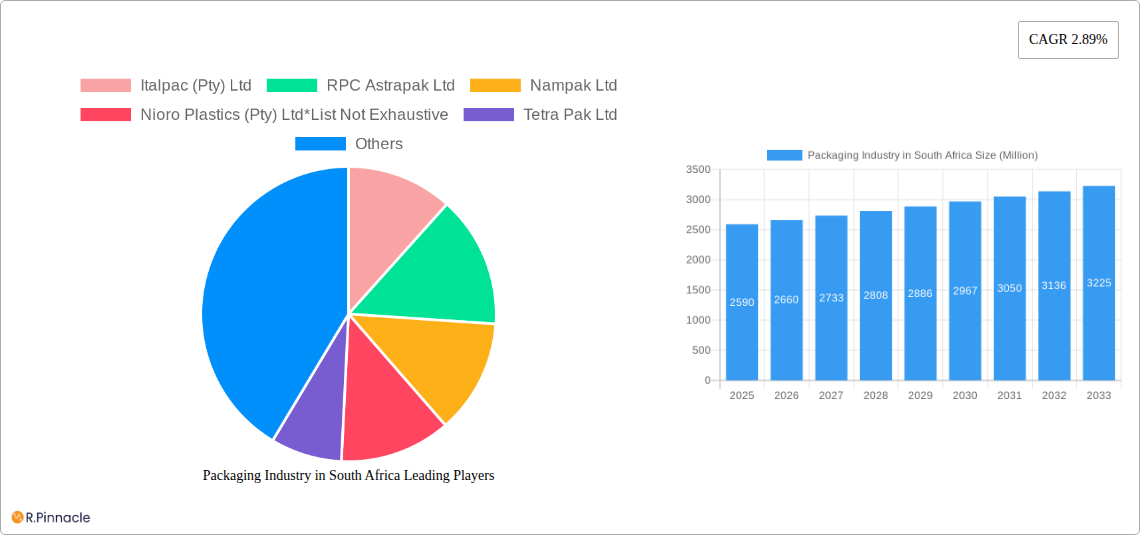
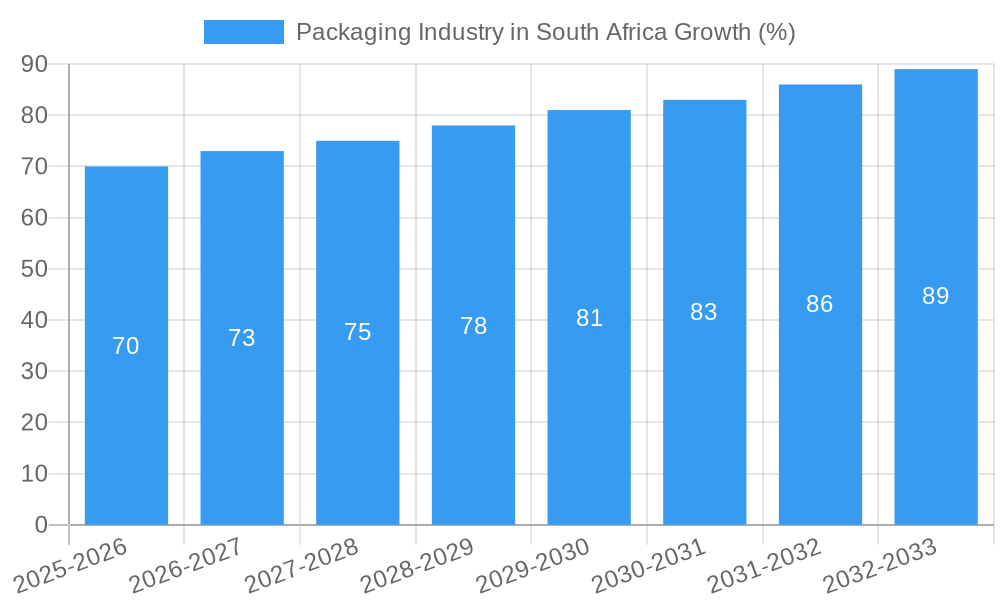
The South African packaging industry, valued at $2.59 billion in 2025, exhibits a steady growth trajectory, projected to expand at a Compound Annual Growth Rate (CAGR) of 2.89% from 2025 to 2033. This growth is fueled by several key drivers. The increasing demand for packaged food and beverages, driven by a growing population and changing consumer lifestyles, is a primary factor. Furthermore, the burgeoning healthcare and pharmaceuticals sector, coupled with the expanding personal and homecare market, significantly contribute to industry demand. The preference for convenient and shelf-stable products necessitates robust packaging solutions, bolstering market growth. Trends such as sustainable packaging options, utilizing recyclable materials like PE, PP, and PET, are gaining traction, aligning with growing environmental awareness among consumers and businesses alike. However, factors such as fluctuating raw material prices and stringent regulations regarding plastic waste management pose challenges to industry growth. The market is segmented by product type (bottles & jars, pouches, bags, films & wraps), plastic type (rigid, flexible), material (PE, PP, PVC, PS, PET), and end-user industry (food, beverages, healthcare, personal & homecare). Major players like Italpac, RPC Astrapak, Nampak, and Amcor compete in this dynamic market, adapting to shifting consumer preferences and regulatory landscapes. The forecast period reflects a conservative estimate of continued growth, based on the observed trends and considering potential economic fluctuations.
The South African packaging market is characterized by a diverse range of packaging types and materials catering to various sectors. While rigid packaging, particularly bottles and jars, remains dominant, the increasing popularity of flexible packaging (pouches and films) is noteworthy, driven by its cost-effectiveness and suitability for various products. The food and beverage sector continues to be the largest consumer, but growth in the healthcare and personal care segments is adding momentum to the overall market. The dominance of established players suggests a degree of market consolidation, although smaller, specialized companies continue to emerge, offering innovative solutions and catering to niche markets. The ongoing focus on sustainability is expected to accelerate the adoption of eco-friendly materials and packaging designs, presenting both challenges and opportunities for industry participants. Understanding the interplay of these factors is key to navigating the complexities and capturing opportunities within the South African packaging market.
This comprehensive report provides an in-depth analysis of the South African packaging industry, offering invaluable insights for industry professionals, investors, and strategic decision-makers. With a detailed forecast spanning from 2019 to 2033 (base year 2025), this report leverages extensive market research to illuminate current trends and future growth potential. The study period covers 2019-2024 (historical), with projections extending to 2033. The report meticulously examines market segmentation by product type, plastic type, material, and end-user industry, providing a granular understanding of this dynamic sector.
Packaging Industry in South Africa Market Structure & Innovation Trends
The South African packaging industry is characterized by a moderately concentrated market structure, with key players like Nampak Ltd, RPC Astrapak Ltd, and Mpact Ltd holding significant market share. However, the presence of numerous smaller players and ongoing M&A activity suggests a dynamic competitive landscape. Innovation is driven by increasing consumer demand for sustainable and convenient packaging solutions, alongside stringent government regulations promoting circular economy principles. The industry witnesses continuous innovation in materials, designs, and manufacturing processes to meet these evolving needs. Market share data for the top three players in 2024 is estimated at Nampak (35%), RPC Astrapak (20%), and Mpact (15%). The total estimated M&A deal value in the industry between 2019 and 2024 was approximately Rxx Million.
- Market Concentration: Moderately concentrated with a few major players and numerous smaller companies.
- Innovation Drivers: Sustainability concerns, consumer demand, regulatory pressures, technological advancements.
- Regulatory Framework: Stringent regulations concerning plastic waste and Extended Producer Responsibility (EPR).
- Product Substitutes: Growing interest in biodegradable and compostable alternatives.
- End-User Demographics: Shifting consumer preferences towards convenience and sustainability.
- M&A Activities: Significant M&A activity reflects the industry's consolidation and growth.
Packaging Industry in South Africa Market Dynamics & Trends
The South African packaging market is experiencing robust growth, driven primarily by the expanding food and beverage, healthcare, and personal care sectors. Technological advancements, such as flexible packaging and smart packaging solutions, are transforming the industry. Consumer preferences are increasingly shifting towards sustainable and eco-friendly packaging options, pushing companies to innovate and adopt circular economy principles. Competitive dynamics are shaped by price competition, product differentiation, and the adoption of innovative technologies. The CAGR for the packaging industry during the forecast period (2025-2033) is projected to be xx%. Market penetration of sustainable packaging is estimated at xx% in 2025.
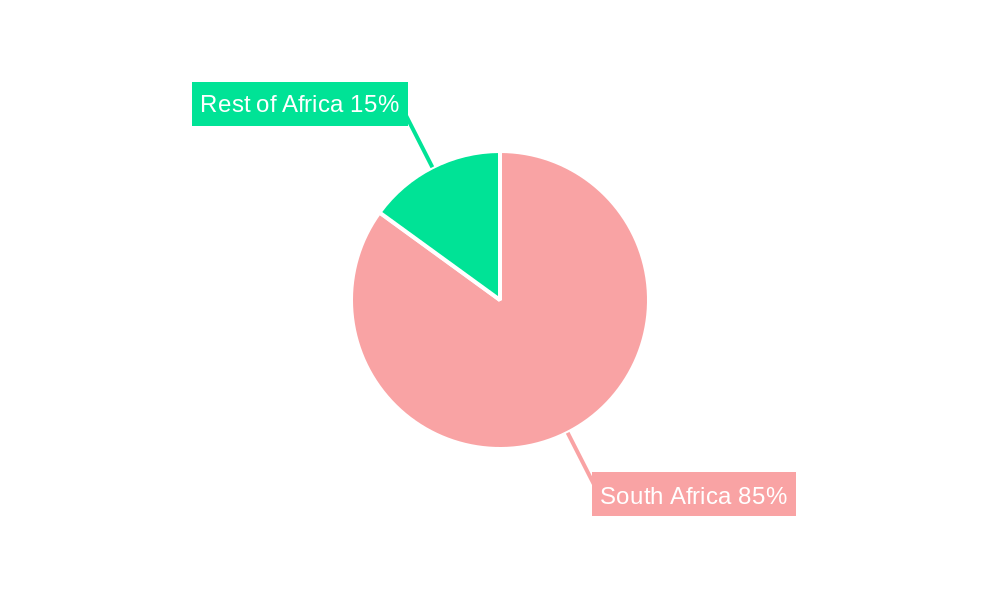
Dominant Regions & Segments in Packaging Industry in South Africa
The Gauteng province dominates the South African packaging market due to its well-established industrial infrastructure and proximity to major consumption centers. The Bottles and Jars segment holds the largest market share by product type, driven by the high demand from the food and beverage industry. Rigid plastics dominate by type of plastic due to their robust nature and suitability for various applications. PET material commands a significant portion of the market by material type due to its versatility and recyclability.
Key Drivers:
- Well-developed infrastructure.
- Proximity to major consumer markets.
- High concentration of manufacturing facilities.
- Favorable government policies.
Dominant Segments:
- By Product Type: Bottles and Jars
- By Type of Plastic: Rigid
- By Material: PET
- By End-User Industry: Food and Beverages
Packaging Industry in South Africa Product Innovations
Recent innovations focus on sustainable packaging materials, such as bioplastics and recycled content, alongside improved barrier properties and enhanced convenience features. Smart packaging technologies are also gaining traction, providing consumers with information about product origin, freshness, and usage instructions. This increased focus on sustainability aligns with global trends and addresses the growing demand for eco-friendly solutions within the South African market.
Report Scope & Segmentation Analysis
This report segments the South African packaging market by: Product Type (Bottles & Jars, Pouches, Bags, Films & Wraps, Other); Type of Plastic (Rigid, Flexible); Material (PE, PP, PVC, PS, PET, Other); and End-User Industry (Food, Beverages, Healthcare & Pharmaceuticals, Personal & Homecare, Other). Each segment's growth projections, market size estimates, and competitive landscape are meticulously analyzed, providing a comprehensive overview of the market dynamics. The market size for each segment in 2025 is projected as follows (in Million ZAR): Bottles & Jars (xx), Pouches (xx), Bags (xx), Films & Wraps (xx), Other (xx).
Key Drivers of Packaging Industry in South Africa Growth
Growth is propelled by rising consumer spending, increasing demand for packaged goods across diverse sectors, and technological advancements in packaging materials and technologies. Government initiatives supporting sustainable packaging and the circular economy, combined with the expansion of the food and beverage industry, further boost market expansion.
Challenges in the Packaging Industry in South Africa Sector
Key challenges include fluctuating raw material prices, stringent environmental regulations, and the need to manage plastic waste effectively. Supply chain disruptions and intense competition also present significant hurdles for market participants. These factors directly impact production costs, profitability, and the overall sustainability of the industry.
Emerging Opportunities in Packaging Industry in South Africa
The market presents significant opportunities in sustainable packaging solutions, e-commerce packaging, and innovative food packaging technologies. Growing consumer awareness of environmental issues and the increasing adoption of e-commerce platforms create favorable conditions for market expansion in these specific areas.
Leading Players in the Packaging Industry in South Africa Market
- Italpac (Pty) Ltd
- RPC Astrapak Ltd
- Nampak Ltd
- Nioro Plastics (Pty) Ltd
- Tetra Pak Ltd
- Mondi PLC
- Mpact Ltd
- Amcor Limited
- Sealed Air Corporation
- Constantia Flexibles Corporation
Key Developments in Packaging Industry in South Africa Industry
- May 2021: Introduction of the Extended Producer Responsibility (EPR) fee for plastic packaging, significantly impacting industry players' cost structures and prompting investment in recycling infrastructure.
- January 2020: Launch of the South African Plastics Pact, a collaborative initiative aiming to transition towards a circular economy for plastics, promoting sustainable practices and reducing plastic waste.
Future Outlook for Packaging Industry in South Africa Market
The South African packaging market is poised for continued growth, driven by rising demand for packaged goods, increasing adoption of sustainable packaging solutions, and technological advancements. Strategic partnerships, investments in sustainable practices, and innovation in packaging materials will be crucial factors shaping the industry's future trajectory.
Packaging Industry in South Africa Segmentation
-
1. Product Type
- 1.1. Bottles and Jars
- 1.2. Pouches
- 1.3. Bags
- 1.4. Films and Wraps
- 1.5. Other Product Types
-
2. Type of Plastic
- 2.1. Rigid
- 2.2. Flexible
-
3. Material
- 3.1. Polyethylene (PE)
- 3.2. Polypropylene (PP)
- 3.3. Polyvinyl Chloride (PVC)
- 3.4. Polyethylene Terephthalate (PET)
- 3.5. Other Materials
-
4. End-user Industry
- 4.1. Food
- 4.2. Beverages
- 4.3. Healthcare and Pharmaceuticals
- 4.4. Personal and Home Care
- 4.5. Other End-user Industries
Packaging Industry in South Africa Segmentation By Geography
-
1. North America
- 1.1. United States
- 1.2. Canada
- 1.3. Mexico
-
2. South America
- 2.1. Brazil
- 2.2. Argentina
- 2.3. Rest of South America
-
3. Europe
- 3.1. United Kingdom
- 3.2. Germany
- 3.3. France
- 3.4. Italy
- 3.5. Spain
- 3.6. Russia
- 3.7. Benelux
- 3.8. Nordics
- 3.9. Rest of Europe
-
4. Middle East & Africa
- 4.1. Turkey
- 4.2. Israel
- 4.3. GCC
- 4.4. North Africa
- 4.5. South Africa
- 4.6. Rest of Middle East & Africa
-
5. Asia Pacific
- 5.1. China
- 5.2. India
- 5.3. Japan
- 5.4. South Korea
- 5.5. ASEAN
- 5.6. Oceania
- 5.7. Rest of Asia Pacific
Packaging Industry in South Africa REPORT HIGHLIGHTS
| Aspects | Details |
|---|---|
| Study Period | 2019-2033 |
| Base Year | 2024 |
| Estimated Year | 2025 |
| Forecast Period | 2025-2033 |
| Historical Period | 2019-2024 |
| Growth Rate | CAGR of 2.89% from 2019-2033 |
| Segmentation |
|
Table of Contents
- 1. Introduction
- 1.1. Research Scope
- 1.2. Market Segmentation
- 1.3. Research Methodology
- 1.4. Definitions and Assumptions
- 2. Executive Summary
- 2.1. Introduction
- 3. Market Dynamics
- 3.1. Introduction
- 3.2. Market Drivers
- 3.2.1. Growing Demand for Consumer Goods; Favorable Packaging Properties Possessed by Plastic
- 3.3. Market Restrains
- 3.3.1. Fluctuating Raw Material Prices
- 3.4. Market Trends
- 3.4.1. Aggressive Recycling Rates of Plastic Products within the Country and an increase in Waste Generation
- 4. Market Factor Analysis
- 4.1. Porters Five Forces
- 4.2. Supply/Value Chain
- 4.3. PESTEL analysis
- 4.4. Market Entropy
- 4.5. Patent/Trademark Analysis
- 5. Global Packaging Industry in South Africa Analysis, Insights and Forecast, 2019-2031
- 5.1. Market Analysis, Insights and Forecast - by Product Type
- 5.1.1. Bottles and Jars
- 5.1.2. Pouches
- 5.1.3. Bags
- 5.1.4. Films and Wraps
- 5.1.5. Other Product Types
- 5.2. Market Analysis, Insights and Forecast - by Type of Plastic
- 5.2.1. Rigid
- 5.2.2. Flexible
- 5.3. Market Analysis, Insights and Forecast - by Material
- 5.3.1. Polyethylene (PE)
- 5.3.2. Polypropylene (PP)
- 5.3.3. Polyvinyl Chloride (PVC)
- 5.3.4. Polyethylene Terephthalate (PET)
- 5.3.5. Other Materials
- 5.4. Market Analysis, Insights and Forecast - by End-user Industry
- 5.4.1. Food
- 5.4.2. Beverages
- 5.4.3. Healthcare and Pharmaceuticals
- 5.4.4. Personal and Home Care
- 5.4.5. Other End-user Industries
- 5.5. Market Analysis, Insights and Forecast - by Region
- 5.5.1. North America
- 5.5.2. South America
- 5.5.3. Europe
- 5.5.4. Middle East & Africa
- 5.5.5. Asia Pacific
- 5.1. Market Analysis, Insights and Forecast - by Product Type
- 6. North America Packaging Industry in South Africa Analysis, Insights and Forecast, 2019-2031
- 6.1. Market Analysis, Insights and Forecast - by Product Type
- 6.1.1. Bottles and Jars
- 6.1.2. Pouches
- 6.1.3. Bags
- 6.1.4. Films and Wraps
- 6.1.5. Other Product Types
- 6.2. Market Analysis, Insights and Forecast - by Type of Plastic
- 6.2.1. Rigid
- 6.2.2. Flexible
- 6.3. Market Analysis, Insights and Forecast - by Material
- 6.3.1. Polyethylene (PE)
- 6.3.2. Polypropylene (PP)
- 6.3.3. Polyvinyl Chloride (PVC)
- 6.3.4. Polyethylene Terephthalate (PET)
- 6.3.5. Other Materials
- 6.4. Market Analysis, Insights and Forecast - by End-user Industry
- 6.4.1. Food
- 6.4.2. Beverages
- 6.4.3. Healthcare and Pharmaceuticals
- 6.4.4. Personal and Home Care
- 6.4.5. Other End-user Industries
- 6.1. Market Analysis, Insights and Forecast - by Product Type
- 7. South America Packaging Industry in South Africa Analysis, Insights and Forecast, 2019-2031
- 7.1. Market Analysis, Insights and Forecast - by Product Type
- 7.1.1. Bottles and Jars
- 7.1.2. Pouches
- 7.1.3. Bags
- 7.1.4. Films and Wraps
- 7.1.5. Other Product Types
- 7.2. Market Analysis, Insights and Forecast - by Type of Plastic
- 7.2.1. Rigid
- 7.2.2. Flexible
- 7.3. Market Analysis, Insights and Forecast - by Material
- 7.3.1. Polyethylene (PE)
- 7.3.2. Polypropylene (PP)
- 7.3.3. Polyvinyl Chloride (PVC)
- 7.3.4. Polyethylene Terephthalate (PET)
- 7.3.5. Other Materials
- 7.4. Market Analysis, Insights and Forecast - by End-user Industry
- 7.4.1. Food
- 7.4.2. Beverages
- 7.4.3. Healthcare and Pharmaceuticals
- 7.4.4. Personal and Home Care
- 7.4.5. Other End-user Industries
- 7.1. Market Analysis, Insights and Forecast - by Product Type
- 8. Europe Packaging Industry in South Africa Analysis, Insights and Forecast, 2019-2031
- 8.1. Market Analysis, Insights and Forecast - by Product Type
- 8.1.1. Bottles and Jars
- 8.1.2. Pouches
- 8.1.3. Bags
- 8.1.4. Films and Wraps
- 8.1.5. Other Product Types
- 8.2. Market Analysis, Insights and Forecast - by Type of Plastic
- 8.2.1. Rigid
- 8.2.2. Flexible
- 8.3. Market Analysis, Insights and Forecast - by Material
- 8.3.1. Polyethylene (PE)
- 8.3.2. Polypropylene (PP)
- 8.3.3. Polyvinyl Chloride (PVC)
- 8.3.4. Polyethylene Terephthalate (PET)
- 8.3.5. Other Materials
- 8.4. Market Analysis, Insights and Forecast - by End-user Industry
- 8.4.1. Food
- 8.4.2. Beverages
- 8.4.3. Healthcare and Pharmaceuticals
- 8.4.4. Personal and Home Care
- 8.4.5. Other End-user Industries
- 8.1. Market Analysis, Insights and Forecast - by Product Type
- 9. Middle East & Africa Packaging Industry in South Africa Analysis, Insights and Forecast, 2019-2031
- 9.1. Market Analysis, Insights and Forecast - by Product Type
- 9.1.1. Bottles and Jars
- 9.1.2. Pouches
- 9.1.3. Bags
- 9.1.4. Films and Wraps
- 9.1.5. Other Product Types
- 9.2. Market Analysis, Insights and Forecast - by Type of Plastic
- 9.2.1. Rigid
- 9.2.2. Flexible
- 9.3. Market Analysis, Insights and Forecast - by Material
- 9.3.1. Polyethylene (PE)
- 9.3.2. Polypropylene (PP)
- 9.3.3. Polyvinyl Chloride (PVC)
- 9.3.4. Polyethylene Terephthalate (PET)
- 9.3.5. Other Materials
- 9.4. Market Analysis, Insights and Forecast - by End-user Industry
- 9.4.1. Food
- 9.4.2. Beverages
- 9.4.3. Healthcare and Pharmaceuticals
- 9.4.4. Personal and Home Care
- 9.4.5. Other End-user Industries
- 9.1. Market Analysis, Insights and Forecast - by Product Type
- 10. Asia Pacific Packaging Industry in South Africa Analysis, Insights and Forecast, 2019-2031
- 10.1. Market Analysis, Insights and Forecast - by Product Type
- 10.1.1. Bottles and Jars
- 10.1.2. Pouches
- 10.1.3. Bags
- 10.1.4. Films and Wraps
- 10.1.5. Other Product Types
- 10.2. Market Analysis, Insights and Forecast - by Type of Plastic
- 10.2.1. Rigid
- 10.2.2. Flexible
- 10.3. Market Analysis, Insights and Forecast - by Material
- 10.3.1. Polyethylene (PE)
- 10.3.2. Polypropylene (PP)
- 10.3.3. Polyvinyl Chloride (PVC)
- 10.3.4. Polyethylene Terephthalate (PET)
- 10.3.5. Other Materials
- 10.4. Market Analysis, Insights and Forecast - by End-user Industry
- 10.4.1. Food
- 10.4.2. Beverages
- 10.4.3. Healthcare and Pharmaceuticals
- 10.4.4. Personal and Home Care
- 10.4.5. Other End-user Industries
- 10.1. Market Analysis, Insights and Forecast - by Product Type
- 11. South Africa Packaging Industry in South Africa Analysis, Insights and Forecast, 2019-2031
- 12. Sudan Packaging Industry in South Africa Analysis, Insights and Forecast, 2019-2031
- 13. Uganda Packaging Industry in South Africa Analysis, Insights and Forecast, 2019-2031
- 14. Tanzania Packaging Industry in South Africa Analysis, Insights and Forecast, 2019-2031
- 15. Kenya Packaging Industry in South Africa Analysis, Insights and Forecast, 2019-2031
- 16. Rest of Africa Packaging Industry in South Africa Analysis, Insights and Forecast, 2019-2031
- 17. Competitive Analysis
- 17.1. Global Market Share Analysis 2024
- 17.2. Company Profiles
- 17.2.1 Italpac (Pty) Ltd
- 17.2.1.1. Overview
- 17.2.1.2. Products
- 17.2.1.3. SWOT Analysis
- 17.2.1.4. Recent Developments
- 17.2.1.5. Financials (Based on Availability)
- 17.2.2 RPC Astrapak Ltd
- 17.2.2.1. Overview
- 17.2.2.2. Products
- 17.2.2.3. SWOT Analysis
- 17.2.2.4. Recent Developments
- 17.2.2.5. Financials (Based on Availability)
- 17.2.3 Nampak Ltd
- 17.2.3.1. Overview
- 17.2.3.2. Products
- 17.2.3.3. SWOT Analysis
- 17.2.3.4. Recent Developments
- 17.2.3.5. Financials (Based on Availability)
- 17.2.4 Nioro Plastics (Pty) Ltd*List Not Exhaustive
- 17.2.4.1. Overview
- 17.2.4.2. Products
- 17.2.4.3. SWOT Analysis
- 17.2.4.4. Recent Developments
- 17.2.4.5. Financials (Based on Availability)
- 17.2.5 Tetra Pak Ltd
- 17.2.5.1. Overview
- 17.2.5.2. Products
- 17.2.5.3. SWOT Analysis
- 17.2.5.4. Recent Developments
- 17.2.5.5. Financials (Based on Availability)
- 17.2.6 Mondi PLC
- 17.2.6.1. Overview
- 17.2.6.2. Products
- 17.2.6.3. SWOT Analysis
- 17.2.6.4. Recent Developments
- 17.2.6.5. Financials (Based on Availability)
- 17.2.7 Mpact Ltd
- 17.2.7.1. Overview
- 17.2.7.2. Products
- 17.2.7.3. SWOT Analysis
- 17.2.7.4. Recent Developments
- 17.2.7.5. Financials (Based on Availability)
- 17.2.8 Amcor Limited
- 17.2.8.1. Overview
- 17.2.8.2. Products
- 17.2.8.3. SWOT Analysis
- 17.2.8.4. Recent Developments
- 17.2.8.5. Financials (Based on Availability)
- 17.2.9 Sealed Air Corporation
- 17.2.9.1. Overview
- 17.2.9.2. Products
- 17.2.9.3. SWOT Analysis
- 17.2.9.4. Recent Developments
- 17.2.9.5. Financials (Based on Availability)
- 17.2.10 Constantia Flexibles Corporation
- 17.2.10.1. Overview
- 17.2.10.2. Products
- 17.2.10.3. SWOT Analysis
- 17.2.10.4. Recent Developments
- 17.2.10.5. Financials (Based on Availability)
- 17.2.1 Italpac (Pty) Ltd
List of Figures
- Figure 1: Global Packaging Industry in South Africa Revenue Breakdown (Million, %) by Region 2024 & 2032
- Figure 2: Africa Packaging Industry in South Africa Revenue (Million), by Country 2024 & 2032
- Figure 3: Africa Packaging Industry in South Africa Revenue Share (%), by Country 2024 & 2032
- Figure 4: North America Packaging Industry in South Africa Revenue (Million), by Product Type 2024 & 2032
- Figure 5: North America Packaging Industry in South Africa Revenue Share (%), by Product Type 2024 & 2032
- Figure 6: North America Packaging Industry in South Africa Revenue (Million), by Type of Plastic 2024 & 2032
- Figure 7: North America Packaging Industry in South Africa Revenue Share (%), by Type of Plastic 2024 & 2032
- Figure 8: North America Packaging Industry in South Africa Revenue (Million), by Material 2024 & 2032
- Figure 9: North America Packaging Industry in South Africa Revenue Share (%), by Material 2024 & 2032
- Figure 10: North America Packaging Industry in South Africa Revenue (Million), by End-user Industry 2024 & 2032
- Figure 11: North America Packaging Industry in South Africa Revenue Share (%), by End-user Industry 2024 & 2032
- Figure 12: North America Packaging Industry in South Africa Revenue (Million), by Country 2024 & 2032
- Figure 13: North America Packaging Industry in South Africa Revenue Share (%), by Country 2024 & 2032
- Figure 14: South America Packaging Industry in South Africa Revenue (Million), by Product Type 2024 & 2032
- Figure 15: South America Packaging Industry in South Africa Revenue Share (%), by Product Type 2024 & 2032
- Figure 16: South America Packaging Industry in South Africa Revenue (Million), by Type of Plastic 2024 & 2032
- Figure 17: South America Packaging Industry in South Africa Revenue Share (%), by Type of Plastic 2024 & 2032
- Figure 18: South America Packaging Industry in South Africa Revenue (Million), by Material 2024 & 2032
- Figure 19: South America Packaging Industry in South Africa Revenue Share (%), by Material 2024 & 2032
- Figure 20: South America Packaging Industry in South Africa Revenue (Million), by End-user Industry 2024 & 2032
- Figure 21: South America Packaging Industry in South Africa Revenue Share (%), by End-user Industry 2024 & 2032
- Figure 22: South America Packaging Industry in South Africa Revenue (Million), by Country 2024 & 2032
- Figure 23: South America Packaging Industry in South Africa Revenue Share (%), by Country 2024 & 2032
- Figure 24: Europe Packaging Industry in South Africa Revenue (Million), by Product Type 2024 & 2032
- Figure 25: Europe Packaging Industry in South Africa Revenue Share (%), by Product Type 2024 & 2032
- Figure 26: Europe Packaging Industry in South Africa Revenue (Million), by Type of Plastic 2024 & 2032
- Figure 27: Europe Packaging Industry in South Africa Revenue Share (%), by Type of Plastic 2024 & 2032
- Figure 28: Europe Packaging Industry in South Africa Revenue (Million), by Material 2024 & 2032
- Figure 29: Europe Packaging Industry in South Africa Revenue Share (%), by Material 2024 & 2032
- Figure 30: Europe Packaging Industry in South Africa Revenue (Million), by End-user Industry 2024 & 2032
- Figure 31: Europe Packaging Industry in South Africa Revenue Share (%), by End-user Industry 2024 & 2032
- Figure 32: Europe Packaging Industry in South Africa Revenue (Million), by Country 2024 & 2032
- Figure 33: Europe Packaging Industry in South Africa Revenue Share (%), by Country 2024 & 2032
- Figure 34: Middle East & Africa Packaging Industry in South Africa Revenue (Million), by Product Type 2024 & 2032
- Figure 35: Middle East & Africa Packaging Industry in South Africa Revenue Share (%), by Product Type 2024 & 2032
- Figure 36: Middle East & Africa Packaging Industry in South Africa Revenue (Million), by Type of Plastic 2024 & 2032
- Figure 37: Middle East & Africa Packaging Industry in South Africa Revenue Share (%), by Type of Plastic 2024 & 2032
- Figure 38: Middle East & Africa Packaging Industry in South Africa Revenue (Million), by Material 2024 & 2032
- Figure 39: Middle East & Africa Packaging Industry in South Africa Revenue Share (%), by Material 2024 & 2032
- Figure 40: Middle East & Africa Packaging Industry in South Africa Revenue (Million), by End-user Industry 2024 & 2032
- Figure 41: Middle East & Africa Packaging Industry in South Africa Revenue Share (%), by End-user Industry 2024 & 2032
- Figure 42: Middle East & Africa Packaging Industry in South Africa Revenue (Million), by Country 2024 & 2032
- Figure 43: Middle East & Africa Packaging Industry in South Africa Revenue Share (%), by Country 2024 & 2032
- Figure 44: Asia Pacific Packaging Industry in South Africa Revenue (Million), by Product Type 2024 & 2032
- Figure 45: Asia Pacific Packaging Industry in South Africa Revenue Share (%), by Product Type 2024 & 2032
- Figure 46: Asia Pacific Packaging Industry in South Africa Revenue (Million), by Type of Plastic 2024 & 2032
- Figure 47: Asia Pacific Packaging Industry in South Africa Revenue Share (%), by Type of Plastic 2024 & 2032
- Figure 48: Asia Pacific Packaging Industry in South Africa Revenue (Million), by Material 2024 & 2032
- Figure 49: Asia Pacific Packaging Industry in South Africa Revenue Share (%), by Material 2024 & 2032
- Figure 50: Asia Pacific Packaging Industry in South Africa Revenue (Million), by End-user Industry 2024 & 2032
- Figure 51: Asia Pacific Packaging Industry in South Africa Revenue Share (%), by End-user Industry 2024 & 2032
- Figure 52: Asia Pacific Packaging Industry in South Africa Revenue (Million), by Country 2024 & 2032
- Figure 53: Asia Pacific Packaging Industry in South Africa Revenue Share (%), by Country 2024 & 2032
List of Tables
- Table 1: Global Packaging Industry in South Africa Revenue Million Forecast, by Region 2019 & 2032
- Table 2: Global Packaging Industry in South Africa Revenue Million Forecast, by Product Type 2019 & 2032
- Table 3: Global Packaging Industry in South Africa Revenue Million Forecast, by Type of Plastic 2019 & 2032
- Table 4: Global Packaging Industry in South Africa Revenue Million Forecast, by Material 2019 & 2032
- Table 5: Global Packaging Industry in South Africa Revenue Million Forecast, by End-user Industry 2019 & 2032
- Table 6: Global Packaging Industry in South Africa Revenue Million Forecast, by Region 2019 & 2032
- Table 7: Global Packaging Industry in South Africa Revenue Million Forecast, by Country 2019 & 2032
- Table 8: South Africa Packaging Industry in South Africa Revenue (Million) Forecast, by Application 2019 & 2032
- Table 9: Sudan Packaging Industry in South Africa Revenue (Million) Forecast, by Application 2019 & 2032
- Table 10: Uganda Packaging Industry in South Africa Revenue (Million) Forecast, by Application 2019 & 2032
- Table 11: Tanzania Packaging Industry in South Africa Revenue (Million) Forecast, by Application 2019 & 2032
- Table 12: Kenya Packaging Industry in South Africa Revenue (Million) Forecast, by Application 2019 & 2032
- Table 13: Rest of Africa Packaging Industry in South Africa Revenue (Million) Forecast, by Application 2019 & 2032
- Table 14: Global Packaging Industry in South Africa Revenue Million Forecast, by Product Type 2019 & 2032
- Table 15: Global Packaging Industry in South Africa Revenue Million Forecast, by Type of Plastic 2019 & 2032
- Table 16: Global Packaging Industry in South Africa Revenue Million Forecast, by Material 2019 & 2032
- Table 17: Global Packaging Industry in South Africa Revenue Million Forecast, by End-user Industry 2019 & 2032
- Table 18: Global Packaging Industry in South Africa Revenue Million Forecast, by Country 2019 & 2032
- Table 19: United States Packaging Industry in South Africa Revenue (Million) Forecast, by Application 2019 & 2032
- Table 20: Canada Packaging Industry in South Africa Revenue (Million) Forecast, by Application 2019 & 2032
- Table 21: Mexico Packaging Industry in South Africa Revenue (Million) Forecast, by Application 2019 & 2032
- Table 22: Global Packaging Industry in South Africa Revenue Million Forecast, by Product Type 2019 & 2032
- Table 23: Global Packaging Industry in South Africa Revenue Million Forecast, by Type of Plastic 2019 & 2032
- Table 24: Global Packaging Industry in South Africa Revenue Million Forecast, by Material 2019 & 2032
- Table 25: Global Packaging Industry in South Africa Revenue Million Forecast, by End-user Industry 2019 & 2032
- Table 26: Global Packaging Industry in South Africa Revenue Million Forecast, by Country 2019 & 2032
- Table 27: Brazil Packaging Industry in South Africa Revenue (Million) Forecast, by Application 2019 & 2032
- Table 28: Argentina Packaging Industry in South Africa Revenue (Million) Forecast, by Application 2019 & 2032
- Table 29: Rest of South America Packaging Industry in South Africa Revenue (Million) Forecast, by Application 2019 & 2032
- Table 30: Global Packaging Industry in South Africa Revenue Million Forecast, by Product Type 2019 & 2032
- Table 31: Global Packaging Industry in South Africa Revenue Million Forecast, by Type of Plastic 2019 & 2032
- Table 32: Global Packaging Industry in South Africa Revenue Million Forecast, by Material 2019 & 2032
- Table 33: Global Packaging Industry in South Africa Revenue Million Forecast, by End-user Industry 2019 & 2032
- Table 34: Global Packaging Industry in South Africa Revenue Million Forecast, by Country 2019 & 2032
- Table 35: United Kingdom Packaging Industry in South Africa Revenue (Million) Forecast, by Application 2019 & 2032
- Table 36: Germany Packaging Industry in South Africa Revenue (Million) Forecast, by Application 2019 & 2032
- Table 37: France Packaging Industry in South Africa Revenue (Million) Forecast, by Application 2019 & 2032
- Table 38: Italy Packaging Industry in South Africa Revenue (Million) Forecast, by Application 2019 & 2032
- Table 39: Spain Packaging Industry in South Africa Revenue (Million) Forecast, by Application 2019 & 2032
- Table 40: Russia Packaging Industry in South Africa Revenue (Million) Forecast, by Application 2019 & 2032
- Table 41: Benelux Packaging Industry in South Africa Revenue (Million) Forecast, by Application 2019 & 2032
- Table 42: Nordics Packaging Industry in South Africa Revenue (Million) Forecast, by Application 2019 & 2032
- Table 43: Rest of Europe Packaging Industry in South Africa Revenue (Million) Forecast, by Application 2019 & 2032
- Table 44: Global Packaging Industry in South Africa Revenue Million Forecast, by Product Type 2019 & 2032
- Table 45: Global Packaging Industry in South Africa Revenue Million Forecast, by Type of Plastic 2019 & 2032
- Table 46: Global Packaging Industry in South Africa Revenue Million Forecast, by Material 2019 & 2032
- Table 47: Global Packaging Industry in South Africa Revenue Million Forecast, by End-user Industry 2019 & 2032
- Table 48: Global Packaging Industry in South Africa Revenue Million Forecast, by Country 2019 & 2032
- Table 49: Turkey Packaging Industry in South Africa Revenue (Million) Forecast, by Application 2019 & 2032
- Table 50: Israel Packaging Industry in South Africa Revenue (Million) Forecast, by Application 2019 & 2032
- Table 51: GCC Packaging Industry in South Africa Revenue (Million) Forecast, by Application 2019 & 2032
- Table 52: North Africa Packaging Industry in South Africa Revenue (Million) Forecast, by Application 2019 & 2032
- Table 53: South Africa Packaging Industry in South Africa Revenue (Million) Forecast, by Application 2019 & 2032
- Table 54: Rest of Middle East & Africa Packaging Industry in South Africa Revenue (Million) Forecast, by Application 2019 & 2032
- Table 55: Global Packaging Industry in South Africa Revenue Million Forecast, by Product Type 2019 & 2032
- Table 56: Global Packaging Industry in South Africa Revenue Million Forecast, by Type of Plastic 2019 & 2032
- Table 57: Global Packaging Industry in South Africa Revenue Million Forecast, by Material 2019 & 2032
- Table 58: Global Packaging Industry in South Africa Revenue Million Forecast, by End-user Industry 2019 & 2032
- Table 59: Global Packaging Industry in South Africa Revenue Million Forecast, by Country 2019 & 2032
- Table 60: China Packaging Industry in South Africa Revenue (Million) Forecast, by Application 2019 & 2032
- Table 61: India Packaging Industry in South Africa Revenue (Million) Forecast, by Application 2019 & 2032
- Table 62: Japan Packaging Industry in South Africa Revenue (Million) Forecast, by Application 2019 & 2032
- Table 63: South Korea Packaging Industry in South Africa Revenue (Million) Forecast, by Application 2019 & 2032
- Table 64: ASEAN Packaging Industry in South Africa Revenue (Million) Forecast, by Application 2019 & 2032
- Table 65: Oceania Packaging Industry in South Africa Revenue (Million) Forecast, by Application 2019 & 2032
- Table 66: Rest of Asia Pacific Packaging Industry in South Africa Revenue (Million) Forecast, by Application 2019 & 2032
Frequently Asked Questions
1. What is the projected Compound Annual Growth Rate (CAGR) of the Packaging Industry in South Africa?
The projected CAGR is approximately 2.89%.
2. Which companies are prominent players in the Packaging Industry in South Africa?
Key companies in the market include Italpac (Pty) Ltd, RPC Astrapak Ltd, Nampak Ltd, Nioro Plastics (Pty) Ltd*List Not Exhaustive, Tetra Pak Ltd, Mondi PLC, Mpact Ltd, Amcor Limited, Sealed Air Corporation, Constantia Flexibles Corporation.
3. What are the main segments of the Packaging Industry in South Africa?
The market segments include Product Type, Type of Plastic, Material, End-user Industry.
4. Can you provide details about the market size?
The market size is estimated to be USD 2.59 Million as of 2022.
5. What are some drivers contributing to market growth?
Growing Demand for Consumer Goods; Favorable Packaging Properties Possessed by Plastic.
6. What are the notable trends driving market growth?
Aggressive Recycling Rates of Plastic Products within the Country and an increase in Waste Generation.
7. Are there any restraints impacting market growth?
Fluctuating Raw Material Prices.
8. Can you provide examples of recent developments in the market?
May 2021 - The country released a new regulation that requires any company or brand that makes or imports any form of plastic packaging for distribution in South Africa to pay an extended producer responsibility (EPR) fee per tonne from 5 May 2021. Strict government targets have been set for annual collection and recycling over the next five years, and the EPR is positioned to invest in collection infrastructure in the country. Existing producers are expected to register with the Department of Environment, Forestry, and Fisheries by November 2021.
9. What pricing options are available for accessing the report?
Pricing options include single-user, multi-user, and enterprise licenses priced at USD 3800, USD 4500, and USD 5800 respectively.
10. Is the market size provided in terms of value or volume?
The market size is provided in terms of value, measured in Million.
11. Are there any specific market keywords associated with the report?
Yes, the market keyword associated with the report is "Packaging Industry in South Africa," which aids in identifying and referencing the specific market segment covered.
12. How do I determine which pricing option suits my needs best?
The pricing options vary based on user requirements and access needs. Individual users may opt for single-user licenses, while businesses requiring broader access may choose multi-user or enterprise licenses for cost-effective access to the report.
13. Are there any additional resources or data provided in the Packaging Industry in South Africa report?
While the report offers comprehensive insights, it's advisable to review the specific contents or supplementary materials provided to ascertain if additional resources or data are available.
14. How can I stay updated on further developments or reports in the Packaging Industry in South Africa?
To stay informed about further developments, trends, and reports in the Packaging Industry in South Africa, consider subscribing to industry newsletters, following relevant companies and organizations, or regularly checking reputable industry news sources and publications.
Methodology
Step 1 - Identification of Relevant Samples Size from Population Database


Step 2 - Approaches for Defining Global Market Size (Value, Volume* & Price*)

Note*: In applicable scenarios
Step 3 - Data Sources
Primary Research
- Web Analytics
- Survey Reports
- Research Institute
- Latest Research Reports
- Opinion Leaders
Secondary Research
- Annual Reports
- White Paper
- Latest Press Release
- Industry Association
- Paid Database
- Investor Presentations

Step 4 - Data Triangulation
Involves using different sources of information in order to increase the validity of a study
These sources are likely to be stakeholders in a program - participants, other researchers, program staff, other community members, and so on.
Then we put all data in single framework & apply various statistical tools to find out the dynamic on the market.
During the analysis stage, feedback from the stakeholder groups would be compared to determine areas of agreement as well as areas of divergence


