

Key Insights
The PAM4 DSP market is experiencing robust growth, driven by the increasing demand for higher bandwidth and data rates in high-speed networking applications. The market's expansion is fueled by the proliferation of 5G networks, data centers requiring greater capacity, and the rise of cloud computing, all of which necessitate faster and more efficient data transmission. Key players like Marvell, Broadcom, MaxLinear, MACOM, and Credo are actively investing in research and development, leading to continuous technological advancements in PAM4 DSP technology. This innovation translates to improved signal processing, reduced power consumption, and enhanced signal integrity, ultimately enabling higher data rates and improved network performance. The market is segmented based on factors like data rate capabilities, application (e.g., data centers, 5G infrastructure), and geographical location. We project a significant increase in market value in the coming years, driven by continued adoption across diverse sectors.
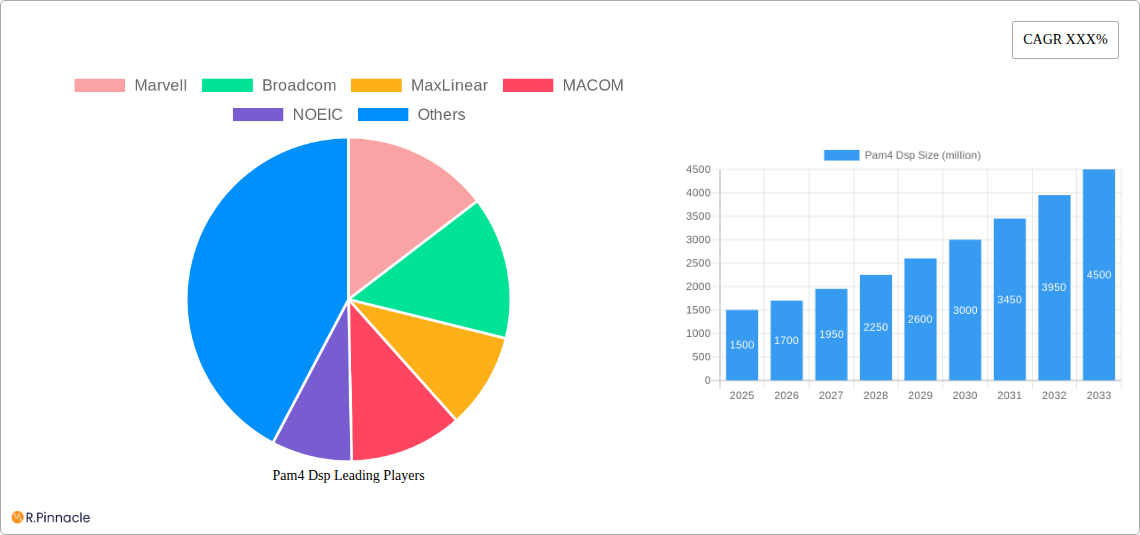
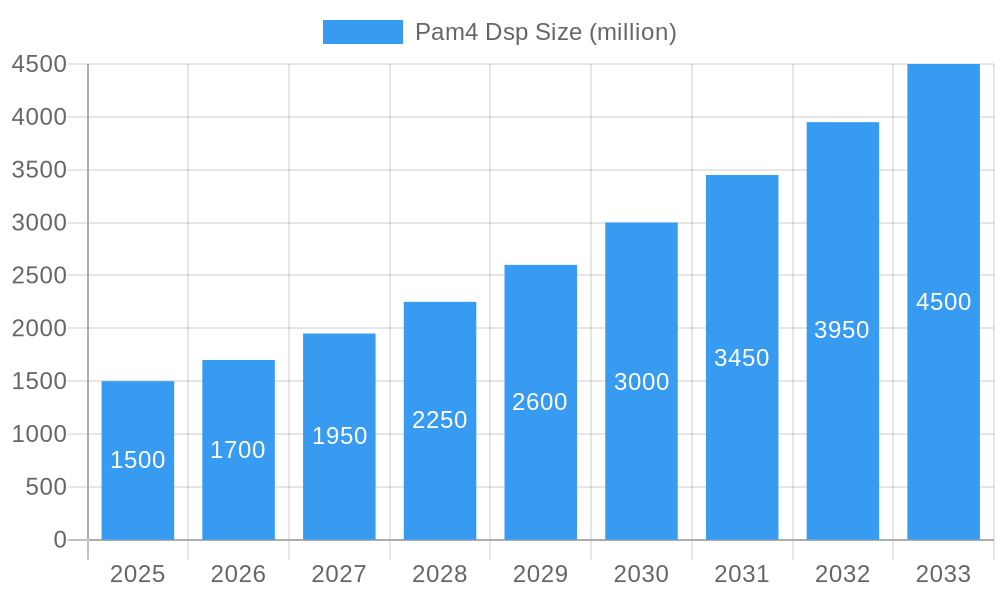
Pam4 Dsp Market Size (In Billion)
The market's growth, however, is not without its challenges. High initial investment costs associated with implementing PAM4 technology can act as a restraint, particularly for smaller companies. Furthermore, the complexity of PAM4 DSP design and integration can present significant hurdles for some network operators. Despite these limitations, the long-term prospects for the PAM4 DSP market remain positive, with a consistent Compound Annual Growth Rate (CAGR) anticipated through 2033. This sustained growth will be further bolstered by ongoing advancements in chip technology, the development of more efficient and cost-effective solutions, and the continued expansion of high-bandwidth applications. The market is expected to consolidate slightly over the forecast period, with larger players strengthening their market positions through strategic acquisitions and partnerships.
Pam4 Dsp Company Market Share
This comprehensive report provides an in-depth analysis of the Pam4 DSP market, offering valuable insights for industry professionals, investors, and strategic decision-makers. The study period covers 2019-2033, with a base year of 2025 and a forecast period of 2025-2033. The report leverages extensive market research and data analysis to provide a clear picture of current market dynamics and future growth potential. The market size is projected to reach millions of dollars by 2033.
Pam4 DSP Market Structure & Innovation Trends
This section analyzes the competitive landscape, innovation drivers, and regulatory influences shaping the Pam4 DSP market. We examine market concentration, identifying key players and their respective market share. The analysis includes a review of mergers and acquisitions (M&A) activities, including estimated deal values in millions of dollars, impacting market dynamics. The report also explores the impact of regulatory frameworks and the presence of substitute products. Finally, end-user demographics and their influence on market demand are thoroughly investigated.
- Market Concentration: The market is moderately concentrated with key players holding xx% of the market share in 2024. This is expected to shift slightly by 2033.
- Innovation Drivers: Increased bandwidth demands and advancements in high-speed data transmission are key drivers of innovation in Pam4 DSP technology.
- M&A Activity: Significant M&A activity was observed during the historical period (2019-2024), with total deal values exceeding xx million. This activity is expected to continue during the forecast period.
- Regulatory Frameworks: Government regulations concerning data transmission standards and data security influence market growth. The impact of these regulations is analyzed within the report.
- Product Substitutes: The report explores alternative technologies and their potential impact on market share.
Pam4 DSP Market Dynamics & Trends
This section delves into the driving forces behind Pam4 DSP market growth, including technological advancements, evolving consumer preferences, and competitive pressures. The report examines the Compound Annual Growth Rate (CAGR) and market penetration rates for the forecast period (2025-2033). We analyze disruptive technologies that challenge established players and the resulting impact on market share distribution. We also investigate shifts in consumer preferences impacting demand for Pam4 DSP solutions. The competitive landscape and strategies employed by key players are explored in detail.
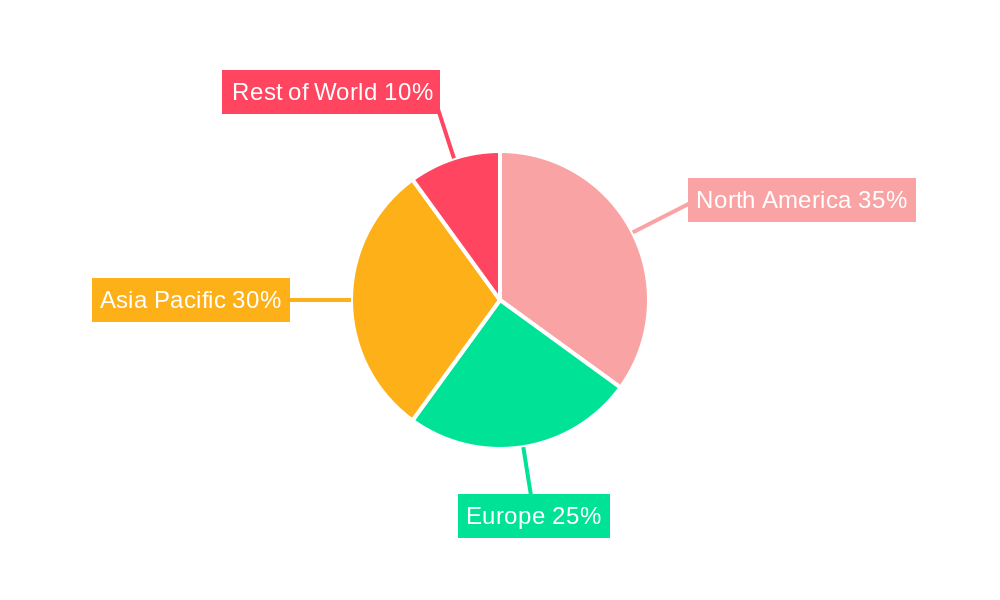
Dominant Regions & Segments in Pam4 DSP
This section identifies the leading geographical regions and market segments within the Pam4 DSP market. We provide a detailed analysis of the factors contributing to the dominance of specific regions and segments. The analysis utilizes both paragraph and bullet point formats to present clear and concise information.
- Leading Region: [Insert Leading Region, e.g., North America]
- Key Drivers: Strong demand from data centers, robust technological infrastructure, and favorable economic policies.
- Leading Segment: [Insert Leading Segment, e.g., High-Speed Data Communication]
- Key Drivers: Growing demand for higher bandwidths, increased adoption of 5G technology, and investments in data center infrastructure upgrades.
Pam4 DSP Product Innovations
This section summarizes the latest product developments, applications, and competitive advantages within the Pam4 DSP market. The focus is on technological trends and the market fit of new products. The report showcases the strategic importance of technological advancements and their role in shaping the future of the market.
Report Scope & Segmentation Analysis
This section details the market segmentation analysis, including growth projections, market sizes (in millions of dollars), and competitive dynamics for each segment. Each segment is analyzed individually.
- Segment 1: [Segment Description and Analysis]
- Segment 2: [Segment Description and Analysis]
- Segment 3: [Segment Description and Analysis]
Key Drivers of Pam4 DSP Growth
This section outlines the key factors driving the growth of the Pam4 DSP market. This includes technological advancements, economic factors, and regulatory changes impacting market expansion. Specific examples of growth drivers are provided.
Challenges in the Pam4 DSP Sector
This section identifies and analyzes the challenges hindering the growth of the Pam4 DSP market. The analysis includes the impact of regulatory hurdles, supply chain disruptions, and competitive pressures on market growth. Quantifiable impacts, where available, are presented.
Emerging Opportunities in Pam4 DSP
This section highlights the emerging opportunities for growth within the Pam4 DSP market. The analysis includes new markets, technological advancements, and shifts in consumer preferences that present potential for market expansion.
Key Developments in Pam4 DSP Industry
- [Date]: [Development Description and Impact]
- [Date]: [Development Description and Impact]
- [Date]: [Development Description and Impact]
Future Outlook for Pam4 DSP Market
This section summarizes the growth accelerators and future market potential for Pam4 DSP. The report highlights strategic opportunities for businesses operating within the market, including potential expansion and new product development strategies. The projected market size and growth trajectory are summarized.
Pam4 Dsp Segmentation
-
1. Application
- 1.1. Optical Transceivers
- 1.2. Cloud Networks
- 1.3. Data Center
- 1.4. Others
-
2. Type
- 2.1. 100G
- 2.2. 400G
- 2.3. 800G
- 2.4. Others
Pam4 Dsp Segmentation By Geography
-
1. North America
- 1.1. United States
- 1.2. Canada
- 1.3. Mexico
-
2. South America
- 2.1. Brazil
- 2.2. Argentina
- 2.3. Rest of South America
-
3. Europe
- 3.1. United Kingdom
- 3.2. Germany
- 3.3. France
- 3.4. Italy
- 3.5. Spain
- 3.6. Russia
- 3.7. Benelux
- 3.8. Nordics
- 3.9. Rest of Europe
-
4. Middle East & Africa
- 4.1. Turkey
- 4.2. Israel
- 4.3. GCC
- 4.4. North Africa
- 4.5. South Africa
- 4.6. Rest of Middle East & Africa
-
5. Asia Pacific
- 5.1. China
- 5.2. India
- 5.3. Japan
- 5.4. South Korea
- 5.5. ASEAN
- 5.6. Oceania
- 5.7. Rest of Asia Pacific
Pam4 Dsp Regional Market Share
Geographic Coverage of Pam4 Dsp
Pam4 Dsp REPORT HIGHLIGHTS
| Aspects | Details |
|---|---|
| Study Period | 2020-2034 |
| Base Year | 2025 |
| Estimated Year | 2026 |
| Forecast Period | 2026-2034 |
| Historical Period | 2020-2025 |
| Growth Rate | CAGR of XXX% from 2020-2034 |
| Segmentation |
|
Table of Contents
- 1. Introduction
- 1.1. Research Scope
- 1.2. Market Segmentation
- 1.3. Research Methodology
- 1.4. Definitions and Assumptions
- 2. Executive Summary
- 2.1. Introduction
- 3. Market Dynamics
- 3.1. Introduction
- 3.2. Market Drivers
- 3.3. Market Restrains
- 3.4. Market Trends
- 4. Market Factor Analysis
- 4.1. Porters Five Forces
- 4.2. Supply/Value Chain
- 4.3. PESTEL analysis
- 4.4. Market Entropy
- 4.5. Patent/Trademark Analysis
- 5. Global Pam4 Dsp Analysis, Insights and Forecast, 2020-2032
- 5.1. Market Analysis, Insights and Forecast - by Application
- 5.1.1. Optical Transceivers
- 5.1.2. Cloud Networks
- 5.1.3. Data Center
- 5.1.4. Others
- 5.2. Market Analysis, Insights and Forecast - by Type
- 5.2.1. 100G
- 5.2.2. 400G
- 5.2.3. 800G
- 5.2.4. Others
- 5.3. Market Analysis, Insights and Forecast - by Region
- 5.3.1. North America
- 5.3.2. South America
- 5.3.3. Europe
- 5.3.4. Middle East & Africa
- 5.3.5. Asia Pacific
- 5.1. Market Analysis, Insights and Forecast - by Application
- 6. North America Pam4 Dsp Analysis, Insights and Forecast, 2020-2032
- 6.1. Market Analysis, Insights and Forecast - by Application
- 6.1.1. Optical Transceivers
- 6.1.2. Cloud Networks
- 6.1.3. Data Center
- 6.1.4. Others
- 6.2. Market Analysis, Insights and Forecast - by Type
- 6.2.1. 100G
- 6.2.2. 400G
- 6.2.3. 800G
- 6.2.4. Others
- 6.1. Market Analysis, Insights and Forecast - by Application
- 7. South America Pam4 Dsp Analysis, Insights and Forecast, 2020-2032
- 7.1. Market Analysis, Insights and Forecast - by Application
- 7.1.1. Optical Transceivers
- 7.1.2. Cloud Networks
- 7.1.3. Data Center
- 7.1.4. Others
- 7.2. Market Analysis, Insights and Forecast - by Type
- 7.2.1. 100G
- 7.2.2. 400G
- 7.2.3. 800G
- 7.2.4. Others
- 7.1. Market Analysis, Insights and Forecast - by Application
- 8. Europe Pam4 Dsp Analysis, Insights and Forecast, 2020-2032
- 8.1. Market Analysis, Insights and Forecast - by Application
- 8.1.1. Optical Transceivers
- 8.1.2. Cloud Networks
- 8.1.3. Data Center
- 8.1.4. Others
- 8.2. Market Analysis, Insights and Forecast - by Type
- 8.2.1. 100G
- 8.2.2. 400G
- 8.2.3. 800G
- 8.2.4. Others
- 8.1. Market Analysis, Insights and Forecast - by Application
- 9. Middle East & Africa Pam4 Dsp Analysis, Insights and Forecast, 2020-2032
- 9.1. Market Analysis, Insights and Forecast - by Application
- 9.1.1. Optical Transceivers
- 9.1.2. Cloud Networks
- 9.1.3. Data Center
- 9.1.4. Others
- 9.2. Market Analysis, Insights and Forecast - by Type
- 9.2.1. 100G
- 9.2.2. 400G
- 9.2.3. 800G
- 9.2.4. Others
- 9.1. Market Analysis, Insights and Forecast - by Application
- 10. Asia Pacific Pam4 Dsp Analysis, Insights and Forecast, 2020-2032
- 10.1. Market Analysis, Insights and Forecast - by Application
- 10.1.1. Optical Transceivers
- 10.1.2. Cloud Networks
- 10.1.3. Data Center
- 10.1.4. Others
- 10.2. Market Analysis, Insights and Forecast - by Type
- 10.2.1. 100G
- 10.2.2. 400G
- 10.2.3. 800G
- 10.2.4. Others
- 10.1. Market Analysis, Insights and Forecast - by Application
- 11. Competitive Analysis
- 11.1. Global Market Share Analysis 2025
- 11.2. Company Profiles
- 11.2.1 Marvell
- 11.2.1.1. Overview
- 11.2.1.2. Products
- 11.2.1.3. SWOT Analysis
- 11.2.1.4. Recent Developments
- 11.2.1.5. Financials (Based on Availability)
- 11.2.2 Broadcom
- 11.2.2.1. Overview
- 11.2.2.2. Products
- 11.2.2.3. SWOT Analysis
- 11.2.2.4. Recent Developments
- 11.2.2.5. Financials (Based on Availability)
- 11.2.3 MaxLinear
- 11.2.3.1. Overview
- 11.2.3.2. Products
- 11.2.3.3. SWOT Analysis
- 11.2.3.4. Recent Developments
- 11.2.3.5. Financials (Based on Availability)
- 11.2.4 MACOM
- 11.2.4.1. Overview
- 11.2.4.2. Products
- 11.2.4.3. SWOT Analysis
- 11.2.4.4. Recent Developments
- 11.2.4.5. Financials (Based on Availability)
- 11.2.5 NOEIC
- 11.2.5.1. Overview
- 11.2.5.2. Products
- 11.2.5.3. SWOT Analysis
- 11.2.5.4. Recent Developments
- 11.2.5.5. Financials (Based on Availability)
- 11.2.6 Credo
- 11.2.6.1. Overview
- 11.2.6.2. Products
- 11.2.6.3. SWOT Analysis
- 11.2.6.4. Recent Developments
- 11.2.6.5. Financials (Based on Availability)
- 11.2.1 Marvell
List of Figures
- Figure 1: Global Pam4 Dsp Revenue Breakdown (million, %) by Region 2025 & 2033
- Figure 2: Global Pam4 Dsp Volume Breakdown (K, %) by Region 2025 & 2033
- Figure 3: North America Pam4 Dsp Revenue (million), by Application 2025 & 2033
- Figure 4: North America Pam4 Dsp Volume (K), by Application 2025 & 2033
- Figure 5: North America Pam4 Dsp Revenue Share (%), by Application 2025 & 2033
- Figure 6: North America Pam4 Dsp Volume Share (%), by Application 2025 & 2033
- Figure 7: North America Pam4 Dsp Revenue (million), by Type 2025 & 2033
- Figure 8: North America Pam4 Dsp Volume (K), by Type 2025 & 2033
- Figure 9: North America Pam4 Dsp Revenue Share (%), by Type 2025 & 2033
- Figure 10: North America Pam4 Dsp Volume Share (%), by Type 2025 & 2033
- Figure 11: North America Pam4 Dsp Revenue (million), by Country 2025 & 2033
- Figure 12: North America Pam4 Dsp Volume (K), by Country 2025 & 2033
- Figure 13: North America Pam4 Dsp Revenue Share (%), by Country 2025 & 2033
- Figure 14: North America Pam4 Dsp Volume Share (%), by Country 2025 & 2033
- Figure 15: South America Pam4 Dsp Revenue (million), by Application 2025 & 2033
- Figure 16: South America Pam4 Dsp Volume (K), by Application 2025 & 2033
- Figure 17: South America Pam4 Dsp Revenue Share (%), by Application 2025 & 2033
- Figure 18: South America Pam4 Dsp Volume Share (%), by Application 2025 & 2033
- Figure 19: South America Pam4 Dsp Revenue (million), by Type 2025 & 2033
- Figure 20: South America Pam4 Dsp Volume (K), by Type 2025 & 2033
- Figure 21: South America Pam4 Dsp Revenue Share (%), by Type 2025 & 2033
- Figure 22: South America Pam4 Dsp Volume Share (%), by Type 2025 & 2033
- Figure 23: South America Pam4 Dsp Revenue (million), by Country 2025 & 2033
- Figure 24: South America Pam4 Dsp Volume (K), by Country 2025 & 2033
- Figure 25: South America Pam4 Dsp Revenue Share (%), by Country 2025 & 2033
- Figure 26: South America Pam4 Dsp Volume Share (%), by Country 2025 & 2033
- Figure 27: Europe Pam4 Dsp Revenue (million), by Application 2025 & 2033
- Figure 28: Europe Pam4 Dsp Volume (K), by Application 2025 & 2033
- Figure 29: Europe Pam4 Dsp Revenue Share (%), by Application 2025 & 2033
- Figure 30: Europe Pam4 Dsp Volume Share (%), by Application 2025 & 2033
- Figure 31: Europe Pam4 Dsp Revenue (million), by Type 2025 & 2033
- Figure 32: Europe Pam4 Dsp Volume (K), by Type 2025 & 2033
- Figure 33: Europe Pam4 Dsp Revenue Share (%), by Type 2025 & 2033
- Figure 34: Europe Pam4 Dsp Volume Share (%), by Type 2025 & 2033
- Figure 35: Europe Pam4 Dsp Revenue (million), by Country 2025 & 2033
- Figure 36: Europe Pam4 Dsp Volume (K), by Country 2025 & 2033
- Figure 37: Europe Pam4 Dsp Revenue Share (%), by Country 2025 & 2033
- Figure 38: Europe Pam4 Dsp Volume Share (%), by Country 2025 & 2033
- Figure 39: Middle East & Africa Pam4 Dsp Revenue (million), by Application 2025 & 2033
- Figure 40: Middle East & Africa Pam4 Dsp Volume (K), by Application 2025 & 2033
- Figure 41: Middle East & Africa Pam4 Dsp Revenue Share (%), by Application 2025 & 2033
- Figure 42: Middle East & Africa Pam4 Dsp Volume Share (%), by Application 2025 & 2033
- Figure 43: Middle East & Africa Pam4 Dsp Revenue (million), by Type 2025 & 2033
- Figure 44: Middle East & Africa Pam4 Dsp Volume (K), by Type 2025 & 2033
- Figure 45: Middle East & Africa Pam4 Dsp Revenue Share (%), by Type 2025 & 2033
- Figure 46: Middle East & Africa Pam4 Dsp Volume Share (%), by Type 2025 & 2033
- Figure 47: Middle East & Africa Pam4 Dsp Revenue (million), by Country 2025 & 2033
- Figure 48: Middle East & Africa Pam4 Dsp Volume (K), by Country 2025 & 2033
- Figure 49: Middle East & Africa Pam4 Dsp Revenue Share (%), by Country 2025 & 2033
- Figure 50: Middle East & Africa Pam4 Dsp Volume Share (%), by Country 2025 & 2033
- Figure 51: Asia Pacific Pam4 Dsp Revenue (million), by Application 2025 & 2033
- Figure 52: Asia Pacific Pam4 Dsp Volume (K), by Application 2025 & 2033
- Figure 53: Asia Pacific Pam4 Dsp Revenue Share (%), by Application 2025 & 2033
- Figure 54: Asia Pacific Pam4 Dsp Volume Share (%), by Application 2025 & 2033
- Figure 55: Asia Pacific Pam4 Dsp Revenue (million), by Type 2025 & 2033
- Figure 56: Asia Pacific Pam4 Dsp Volume (K), by Type 2025 & 2033
- Figure 57: Asia Pacific Pam4 Dsp Revenue Share (%), by Type 2025 & 2033
- Figure 58: Asia Pacific Pam4 Dsp Volume Share (%), by Type 2025 & 2033
- Figure 59: Asia Pacific Pam4 Dsp Revenue (million), by Country 2025 & 2033
- Figure 60: Asia Pacific Pam4 Dsp Volume (K), by Country 2025 & 2033
- Figure 61: Asia Pacific Pam4 Dsp Revenue Share (%), by Country 2025 & 2033
- Figure 62: Asia Pacific Pam4 Dsp Volume Share (%), by Country 2025 & 2033
List of Tables
- Table 1: Global Pam4 Dsp Revenue million Forecast, by Application 2020 & 2033
- Table 2: Global Pam4 Dsp Volume K Forecast, by Application 2020 & 2033
- Table 3: Global Pam4 Dsp Revenue million Forecast, by Type 2020 & 2033
- Table 4: Global Pam4 Dsp Volume K Forecast, by Type 2020 & 2033
- Table 5: Global Pam4 Dsp Revenue million Forecast, by Region 2020 & 2033
- Table 6: Global Pam4 Dsp Volume K Forecast, by Region 2020 & 2033
- Table 7: Global Pam4 Dsp Revenue million Forecast, by Application 2020 & 2033
- Table 8: Global Pam4 Dsp Volume K Forecast, by Application 2020 & 2033
- Table 9: Global Pam4 Dsp Revenue million Forecast, by Type 2020 & 2033
- Table 10: Global Pam4 Dsp Volume K Forecast, by Type 2020 & 2033
- Table 11: Global Pam4 Dsp Revenue million Forecast, by Country 2020 & 2033
- Table 12: Global Pam4 Dsp Volume K Forecast, by Country 2020 & 2033
- Table 13: United States Pam4 Dsp Revenue (million) Forecast, by Application 2020 & 2033
- Table 14: United States Pam4 Dsp Volume (K) Forecast, by Application 2020 & 2033
- Table 15: Canada Pam4 Dsp Revenue (million) Forecast, by Application 2020 & 2033
- Table 16: Canada Pam4 Dsp Volume (K) Forecast, by Application 2020 & 2033
- Table 17: Mexico Pam4 Dsp Revenue (million) Forecast, by Application 2020 & 2033
- Table 18: Mexico Pam4 Dsp Volume (K) Forecast, by Application 2020 & 2033
- Table 19: Global Pam4 Dsp Revenue million Forecast, by Application 2020 & 2033
- Table 20: Global Pam4 Dsp Volume K Forecast, by Application 2020 & 2033
- Table 21: Global Pam4 Dsp Revenue million Forecast, by Type 2020 & 2033
- Table 22: Global Pam4 Dsp Volume K Forecast, by Type 2020 & 2033
- Table 23: Global Pam4 Dsp Revenue million Forecast, by Country 2020 & 2033
- Table 24: Global Pam4 Dsp Volume K Forecast, by Country 2020 & 2033
- Table 25: Brazil Pam4 Dsp Revenue (million) Forecast, by Application 2020 & 2033
- Table 26: Brazil Pam4 Dsp Volume (K) Forecast, by Application 2020 & 2033
- Table 27: Argentina Pam4 Dsp Revenue (million) Forecast, by Application 2020 & 2033
- Table 28: Argentina Pam4 Dsp Volume (K) Forecast, by Application 2020 & 2033
- Table 29: Rest of South America Pam4 Dsp Revenue (million) Forecast, by Application 2020 & 2033
- Table 30: Rest of South America Pam4 Dsp Volume (K) Forecast, by Application 2020 & 2033
- Table 31: Global Pam4 Dsp Revenue million Forecast, by Application 2020 & 2033
- Table 32: Global Pam4 Dsp Volume K Forecast, by Application 2020 & 2033
- Table 33: Global Pam4 Dsp Revenue million Forecast, by Type 2020 & 2033
- Table 34: Global Pam4 Dsp Volume K Forecast, by Type 2020 & 2033
- Table 35: Global Pam4 Dsp Revenue million Forecast, by Country 2020 & 2033
- Table 36: Global Pam4 Dsp Volume K Forecast, by Country 2020 & 2033
- Table 37: United Kingdom Pam4 Dsp Revenue (million) Forecast, by Application 2020 & 2033
- Table 38: United Kingdom Pam4 Dsp Volume (K) Forecast, by Application 2020 & 2033
- Table 39: Germany Pam4 Dsp Revenue (million) Forecast, by Application 2020 & 2033
- Table 40: Germany Pam4 Dsp Volume (K) Forecast, by Application 2020 & 2033
- Table 41: France Pam4 Dsp Revenue (million) Forecast, by Application 2020 & 2033
- Table 42: France Pam4 Dsp Volume (K) Forecast, by Application 2020 & 2033
- Table 43: Italy Pam4 Dsp Revenue (million) Forecast, by Application 2020 & 2033
- Table 44: Italy Pam4 Dsp Volume (K) Forecast, by Application 2020 & 2033
- Table 45: Spain Pam4 Dsp Revenue (million) Forecast, by Application 2020 & 2033
- Table 46: Spain Pam4 Dsp Volume (K) Forecast, by Application 2020 & 2033
- Table 47: Russia Pam4 Dsp Revenue (million) Forecast, by Application 2020 & 2033
- Table 48: Russia Pam4 Dsp Volume (K) Forecast, by Application 2020 & 2033
- Table 49: Benelux Pam4 Dsp Revenue (million) Forecast, by Application 2020 & 2033
- Table 50: Benelux Pam4 Dsp Volume (K) Forecast, by Application 2020 & 2033
- Table 51: Nordics Pam4 Dsp Revenue (million) Forecast, by Application 2020 & 2033
- Table 52: Nordics Pam4 Dsp Volume (K) Forecast, by Application 2020 & 2033
- Table 53: Rest of Europe Pam4 Dsp Revenue (million) Forecast, by Application 2020 & 2033
- Table 54: Rest of Europe Pam4 Dsp Volume (K) Forecast, by Application 2020 & 2033
- Table 55: Global Pam4 Dsp Revenue million Forecast, by Application 2020 & 2033
- Table 56: Global Pam4 Dsp Volume K Forecast, by Application 2020 & 2033
- Table 57: Global Pam4 Dsp Revenue million Forecast, by Type 2020 & 2033
- Table 58: Global Pam4 Dsp Volume K Forecast, by Type 2020 & 2033
- Table 59: Global Pam4 Dsp Revenue million Forecast, by Country 2020 & 2033
- Table 60: Global Pam4 Dsp Volume K Forecast, by Country 2020 & 2033
- Table 61: Turkey Pam4 Dsp Revenue (million) Forecast, by Application 2020 & 2033
- Table 62: Turkey Pam4 Dsp Volume (K) Forecast, by Application 2020 & 2033
- Table 63: Israel Pam4 Dsp Revenue (million) Forecast, by Application 2020 & 2033
- Table 64: Israel Pam4 Dsp Volume (K) Forecast, by Application 2020 & 2033
- Table 65: GCC Pam4 Dsp Revenue (million) Forecast, by Application 2020 & 2033
- Table 66: GCC Pam4 Dsp Volume (K) Forecast, by Application 2020 & 2033
- Table 67: North Africa Pam4 Dsp Revenue (million) Forecast, by Application 2020 & 2033
- Table 68: North Africa Pam4 Dsp Volume (K) Forecast, by Application 2020 & 2033
- Table 69: South Africa Pam4 Dsp Revenue (million) Forecast, by Application 2020 & 2033
- Table 70: South Africa Pam4 Dsp Volume (K) Forecast, by Application 2020 & 2033
- Table 71: Rest of Middle East & Africa Pam4 Dsp Revenue (million) Forecast, by Application 2020 & 2033
- Table 72: Rest of Middle East & Africa Pam4 Dsp Volume (K) Forecast, by Application 2020 & 2033
- Table 73: Global Pam4 Dsp Revenue million Forecast, by Application 2020 & 2033
- Table 74: Global Pam4 Dsp Volume K Forecast, by Application 2020 & 2033
- Table 75: Global Pam4 Dsp Revenue million Forecast, by Type 2020 & 2033
- Table 76: Global Pam4 Dsp Volume K Forecast, by Type 2020 & 2033
- Table 77: Global Pam4 Dsp Revenue million Forecast, by Country 2020 & 2033
- Table 78: Global Pam4 Dsp Volume K Forecast, by Country 2020 & 2033
- Table 79: China Pam4 Dsp Revenue (million) Forecast, by Application 2020 & 2033
- Table 80: China Pam4 Dsp Volume (K) Forecast, by Application 2020 & 2033
- Table 81: India Pam4 Dsp Revenue (million) Forecast, by Application 2020 & 2033
- Table 82: India Pam4 Dsp Volume (K) Forecast, by Application 2020 & 2033
- Table 83: Japan Pam4 Dsp Revenue (million) Forecast, by Application 2020 & 2033
- Table 84: Japan Pam4 Dsp Volume (K) Forecast, by Application 2020 & 2033
- Table 85: South Korea Pam4 Dsp Revenue (million) Forecast, by Application 2020 & 2033
- Table 86: South Korea Pam4 Dsp Volume (K) Forecast, by Application 2020 & 2033
- Table 87: ASEAN Pam4 Dsp Revenue (million) Forecast, by Application 2020 & 2033
- Table 88: ASEAN Pam4 Dsp Volume (K) Forecast, by Application 2020 & 2033
- Table 89: Oceania Pam4 Dsp Revenue (million) Forecast, by Application 2020 & 2033
- Table 90: Oceania Pam4 Dsp Volume (K) Forecast, by Application 2020 & 2033
- Table 91: Rest of Asia Pacific Pam4 Dsp Revenue (million) Forecast, by Application 2020 & 2033
- Table 92: Rest of Asia Pacific Pam4 Dsp Volume (K) Forecast, by Application 2020 & 2033
Frequently Asked Questions
1. What is the projected Compound Annual Growth Rate (CAGR) of the Pam4 Dsp?
The projected CAGR is approximately XXX%.
2. Which companies are prominent players in the Pam4 Dsp?
Key companies in the market include Marvell, Broadcom, MaxLinear, MACOM, NOEIC, Credo.
3. What are the main segments of the Pam4 Dsp?
The market segments include Application, Type.
4. Can you provide details about the market size?
The market size is estimated to be USD XXX million as of 2022.
5. What are some drivers contributing to market growth?
N/A
6. What are the notable trends driving market growth?
N/A
7. Are there any restraints impacting market growth?
N/A
8. Can you provide examples of recent developments in the market?
N/A
9. What pricing options are available for accessing the report?
Pricing options include single-user, multi-user, and enterprise licenses priced at USD 3950.00, USD 5925.00, and USD 7900.00 respectively.
10. Is the market size provided in terms of value or volume?
The market size is provided in terms of value, measured in million and volume, measured in K.
11. Are there any specific market keywords associated with the report?
Yes, the market keyword associated with the report is "Pam4 Dsp," which aids in identifying and referencing the specific market segment covered.
12. How do I determine which pricing option suits my needs best?
The pricing options vary based on user requirements and access needs. Individual users may opt for single-user licenses, while businesses requiring broader access may choose multi-user or enterprise licenses for cost-effective access to the report.
13. Are there any additional resources or data provided in the Pam4 Dsp report?
While the report offers comprehensive insights, it's advisable to review the specific contents or supplementary materials provided to ascertain if additional resources or data are available.
14. How can I stay updated on further developments or reports in the Pam4 Dsp?
To stay informed about further developments, trends, and reports in the Pam4 Dsp, consider subscribing to industry newsletters, following relevant companies and organizations, or regularly checking reputable industry news sources and publications.
Methodology
Step 1 - Identification of Relevant Samples Size from Population Database


Step 2 - Approaches for Defining Global Market Size (Value, Volume* & Price*)

Note*: In applicable scenarios
Step 3 - Data Sources
Primary Research
- Web Analytics
- Survey Reports
- Research Institute
- Latest Research Reports
- Opinion Leaders
Secondary Research
- Annual Reports
- White Paper
- Latest Press Release
- Industry Association
- Paid Database
- Investor Presentations

Step 4 - Data Triangulation
Involves using different sources of information in order to increase the validity of a study
These sources are likely to be stakeholders in a program - participants, other researchers, program staff, other community members, and so on.
Then we put all data in single framework & apply various statistical tools to find out the dynamic on the market.
During the analysis stage, feedback from the stakeholder groups would be compared to determine areas of agreement as well as areas of divergence