

Key Insights
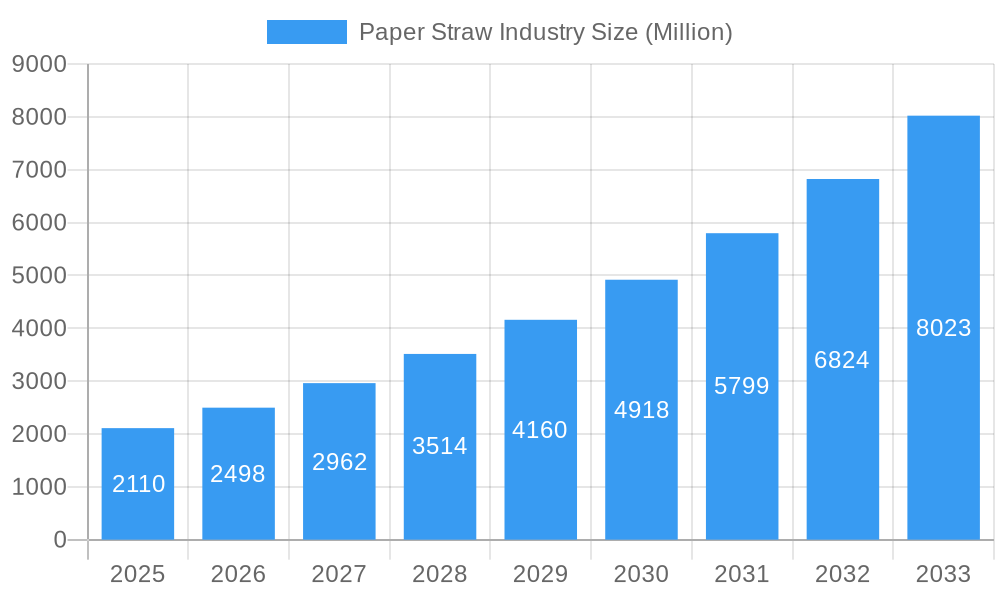
The global paper straw industry, valued at $2.11 billion in 2025, is experiencing robust growth, projected to expand at a compound annual growth rate (CAGR) of 18.73% from 2025 to 2033. This surge is primarily driven by the increasing consumer preference for eco-friendly alternatives to plastic straws, fueled by growing environmental awareness and stringent regulations against single-use plastics worldwide. Key market segments include foodservice, households, and institutions, with virgin paper and recycled paper representing the primary material types. The foodservice sector is expected to dominate, owing to the high volume of beverage consumption in restaurants and cafes. Furthermore, the rising demand for biodegradable and compostable packaging solutions across various industries is significantly bolstering the paper straw market. This positive trend is further amplified by advancements in paper straw manufacturing technologies, leading to enhanced durability and functionality.
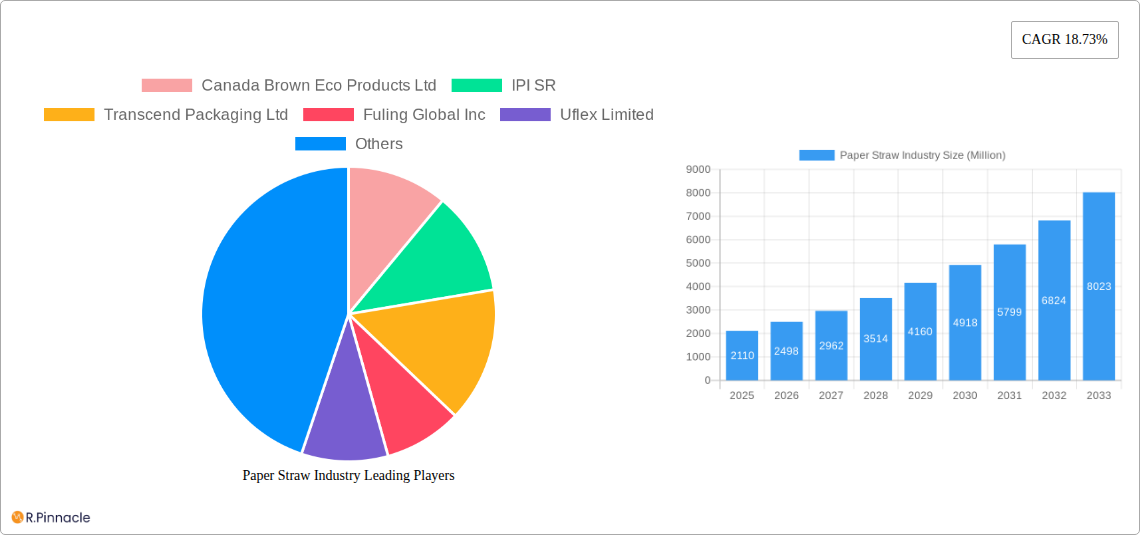
Paper Straw Industry Market Size (In Billion)
However, the industry also faces challenges. Fluctuations in raw material prices, particularly pulp and paper, pose a considerable restraint. Competition from alternative sustainable materials, such as bamboo and metal straws, also presents a degree of market pressure. Geographic variations in consumer preference and regulatory landscapes influence regional market performance; North America and Europe are currently leading, driven by strong environmental awareness and proactive government policies. The Asia-Pacific region, however, is projected to witness significant growth in the coming years, fueled by increasing disposable incomes and rising environmental concerns. Companies such as Canada Brown Eco Products, IPI SR, and Huhtamaki Oyj are key players shaping the industry landscape through innovation and strategic expansion. The forecast period (2025-2033) promises continued growth, though managing raw material costs and navigating competitive pressures will be crucial for sustained success.
Paper Straw Industry Company Market Share
Paper Straw Industry Market Report: 2019-2033
This comprehensive report provides a detailed analysis of the global paper straw industry, offering actionable insights for industry professionals, investors, and stakeholders. The report covers the period from 2019 to 2033, with a focus on the forecast period of 2025-2033 and a base year of 2025. The market is projected to reach xx Million by 2033, exhibiting a CAGR of xx% during the forecast period.
Paper Straw Industry Market Structure & Innovation Trends
The global paper straw market is moderately fragmented, with several key players vying for market share. Market concentration is xx%, with the top 5 players accounting for approximately xx% of the total revenue. Innovation is driven by the increasing demand for sustainable and eco-friendly alternatives to plastic straws, stringent environmental regulations, and advancements in paper-based material science. Key innovation drivers include the development of biodegradable and compostable paper straws, improved strength and durability, and the exploration of novel materials and coatings. Significant M&A activities have also shaped the market landscape. For example, the partnership between Transcend Packaging and ITOCHU Corporation in April 2023 indicates strategic expansion efforts. The total value of M&A deals in the paper straw industry during the historical period (2019-2024) is estimated at xx Million.
- Market Share: Top 5 players: xx%
- M&A Deal Value (2019-2024): xx Million
- Key Innovation Drivers: Biodegradability, improved durability, novel materials.
- Regulatory Framework: Growing emphasis on sustainability and plastic reduction.
- Product Substitutes: Bioplastic straws, reusable straws.
Paper Straw Industry Market Dynamics & Trends
The paper straw market is experiencing robust growth fueled by several factors. The rising awareness of environmental issues and the global push to reduce plastic waste are primary drivers. Consumer preferences are shifting towards sustainable and eco-friendly products, further boosting the demand for paper straws. Technological advancements, including improvements in material science and manufacturing processes, are enhancing the performance and cost-effectiveness of paper straws. The market is witnessing increasing penetration in various segments, particularly the food service sector. However, competitive dynamics remain intense, with players focusing on product differentiation, branding, and cost optimization to gain a competitive edge. The market exhibits a steady CAGR of xx% during the forecast period (2025-2033), reaching a projected xx Million by 2033. Market penetration of paper straws in the foodservice sector is estimated at xx% in 2025, projected to increase to xx% by 2033.
Dominant Regions & Segments in Paper Straw Industry
The North American region currently holds a leading position in the paper straw market, driven by stringent environmental regulations and high consumer awareness of sustainability. However, the Asia-Pacific region is expected to exhibit significant growth in the coming years due to increasing disposable incomes and rising demand for convenient food and beverage packaging.
By Material Type:
- Virgin Paper: This segment holds a significant market share owing to its superior quality and performance characteristics, but is facing increasing pressure from recycled paper alternatives.
- Recycled Paper: This segment is experiencing rapid growth, driven by sustainability concerns and cost advantages.
By Application:
- Foodservice: This segment accounts for the largest market share due to widespread adoption by restaurants, cafes, and quick-service restaurants.
- Households: This segment demonstrates steady growth, driven by increasing consumer demand for sustainable alternatives to plastic straws.
- Institutions: Institutions such as schools, hospitals, and hotels are increasingly adopting paper straws, driven by environmental policies and initiatives.
Key Drivers (by region/segment):
- North America: Stringent environmental regulations, high consumer awareness.
- Asia-Pacific: Rising disposable incomes, increasing demand for convenient packaging.
- Foodservice: Widespread adoption by food and beverage establishments.
- Recycled Paper: Sustainability concerns, cost-effectiveness.
Paper Straw Industry Product Innovations
Recent innovations focus on enhancing the functionality and sustainability of paper straws. Companies are developing straws with improved water resistance, higher strength, and longer lifespan. The use of biodegradable and compostable coatings and materials is also a major focus, aligning with growing environmental concerns. These innovations address market demands for sustainable, functional alternatives to plastic straws, enhancing their competitiveness and appeal to environmentally conscious consumers.
Report Scope & Segmentation Analysis
This report comprehensively analyzes the paper straw market across various segments.
By Material Type: The report examines the market size, growth projections, and competitive dynamics of both virgin paper and recycled paper straws.
By Application: The report analyzes the market size and growth potential of paper straws across foodservice, households, and institutional settings.
Key Drivers of Paper Straw Industry Growth
The growth of the paper straw industry is propelled by several key factors: increasing consumer preference for eco-friendly products; stringent government regulations aimed at reducing plastic waste; rising awareness of environmental issues and the harmful effects of plastic pollution; and technological advancements resulting in improved paper straw durability and functionality.
Challenges in the Paper Straw Industry Sector
The industry faces challenges such as fluctuating raw material prices, increased competition from alternative sustainable materials, and the need for continuous improvement in paper straw quality and functionality to meet the needs of diverse end users. These factors can affect production costs and market competitiveness.
Emerging Opportunities in Paper Straw Industry
Opportunities lie in expanding into new markets, developing innovative biodegradable coatings, and exploring new materials to enhance paper straw performance. Furthermore, focusing on customization and branding to meet specific consumer needs will unlock considerable market potential.
Leading Players in the Paper Straw Industry Market
- Canada Brown Eco Products Ltd
- IPI SR
- Transcend Packaging Ltd
- Fuling Global Inc
- Uflex Limited
- Tembo Paper BV
- Karat Packaging Inc (Lollicup USA Inc)
- Tetra Pak International SA
- Huhtamaki Oyj
- Hoffmaster Group Inc
Key Developments in Paper Straw Industry
- April 2023: Transcend Packaging Ltd announced a strategic partnership with ITOCHU Corporation, expanding its reach in Asia and North America. This significantly enhances Transcend Packaging's market position and production capacity.
- February 2023: Tetra Pak International SA initiated research with MAX IV to enhance fiber-based packaging, including paper straws, improving their structural integrity and sustainability. This research aims to create more durable and eco-friendly products.
Future Outlook for Paper Straw Industry Market
The future of the paper straw industry is bright, driven by sustained consumer demand for sustainable alternatives and ongoing innovation to enhance product performance. Strategic partnerships, investments in R&D, and expansion into new markets will be crucial for sustained growth and market leadership. The industry is well-positioned for continued expansion, with opportunities for innovation and market penetration across diverse segments and geographies.
Paper Straw Industry Segmentation
-
1. Material Type
- 1.1. Virgin Paper
- 1.2. Recycled Paper
-
2. Application
- 2.1. Foodservice
- 2.2. Households
- 2.3. Institutions
Paper Straw Industry Segmentation By Geography
- 1. North America
- 2. Europe
- 3. Asia Pacific
- 4. Latin America
- 5. Middle East and Africa
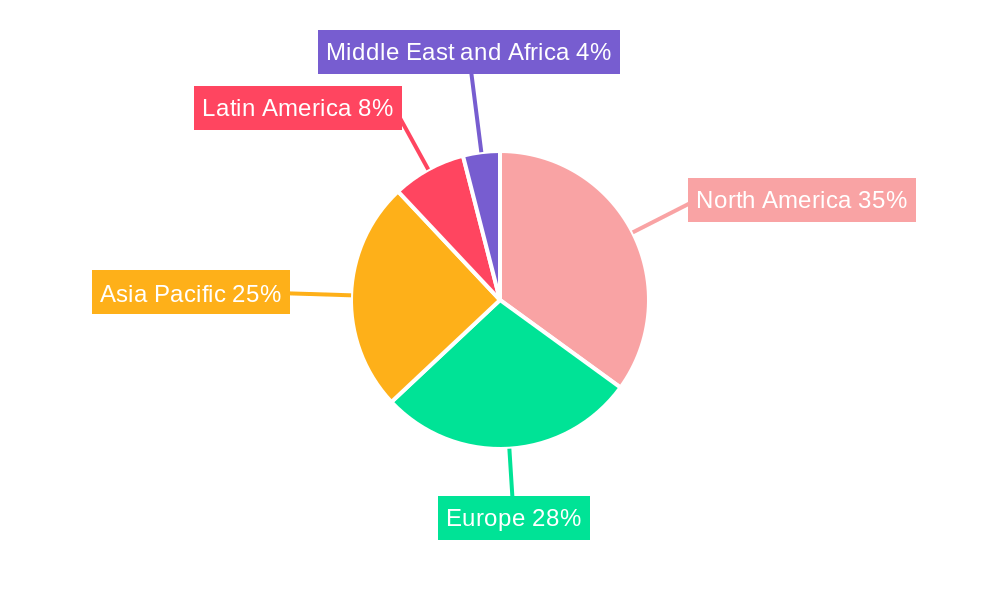
Paper Straw Industry Regional Market Share
Geographic Coverage of Paper Straw Industry
Paper Straw Industry REPORT HIGHLIGHTS
| Aspects | Details |
|---|---|
| Study Period | 2020-2034 |
| Base Year | 2025 |
| Estimated Year | 2026 |
| Forecast Period | 2026-2034 |
| Historical Period | 2020-2025 |
| Growth Rate | CAGR of 18.73% from 2020-2034 |
| Segmentation |
|
Table of Contents
- 1. Introduction
- 1.1. Research Scope
- 1.2. Market Segmentation
- 1.3. Research Objective
- 1.4. Definitions and Assumptions
- 2. Executive Summary
- 2.1. Market Snapshot
- 3. Market Dynamics
- 3.1. Market Drivers
- 3.2. Market Restrains
- 3.3. Market Trends
- 3.4. Market Opportunities
- 4. Market Factor Analysis
- 4.1. Porters Five Forces
- 4.1.1. Bargaining Power of Suppliers
- 4.1.2. Bargaining Power of Buyers
- 4.1.3. Threat of New Entrants
- 4.1.4. Threat of Substitutes
- 4.1.5. Competitive Rivalry
- 4.2. PESTEL analysis
- 4.3. BCG Analysis
- 4.3.1. Stars (High Growth, High Market Share)
- 4.3.2. Cash Cows (Low Growth, High Market Share)
- 4.3.3. Question Mark (High Growth, Low Market Share)
- 4.3.4. Dogs (Low Growth, Low Market Share)
- 4.4. Ansoff Matrix Analysis
- 4.5. Supply Chain Analysis
- 4.6. Regulatory Landscape
- 4.7. Current Market Potential and Opportunity Assessment (TAM–SAM–SOM Framework)
- 4.8. PRI Analyst Note
- 4.1. Porters Five Forces
- 5. Market Analysis, Insights and Forecast 2021-2033
- 5.1. Market Analysis, Insights and Forecast - by Material Type
- 5.1.1. Virgin Paper
- 5.1.2. Recycled Paper
- 5.2. Market Analysis, Insights and Forecast - by Application
- 5.2.1. Foodservice
- 5.2.2. Households
- 5.2.3. Institutions
- 5.3. Market Analysis, Insights and Forecast - by Region
- 5.3.1. North America
- 5.3.2. Europe
- 5.3.3. Asia Pacific
- 5.3.4. Latin America
- 5.3.5. Middle East and Africa
- 5.1. Market Analysis, Insights and Forecast - by Material Type
- 6. Global Paper Straw Industry Analysis, Insights and Forecast, 2021-2033
- 6.1. Market Analysis, Insights and Forecast - by Material Type
- 6.1.1. Virgin Paper
- 6.1.2. Recycled Paper
- 6.2. Market Analysis, Insights and Forecast - by Application
- 6.2.1. Foodservice
- 6.2.2. Households
- 6.2.3. Institutions
- 6.1. Market Analysis, Insights and Forecast - by Material Type
- 7. North America Paper Straw Industry Analysis, Insights and Forecast, 2020-2032
- 7.1. Market Analysis, Insights and Forecast - by Material Type
- 7.1.1. Virgin Paper
- 7.1.2. Recycled Paper
- 7.2. Market Analysis, Insights and Forecast - by Application
- 7.2.1. Foodservice
- 7.2.2. Households
- 7.2.3. Institutions
- 7.1. Market Analysis, Insights and Forecast - by Material Type
- 8. Europe Paper Straw Industry Analysis, Insights and Forecast, 2020-2032
- 8.1. Market Analysis, Insights and Forecast - by Material Type
- 8.1.1. Virgin Paper
- 8.1.2. Recycled Paper
- 8.2. Market Analysis, Insights and Forecast - by Application
- 8.2.1. Foodservice
- 8.2.2. Households
- 8.2.3. Institutions
- 8.1. Market Analysis, Insights and Forecast - by Material Type
- 9. Asia Pacific Paper Straw Industry Analysis, Insights and Forecast, 2020-2032
- 9.1. Market Analysis, Insights and Forecast - by Material Type
- 9.1.1. Virgin Paper
- 9.1.2. Recycled Paper
- 9.2. Market Analysis, Insights and Forecast - by Application
- 9.2.1. Foodservice
- 9.2.2. Households
- 9.2.3. Institutions
- 9.1. Market Analysis, Insights and Forecast - by Material Type
- 10. Latin America Paper Straw Industry Analysis, Insights and Forecast, 2020-2032
- 10.1. Market Analysis, Insights and Forecast - by Material Type
- 10.1.1. Virgin Paper
- 10.1.2. Recycled Paper
- 10.2. Market Analysis, Insights and Forecast - by Application
- 10.2.1. Foodservice
- 10.2.2. Households
- 10.2.3. Institutions
- 10.1. Market Analysis, Insights and Forecast - by Material Type
- 11. Middle East and Africa Paper Straw Industry Analysis, Insights and Forecast, 2020-2032
- 11.1. Market Analysis, Insights and Forecast - by Material Type
- 11.1.1. Virgin Paper
- 11.1.2. Recycled Paper
- 11.2. Market Analysis, Insights and Forecast - by Application
- 11.2.1. Foodservice
- 11.2.2. Households
- 11.2.3. Institutions
- 11.1. Market Analysis, Insights and Forecast - by Material Type
- 12. Competitive Analysis
- 12.1. Company Profiles
- 12.1.1 Canada Brown Eco Products Ltd
- 12.1.1.1. Company Overview
- 12.1.1.2. Products
- 12.1.1.3. Company Financials
- 12.1.1.4. SWOT Analysis
- 12.1.2 IPI SR
- 12.1.2.1. Company Overview
- 12.1.2.2. Products
- 12.1.2.3. Company Financials
- 12.1.2.4. SWOT Analysis
- 12.1.3 Transcend Packaging Ltd
- 12.1.3.1. Company Overview
- 12.1.3.2. Products
- 12.1.3.3. Company Financials
- 12.1.3.4. SWOT Analysis
- 12.1.4 Fuling Global Inc
- 12.1.4.1. Company Overview
- 12.1.4.2. Products
- 12.1.4.3. Company Financials
- 12.1.4.4. SWOT Analysis
- 12.1.5 Uflex Limited
- 12.1.5.1. Company Overview
- 12.1.5.2. Products
- 12.1.5.3. Company Financials
- 12.1.5.4. SWOT Analysis
- 12.1.6 Tembo Paper BV
- 12.1.6.1. Company Overview
- 12.1.6.2. Products
- 12.1.6.3. Company Financials
- 12.1.6.4. SWOT Analysis
- 12.1.7 Karat Packaging Inc (Lollicup USA Inc )
- 12.1.7.1. Company Overview
- 12.1.7.2. Products
- 12.1.7.3. Company Financials
- 12.1.7.4. SWOT Analysis
- 12.1.8 Tetra Pak International SA
- 12.1.8.1. Company Overview
- 12.1.8.2. Products
- 12.1.8.3. Company Financials
- 12.1.8.4. SWOT Analysis
- 12.1.9 Huhtamaki Oyj
- 12.1.9.1. Company Overview
- 12.1.9.2. Products
- 12.1.9.3. Company Financials
- 12.1.9.4. SWOT Analysis
- 12.1.10 Hoffmaster Group Inc
- 12.1.10.1. Company Overview
- 12.1.10.2. Products
- 12.1.10.3. Company Financials
- 12.1.10.4. SWOT Analysis
- 12.1.1 Canada Brown Eco Products Ltd
- 12.2. Market Entropy
- 12.2.1 Company's Key Areas Served
- 12.2.2 Recent Developments
- 12.3. Company Market Share Analysis 2025
- 12.3.1 Top 5 Companies Market Share Analysis
- 12.3.2 Top 3 Companies Market Share Analysis
- 12.4. List of Potential Customers
- 13. Research Methodology
List of Figures
- Figure 1: Global Paper Straw Industry Revenue Breakdown (Million, %) by Region 2025 & 2033
- Figure 2: North America Paper Straw Industry Revenue (Million), by Material Type 2025 & 2033
- Figure 3: North America Paper Straw Industry Revenue Share (%), by Material Type 2025 & 2033
- Figure 4: North America Paper Straw Industry Revenue (Million), by Application 2025 & 2033
- Figure 5: North America Paper Straw Industry Revenue Share (%), by Application 2025 & 2033
- Figure 6: North America Paper Straw Industry Revenue (Million), by Country 2025 & 2033
- Figure 7: North America Paper Straw Industry Revenue Share (%), by Country 2025 & 2033
- Figure 8: Europe Paper Straw Industry Revenue (Million), by Material Type 2025 & 2033
- Figure 9: Europe Paper Straw Industry Revenue Share (%), by Material Type 2025 & 2033
- Figure 10: Europe Paper Straw Industry Revenue (Million), by Application 2025 & 2033
- Figure 11: Europe Paper Straw Industry Revenue Share (%), by Application 2025 & 2033
- Figure 12: Europe Paper Straw Industry Revenue (Million), by Country 2025 & 2033
- Figure 13: Europe Paper Straw Industry Revenue Share (%), by Country 2025 & 2033
- Figure 14: Asia Pacific Paper Straw Industry Revenue (Million), by Material Type 2025 & 2033
- Figure 15: Asia Pacific Paper Straw Industry Revenue Share (%), by Material Type 2025 & 2033
- Figure 16: Asia Pacific Paper Straw Industry Revenue (Million), by Application 2025 & 2033
- Figure 17: Asia Pacific Paper Straw Industry Revenue Share (%), by Application 2025 & 2033
- Figure 18: Asia Pacific Paper Straw Industry Revenue (Million), by Country 2025 & 2033
- Figure 19: Asia Pacific Paper Straw Industry Revenue Share (%), by Country 2025 & 2033
- Figure 20: Latin America Paper Straw Industry Revenue (Million), by Material Type 2025 & 2033
- Figure 21: Latin America Paper Straw Industry Revenue Share (%), by Material Type 2025 & 2033
- Figure 22: Latin America Paper Straw Industry Revenue (Million), by Application 2025 & 2033
- Figure 23: Latin America Paper Straw Industry Revenue Share (%), by Application 2025 & 2033
- Figure 24: Latin America Paper Straw Industry Revenue (Million), by Country 2025 & 2033
- Figure 25: Latin America Paper Straw Industry Revenue Share (%), by Country 2025 & 2033
- Figure 26: Middle East and Africa Paper Straw Industry Revenue (Million), by Material Type 2025 & 2033
- Figure 27: Middle East and Africa Paper Straw Industry Revenue Share (%), by Material Type 2025 & 2033
- Figure 28: Middle East and Africa Paper Straw Industry Revenue (Million), by Application 2025 & 2033
- Figure 29: Middle East and Africa Paper Straw Industry Revenue Share (%), by Application 2025 & 2033
- Figure 30: Middle East and Africa Paper Straw Industry Revenue (Million), by Country 2025 & 2033
- Figure 31: Middle East and Africa Paper Straw Industry Revenue Share (%), by Country 2025 & 2033
List of Tables
- Table 1: Global Paper Straw Industry Revenue Million Forecast, by Material Type 2020 & 2033
- Table 2: Global Paper Straw Industry Revenue Million Forecast, by Application 2020 & 2033
- Table 3: Global Paper Straw Industry Revenue Million Forecast, by Region 2020 & 2033
- Table 4: Global Paper Straw Industry Revenue Million Forecast, by Material Type 2020 & 2033
- Table 5: Global Paper Straw Industry Revenue Million Forecast, by Application 2020 & 2033
- Table 6: Global Paper Straw Industry Revenue Million Forecast, by Country 2020 & 2033
- Table 7: Global Paper Straw Industry Revenue Million Forecast, by Material Type 2020 & 2033
- Table 8: Global Paper Straw Industry Revenue Million Forecast, by Application 2020 & 2033
- Table 9: Global Paper Straw Industry Revenue Million Forecast, by Country 2020 & 2033
- Table 10: Global Paper Straw Industry Revenue Million Forecast, by Material Type 2020 & 2033
- Table 11: Global Paper Straw Industry Revenue Million Forecast, by Application 2020 & 2033
- Table 12: Global Paper Straw Industry Revenue Million Forecast, by Country 2020 & 2033
- Table 13: Global Paper Straw Industry Revenue Million Forecast, by Material Type 2020 & 2033
- Table 14: Global Paper Straw Industry Revenue Million Forecast, by Application 2020 & 2033
- Table 15: Global Paper Straw Industry Revenue Million Forecast, by Country 2020 & 2033
- Table 16: Global Paper Straw Industry Revenue Million Forecast, by Material Type 2020 & 2033
- Table 17: Global Paper Straw Industry Revenue Million Forecast, by Application 2020 & 2033
- Table 18: Global Paper Straw Industry Revenue Million Forecast, by Country 2020 & 2033
Frequently Asked Questions
1. What is the projected Compound Annual Growth Rate (CAGR) of the Paper Straw Industry?
The projected CAGR is approximately 18.73%.
2. Which companies are prominent players in the Paper Straw Industry?
Key companies in the market include Canada Brown Eco Products Ltd, IPI SR, Transcend Packaging Ltd, Fuling Global Inc, Uflex Limited, Tembo Paper BV, Karat Packaging Inc (Lollicup USA Inc ), Tetra Pak International SA, Huhtamaki Oyj, Hoffmaster Group Inc.
3. What are the main segments of the Paper Straw Industry?
The market segments include Material Type, Application.
4. Can you provide details about the market size?
The market size is estimated to be USD 2.11 Million as of 2022.
5. What are some drivers contributing to market growth?
Increasing Consumer Demand for Eco-Friendly Straws; Ban on Single-use Plastic Products Aids the Market Growth.
6. What are the notable trends driving market growth?
The Rise of Environmentally Friendly Straws in Response to Stringent Regulations.
7. Are there any restraints impacting market growth?
Competition from In-house packaging.
8. Can you provide examples of recent developments in the market?
April 2023: Transcend Packaging Ltd announced its strategic partnership with ITOCHU Corporation, a global provider of pulp and paper products. The partnership will help the company expand its footprint in Asia and North America with a variety of products.
9. What pricing options are available for accessing the report?
Pricing options include single-user, multi-user, and enterprise licenses priced at USD 4750, USD 5250, and USD 8750 respectively.
10. Is the market size provided in terms of value or volume?
The market size is provided in terms of value, measured in Million.
11. Are there any specific market keywords associated with the report?
Yes, the market keyword associated with the report is "Paper Straw Industry," which aids in identifying and referencing the specific market segment covered.
12. How do I determine which pricing option suits my needs best?
The pricing options vary based on user requirements and access needs. Individual users may opt for single-user licenses, while businesses requiring broader access may choose multi-user or enterprise licenses for cost-effective access to the report.
13. Are there any additional resources or data provided in the Paper Straw Industry report?
While the report offers comprehensive insights, it's advisable to review the specific contents or supplementary materials provided to ascertain if additional resources or data are available.
14. How can I stay updated on further developments or reports in the Paper Straw Industry?
To stay informed about further developments, trends, and reports in the Paper Straw Industry, consider subscribing to industry newsletters, following relevant companies and organizations, or regularly checking reputable industry news sources and publications.
Methodology
Step 1 - Identification of Relevant Samples Size from Population Database


Step 2 - Approaches for Defining Global Market Size (Value, Volume* & Price*)

Note*: In applicable scenarios
Step 3 - Data Sources
Primary Research
- Web Analytics
- Survey Reports
- Research Institute
- Latest Research Reports
- Opinion Leaders
Secondary Research
- Annual Reports
- White Paper
- Latest Press Release
- Industry Association
- Paid Database
- Investor Presentations

Step 4 - Data Triangulation
Involves using different sources of information in order to increase the validity of a study
These sources are likely to be stakeholders in a program - participants, other researchers, program staff, other community members, and so on.
Then we put all data in single framework & apply various statistical tools to find out the dynamic on the market.
During the analysis stage, feedback from the stakeholder groups would be compared to determine areas of agreement as well as areas of divergence