
Key Insights
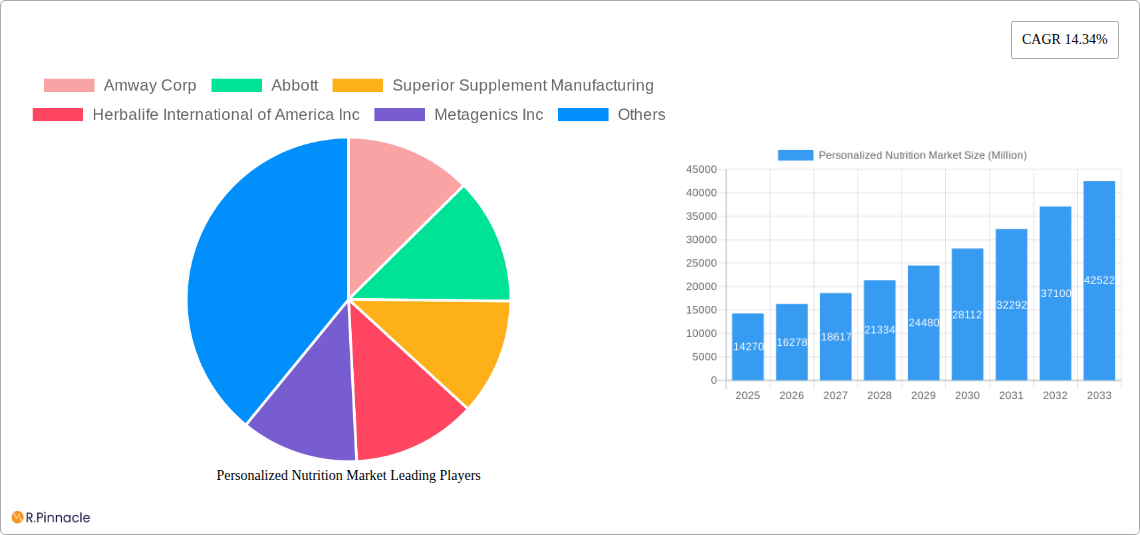
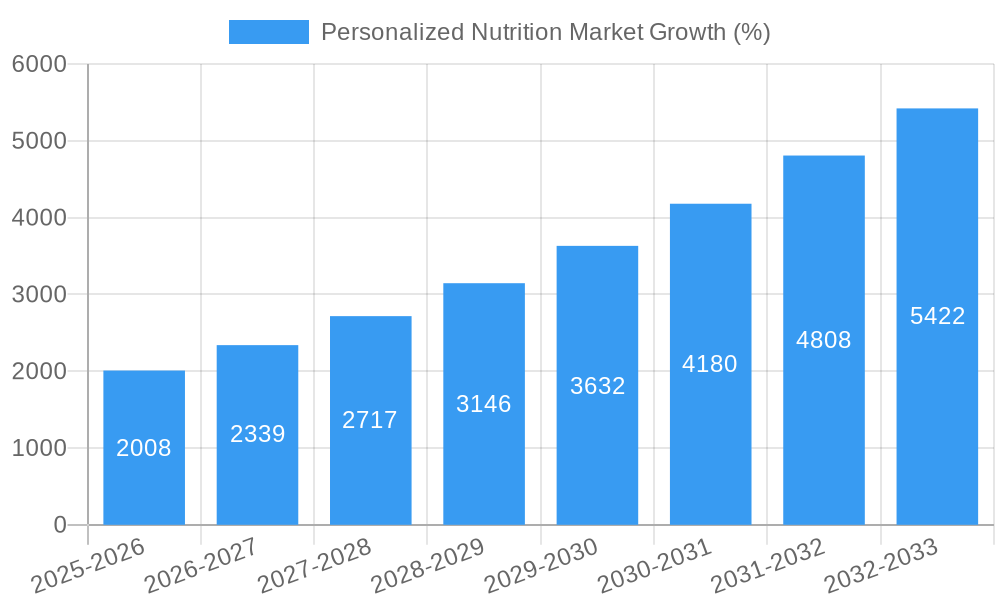
The personalized nutrition market is experiencing robust growth, projected to reach \$14.27 billion in 2025 and exhibiting a Compound Annual Growth Rate (CAGR) of 14.34% from 2025 to 2033. This expansion is fueled by several key drivers. The increasing prevalence of chronic diseases like diabetes and heart disease is pushing consumers towards proactive health management, seeking tailored nutritional solutions. Advancements in genomics, microbiome analysis, and wearable technology provide increasingly accurate data for personalized recommendations, further stimulating market growth. Furthermore, the rising consumer awareness of the link between diet and overall well-being, coupled with the growing accessibility of personalized nutrition products and services through online platforms and mobile apps, is significantly contributing to market expansion. Competition is fierce, with established players like Amway Corp and Abbott alongside emerging companies like Viome Life Sciences Inc. This competitive landscape fosters innovation and drives the development of increasingly sophisticated and effective personalized nutrition solutions.
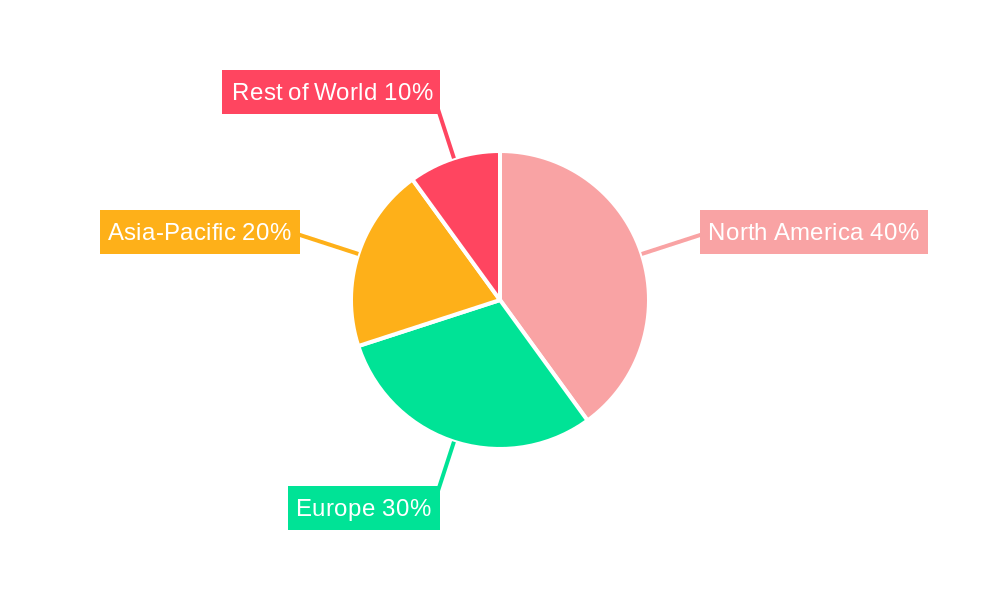
The market segmentation, while not explicitly detailed, likely includes various product categories such as dietary supplements, functional foods, meal replacement shakes, and personalized nutrition plans. Geographical variations are expected, with developed regions like North America and Europe likely holding larger market shares initially due to higher disposable incomes and greater health awareness. However, developing economies are poised for significant growth as awareness of personalized nutrition increases and purchasing power rises. Potential restraints include the high cost of personalized genetic testing and customized nutritional plans, which might limit accessibility for certain consumer segments. Addressing this through innovative pricing strategies and increased insurance coverage could unlock further market potential. The overall outlook for the personalized nutrition market remains exceptionally positive, driven by technological advancements, evolving consumer preferences, and the growing recognition of nutrition's pivotal role in preventive healthcare.
Personalized Nutrition Market Report: 2019-2033
This comprehensive report provides a detailed analysis of the Personalized Nutrition Market, offering invaluable insights for industry professionals, investors, and strategic decision-makers. With a study period spanning 2019-2033, a base year of 2025, and a forecast period of 2025-2033, this report leverages extensive data analysis to illuminate current market dynamics and predict future trends. The report covers key market segments, leading players like Amway Corp, Abbott, and Viome Life Sciences Inc, and analyzes crucial market developments. Expect actionable data-driven insights and strategic recommendations to navigate this rapidly evolving market.
Personalized Nutrition Market Market Structure & Innovation Trends
This section analyzes the competitive landscape of the personalized nutrition market, exploring market concentration, innovation drivers, regulatory frameworks, and key industry activities during the historical period (2019-2024). The market is characterized by a mix of established players and emerging startups, leading to a dynamic competitive environment.
Market Concentration: The market exhibits a moderately concentrated structure, with a few dominant players holding significant market share (xx%). However, the entry of numerous startups and smaller players is increasing competition. A detailed analysis of market share held by leading players like Amway Corp, Abbott, and Herbalife International of America Inc will be provided.
Innovation Drivers: Key drivers include advancements in genomics, data analytics, and personalized medicine. These innovations enable the development of highly targeted nutritional products and services.
Regulatory Frameworks: Varying regulatory frameworks across different geographies significantly impact market growth and product development. A detailed analysis of regional regulations influencing market dynamics will be included.
Product Substitutes: Existing substitutes include traditional nutritional supplements and dietary advice. However, the personalized approach offers a superior level of efficacy and customization, driving its market penetration.
End-User Demographics: The primary target demographics include health-conscious individuals, athletes, and people with specific dietary requirements or health conditions. Analysis on end-user preferences and segment-wise market growth will be given.
M&A Activities: The report will analyze major mergers and acquisitions (M&A) during the historical period, including the deal values (xx Million) and their impact on market consolidation and innovation.
Personalized Nutrition Market Market Dynamics & Trends
This section delves into the key factors influencing the growth trajectory of the personalized nutrition market between 2019 and 2033. It analyzes market growth drivers, technological disruptions, consumer preferences, and competitive dynamics. The market is expected to witness significant growth, driven by increasing consumer awareness of personalized health and wellness.
The market exhibits a Compound Annual Growth Rate (CAGR) of xx% during the forecast period (2025-2033). The increasing adoption of personalized nutrition solutions, fueled by technological advancements, is significantly impacting market penetration, which is projected to reach xx% by 2033. This growth is further propelled by the rising prevalence of chronic diseases and increasing consumer spending on health and wellness products. Competitive dynamics are shaped by innovation in product offerings, marketing strategies, and partnerships that extend reach and consumer adoption.
Dominant Regions & Segments in Personalized Nutrition Market
This section identifies the leading regions and segments within the personalized nutrition market. The report will provide a detailed breakdown of regional dominance, based on factors including economic policies, infrastructure, and consumer preferences. Market size, growth projections, and competitive dynamics are examined for each key segment.
Leading Region/Country: [Insert Leading Region/Country - e.g., North America]. Key drivers for this region include high disposable incomes, increased awareness of personalized health, and robust healthcare infrastructure. Detailed analysis of the growth drivers and market trends will be presented.
Leading Segment: [Insert Leading Segment - e.g., Dietary Supplements]. This segment's dominance is attributed to factors like increasing preference for convenient and effective personalized nutritional solutions, technological advancements that enable better efficacy, and higher rate of adoption by the target segments. This section will also analyze other segments like functional foods and personalized meal plans.
Personalized Nutrition Market Product Innovations
Recent years have witnessed significant innovation in personalized nutrition products, driven by advancements in genomics, AI, and data analytics. This has led to the development of highly targeted nutritional products and services. These products cater to specific individual needs based on genetic predispositions, lifestyle, and health goals. The market is seeing the introduction of advanced formulations and technologies like microgranule nutrient blends (as seen in Riise’s launch) which improve product efficacy and convenience. Companies are focused on delivering superior personalized solutions, driving increased market penetration.
Report Scope & Segmentation Analysis
This report provides a comprehensive segmentation analysis of the personalized nutrition market, considering factors such as product type, application, end-user, and region. It details the growth projections, market sizes, and competitive dynamics for each segment. Detailed market size and CAGR for each segment will be presented, categorized by product type (e.g., dietary supplements, functional foods, personalized meal plans), end-user (e.g., individuals, athletes, medical institutions), and geographic regions (e.g., North America, Europe, Asia-Pacific).
Key Drivers of Personalized Nutrition Market Growth
The growth of the personalized nutrition market is driven by several key factors. The increasing prevalence of chronic diseases necessitates tailored nutritional interventions, alongside rising consumer awareness and the willingness to spend on preventative healthcare. Technological advancements such as advanced analytics and genetics testing drive precision in delivering targeted health solutions. Furthermore, supportive government regulations and increased investment in research and development are boosting innovation in this space. Bioniq’s partnership with Truemed, enabling HSA/FSA spending, is a perfect example of a development that fuels this market growth.
Challenges in the Personalized Nutrition Market Sector
Despite the significant growth potential, the personalized nutrition market faces several challenges. High costs associated with genetic testing and data analysis can limit market accessibility. Regulatory hurdles in different regions create complexities for product development and distribution. Additionally, maintaining the accuracy and privacy of consumer data presents a major challenge. Competition amongst various players influences prices and reduces margins, and supply chain disruptions are another factor affecting availability and costs.
Emerging Opportunities in Personalized Nutrition Market
Emerging technologies like AI and machine learning hold immense potential to further personalize nutrition strategies. Expanding into new markets and consumer segments like the elderly population also presents significant opportunity. Moreover, integrating personalized nutrition with other healthcare solutions and telehealth services will lead to wider adoption and greater market expansion. The shift towards preventative healthcare increases the demand for proactive health management, directly benefiting the personalized nutrition sector.
Leading Players in the Personalized Nutrition Market Market
- Amway Corp
- Abbott
- Superior Supplement Manufacturing
- Herbalife International of America Inc
- Metagenics Inc
- GX Sciences LLC
- Nutralliance
- Divine Design Manufacturing
- Archer Daniels Midland Company (ADM)
- Viome Life Sciences Inc
- List Not Exhaustive
Key Developments in Personalized Nutrition Market Industry
February 2024: Riise, a Berlin-based supplement startup, introduced its personalized microgranule nutrient blends, showcasing innovation in product delivery and convenience. This directly caters to individual needs and health goals.
September 2024: Bioniq partnered with Truemed, enabling the use of HSA/FSA funds for its pharmaceutical-grade supplements. This development significantly broadens market access by addressing affordability concerns and positioning personalized nutrition within established healthcare reimbursement systems.
Future Outlook for Personalized Nutrition Market Market
The future of the personalized nutrition market is promising, driven by continuous technological advancements, increasing consumer demand, and supportive regulatory frameworks. The integration of AI and big data will lead to more precise and effective solutions. Expanding into new geographical regions and tapping into underserved populations, along with strategic collaborations with healthcare providers, will accelerate market growth and create significant opportunities for industry players. The shift towards preventative and personalized healthcare will further drive the market's expansion in the coming years.
Personalized Nutrition Market Segmentation
-
1. Product Type
- 1.1. Active Measurement
- 1.2. Standard Measurement
-
2. Application
- 2.1. Standard Supplements
- 2.2. Disease-based
-
3. End User
- 3.1. Direct-to-Consumer
- 3.2. Wellness and Fitness Centers
- 3.3. Hospitals and Clinics
- 3.4. Research Institutions
Personalized Nutrition Market Segmentation By Geography
-
1. North America
- 1.1. United States
- 1.2. Canada
- 1.3. Mexico
-
2. Europe
- 2.1. Germany
- 2.2. United Kingdom
- 2.3. France
- 2.4. Italy
- 2.5. Spain
- 2.6. Rest of Europe
-
3. Asia Pacific
- 3.1. China
- 3.2. Japan
- 3.3. India
- 3.4. Australia
- 3.5. South Korea
- 3.6. Rest of Asia Pacific
-
4. Middle East and Africa
- 4.1. GCC
- 4.2. South Africa
- 4.3. Rest of Middle East and Africa
-
5. South America
- 5.1. Brazil
- 5.2. Argentina
- 5.3. Rest of South America
Personalized Nutrition Market REPORT HIGHLIGHTS
| Aspects | Details |
|---|---|
| Study Period | 2019-2033 |
| Base Year | 2024 |
| Estimated Year | 2025 |
| Forecast Period | 2025-2033 |
| Historical Period | 2019-2024 |
| Growth Rate | CAGR of 14.34% from 2019-2033 |
| Segmentation |
|
Table of Contents
- 1. Introduction
- 1.1. Research Scope
- 1.2. Market Segmentation
- 1.3. Research Methodology
- 1.4. Definitions and Assumptions
- 2. Executive Summary
- 2.1. Introduction
- 3. Market Dynamics
- 3.1. Introduction
- 3.2. Market Drivers
- 3.2.1. Shift in Consumer Preference Due to a Rise in Health Awareness; Increasing Burden of Chronic Diseases and Geriatric Population; Technological Advancements and Growing Trend of Digital Healthcare
- 3.3. Market Restrains
- 3.3.1. Shift in Consumer Preference Due to a Rise in Health Awareness; Increasing Burden of Chronic Diseases and Geriatric Population; Technological Advancements and Growing Trend of Digital Healthcare
- 3.4. Market Trends
- 3.4.1. Disease-based Segment Expected to Hold a Significant Share Over the Forecast Period
- 4. Market Factor Analysis
- 4.1. Porters Five Forces
- 4.2. Supply/Value Chain
- 4.3. PESTEL analysis
- 4.4. Market Entropy
- 4.5. Patent/Trademark Analysis
- 5. Global Personalized Nutrition Market Analysis, Insights and Forecast, 2019-2031
- 5.1. Market Analysis, Insights and Forecast - by Product Type
- 5.1.1. Active Measurement
- 5.1.2. Standard Measurement
- 5.2. Market Analysis, Insights and Forecast - by Application
- 5.2.1. Standard Supplements
- 5.2.2. Disease-based
- 5.3. Market Analysis, Insights and Forecast - by End User
- 5.3.1. Direct-to-Consumer
- 5.3.2. Wellness and Fitness Centers
- 5.3.3. Hospitals and Clinics
- 5.3.4. Research Institutions
- 5.4. Market Analysis, Insights and Forecast - by Region
- 5.4.1. North America
- 5.4.2. Europe
- 5.4.3. Asia Pacific
- 5.4.4. Middle East and Africa
- 5.4.5. South America
- 5.1. Market Analysis, Insights and Forecast - by Product Type
- 6. North America Personalized Nutrition Market Analysis, Insights and Forecast, 2019-2031
- 6.1. Market Analysis, Insights and Forecast - by Product Type
- 6.1.1. Active Measurement
- 6.1.2. Standard Measurement
- 6.2. Market Analysis, Insights and Forecast - by Application
- 6.2.1. Standard Supplements
- 6.2.2. Disease-based
- 6.3. Market Analysis, Insights and Forecast - by End User
- 6.3.1. Direct-to-Consumer
- 6.3.2. Wellness and Fitness Centers
- 6.3.3. Hospitals and Clinics
- 6.3.4. Research Institutions
- 6.1. Market Analysis, Insights and Forecast - by Product Type
- 7. Europe Personalized Nutrition Market Analysis, Insights and Forecast, 2019-2031
- 7.1. Market Analysis, Insights and Forecast - by Product Type
- 7.1.1. Active Measurement
- 7.1.2. Standard Measurement
- 7.2. Market Analysis, Insights and Forecast - by Application
- 7.2.1. Standard Supplements
- 7.2.2. Disease-based
- 7.3. Market Analysis, Insights and Forecast - by End User
- 7.3.1. Direct-to-Consumer
- 7.3.2. Wellness and Fitness Centers
- 7.3.3. Hospitals and Clinics
- 7.3.4. Research Institutions
- 7.1. Market Analysis, Insights and Forecast - by Product Type
- 8. Asia Pacific Personalized Nutrition Market Analysis, Insights and Forecast, 2019-2031
- 8.1. Market Analysis, Insights and Forecast - by Product Type
- 8.1.1. Active Measurement
- 8.1.2. Standard Measurement
- 8.2. Market Analysis, Insights and Forecast - by Application
- 8.2.1. Standard Supplements
- 8.2.2. Disease-based
- 8.3. Market Analysis, Insights and Forecast - by End User
- 8.3.1. Direct-to-Consumer
- 8.3.2. Wellness and Fitness Centers
- 8.3.3. Hospitals and Clinics
- 8.3.4. Research Institutions
- 8.1. Market Analysis, Insights and Forecast - by Product Type
- 9. Middle East and Africa Personalized Nutrition Market Analysis, Insights and Forecast, 2019-2031
- 9.1. Market Analysis, Insights and Forecast - by Product Type
- 9.1.1. Active Measurement
- 9.1.2. Standard Measurement
- 9.2. Market Analysis, Insights and Forecast - by Application
- 9.2.1. Standard Supplements
- 9.2.2. Disease-based
- 9.3. Market Analysis, Insights and Forecast - by End User
- 9.3.1. Direct-to-Consumer
- 9.3.2. Wellness and Fitness Centers
- 9.3.3. Hospitals and Clinics
- 9.3.4. Research Institutions
- 9.1. Market Analysis, Insights and Forecast - by Product Type
- 10. South America Personalized Nutrition Market Analysis, Insights and Forecast, 2019-2031
- 10.1. Market Analysis, Insights and Forecast - by Product Type
- 10.1.1. Active Measurement
- 10.1.2. Standard Measurement
- 10.2. Market Analysis, Insights and Forecast - by Application
- 10.2.1. Standard Supplements
- 10.2.2. Disease-based
- 10.3. Market Analysis, Insights and Forecast - by End User
- 10.3.1. Direct-to-Consumer
- 10.3.2. Wellness and Fitness Centers
- 10.3.3. Hospitals and Clinics
- 10.3.4. Research Institutions
- 10.1. Market Analysis, Insights and Forecast - by Product Type
- 11. Competitive Analysis
- 11.1. Global Market Share Analysis 2024
- 11.2. Company Profiles
- 11.2.1 Amway Corp
- 11.2.1.1. Overview
- 11.2.1.2. Products
- 11.2.1.3. SWOT Analysis
- 11.2.1.4. Recent Developments
- 11.2.1.5. Financials (Based on Availability)
- 11.2.2 Abbott
- 11.2.2.1. Overview
- 11.2.2.2. Products
- 11.2.2.3. SWOT Analysis
- 11.2.2.4. Recent Developments
- 11.2.2.5. Financials (Based on Availability)
- 11.2.3 Superior Supplement Manufacturing
- 11.2.3.1. Overview
- 11.2.3.2. Products
- 11.2.3.3. SWOT Analysis
- 11.2.3.4. Recent Developments
- 11.2.3.5. Financials (Based on Availability)
- 11.2.4 Herbalife International of America Inc
- 11.2.4.1. Overview
- 11.2.4.2. Products
- 11.2.4.3. SWOT Analysis
- 11.2.4.4. Recent Developments
- 11.2.4.5. Financials (Based on Availability)
- 11.2.5 Metagenics Inc
- 11.2.5.1. Overview
- 11.2.5.2. Products
- 11.2.5.3. SWOT Analysis
- 11.2.5.4. Recent Developments
- 11.2.5.5. Financials (Based on Availability)
- 11.2.6 GX Sciences LLC
- 11.2.6.1. Overview
- 11.2.6.2. Products
- 11.2.6.3. SWOT Analysis
- 11.2.6.4. Recent Developments
- 11.2.6.5. Financials (Based on Availability)
- 11.2.7 Nutralliance
- 11.2.7.1. Overview
- 11.2.7.2. Products
- 11.2.7.3. SWOT Analysis
- 11.2.7.4. Recent Developments
- 11.2.7.5. Financials (Based on Availability)
- 11.2.8 Divine Design Manufacturing
- 11.2.8.1. Overview
- 11.2.8.2. Products
- 11.2.8.3. SWOT Analysis
- 11.2.8.4. Recent Developments
- 11.2.8.5. Financials (Based on Availability)
- 11.2.9 Archer Daniels Midland Company (ADM)
- 11.2.9.1. Overview
- 11.2.9.2. Products
- 11.2.9.3. SWOT Analysis
- 11.2.9.4. Recent Developments
- 11.2.9.5. Financials (Based on Availability)
- 11.2.10 Viome Life Sciences Inc *List Not Exhaustive
- 11.2.10.1. Overview
- 11.2.10.2. Products
- 11.2.10.3. SWOT Analysis
- 11.2.10.4. Recent Developments
- 11.2.10.5. Financials (Based on Availability)
- 11.2.1 Amway Corp
List of Figures
- Figure 1: Global Personalized Nutrition Market Revenue Breakdown (Million, %) by Region 2024 & 2032
- Figure 2: Global Personalized Nutrition Market Volume Breakdown (Billion, %) by Region 2024 & 2032
- Figure 3: North America Personalized Nutrition Market Revenue (Million), by Product Type 2024 & 2032
- Figure 4: North America Personalized Nutrition Market Volume (Billion), by Product Type 2024 & 2032
- Figure 5: North America Personalized Nutrition Market Revenue Share (%), by Product Type 2024 & 2032
- Figure 6: North America Personalized Nutrition Market Volume Share (%), by Product Type 2024 & 2032
- Figure 7: North America Personalized Nutrition Market Revenue (Million), by Application 2024 & 2032
- Figure 8: North America Personalized Nutrition Market Volume (Billion), by Application 2024 & 2032
- Figure 9: North America Personalized Nutrition Market Revenue Share (%), by Application 2024 & 2032
- Figure 10: North America Personalized Nutrition Market Volume Share (%), by Application 2024 & 2032
- Figure 11: North America Personalized Nutrition Market Revenue (Million), by End User 2024 & 2032
- Figure 12: North America Personalized Nutrition Market Volume (Billion), by End User 2024 & 2032
- Figure 13: North America Personalized Nutrition Market Revenue Share (%), by End User 2024 & 2032
- Figure 14: North America Personalized Nutrition Market Volume Share (%), by End User 2024 & 2032
- Figure 15: North America Personalized Nutrition Market Revenue (Million), by Country 2024 & 2032
- Figure 16: North America Personalized Nutrition Market Volume (Billion), by Country 2024 & 2032
- Figure 17: North America Personalized Nutrition Market Revenue Share (%), by Country 2024 & 2032
- Figure 18: North America Personalized Nutrition Market Volume Share (%), by Country 2024 & 2032
- Figure 19: Europe Personalized Nutrition Market Revenue (Million), by Product Type 2024 & 2032
- Figure 20: Europe Personalized Nutrition Market Volume (Billion), by Product Type 2024 & 2032
- Figure 21: Europe Personalized Nutrition Market Revenue Share (%), by Product Type 2024 & 2032
- Figure 22: Europe Personalized Nutrition Market Volume Share (%), by Product Type 2024 & 2032
- Figure 23: Europe Personalized Nutrition Market Revenue (Million), by Application 2024 & 2032
- Figure 24: Europe Personalized Nutrition Market Volume (Billion), by Application 2024 & 2032
- Figure 25: Europe Personalized Nutrition Market Revenue Share (%), by Application 2024 & 2032
- Figure 26: Europe Personalized Nutrition Market Volume Share (%), by Application 2024 & 2032
- Figure 27: Europe Personalized Nutrition Market Revenue (Million), by End User 2024 & 2032
- Figure 28: Europe Personalized Nutrition Market Volume (Billion), by End User 2024 & 2032
- Figure 29: Europe Personalized Nutrition Market Revenue Share (%), by End User 2024 & 2032
- Figure 30: Europe Personalized Nutrition Market Volume Share (%), by End User 2024 & 2032
- Figure 31: Europe Personalized Nutrition Market Revenue (Million), by Country 2024 & 2032
- Figure 32: Europe Personalized Nutrition Market Volume (Billion), by Country 2024 & 2032
- Figure 33: Europe Personalized Nutrition Market Revenue Share (%), by Country 2024 & 2032
- Figure 34: Europe Personalized Nutrition Market Volume Share (%), by Country 2024 & 2032
- Figure 35: Asia Pacific Personalized Nutrition Market Revenue (Million), by Product Type 2024 & 2032
- Figure 36: Asia Pacific Personalized Nutrition Market Volume (Billion), by Product Type 2024 & 2032
- Figure 37: Asia Pacific Personalized Nutrition Market Revenue Share (%), by Product Type 2024 & 2032
- Figure 38: Asia Pacific Personalized Nutrition Market Volume Share (%), by Product Type 2024 & 2032
- Figure 39: Asia Pacific Personalized Nutrition Market Revenue (Million), by Application 2024 & 2032
- Figure 40: Asia Pacific Personalized Nutrition Market Volume (Billion), by Application 2024 & 2032
- Figure 41: Asia Pacific Personalized Nutrition Market Revenue Share (%), by Application 2024 & 2032
- Figure 42: Asia Pacific Personalized Nutrition Market Volume Share (%), by Application 2024 & 2032
- Figure 43: Asia Pacific Personalized Nutrition Market Revenue (Million), by End User 2024 & 2032
- Figure 44: Asia Pacific Personalized Nutrition Market Volume (Billion), by End User 2024 & 2032
- Figure 45: Asia Pacific Personalized Nutrition Market Revenue Share (%), by End User 2024 & 2032
- Figure 46: Asia Pacific Personalized Nutrition Market Volume Share (%), by End User 2024 & 2032
- Figure 47: Asia Pacific Personalized Nutrition Market Revenue (Million), by Country 2024 & 2032
- Figure 48: Asia Pacific Personalized Nutrition Market Volume (Billion), by Country 2024 & 2032
- Figure 49: Asia Pacific Personalized Nutrition Market Revenue Share (%), by Country 2024 & 2032
- Figure 50: Asia Pacific Personalized Nutrition Market Volume Share (%), by Country 2024 & 2032
- Figure 51: Middle East and Africa Personalized Nutrition Market Revenue (Million), by Product Type 2024 & 2032
- Figure 52: Middle East and Africa Personalized Nutrition Market Volume (Billion), by Product Type 2024 & 2032
- Figure 53: Middle East and Africa Personalized Nutrition Market Revenue Share (%), by Product Type 2024 & 2032
- Figure 54: Middle East and Africa Personalized Nutrition Market Volume Share (%), by Product Type 2024 & 2032
- Figure 55: Middle East and Africa Personalized Nutrition Market Revenue (Million), by Application 2024 & 2032
- Figure 56: Middle East and Africa Personalized Nutrition Market Volume (Billion), by Application 2024 & 2032
- Figure 57: Middle East and Africa Personalized Nutrition Market Revenue Share (%), by Application 2024 & 2032
- Figure 58: Middle East and Africa Personalized Nutrition Market Volume Share (%), by Application 2024 & 2032
- Figure 59: Middle East and Africa Personalized Nutrition Market Revenue (Million), by End User 2024 & 2032
- Figure 60: Middle East and Africa Personalized Nutrition Market Volume (Billion), by End User 2024 & 2032
- Figure 61: Middle East and Africa Personalized Nutrition Market Revenue Share (%), by End User 2024 & 2032
- Figure 62: Middle East and Africa Personalized Nutrition Market Volume Share (%), by End User 2024 & 2032
- Figure 63: Middle East and Africa Personalized Nutrition Market Revenue (Million), by Country 2024 & 2032
- Figure 64: Middle East and Africa Personalized Nutrition Market Volume (Billion), by Country 2024 & 2032
- Figure 65: Middle East and Africa Personalized Nutrition Market Revenue Share (%), by Country 2024 & 2032
- Figure 66: Middle East and Africa Personalized Nutrition Market Volume Share (%), by Country 2024 & 2032
- Figure 67: South America Personalized Nutrition Market Revenue (Million), by Product Type 2024 & 2032
- Figure 68: South America Personalized Nutrition Market Volume (Billion), by Product Type 2024 & 2032
- Figure 69: South America Personalized Nutrition Market Revenue Share (%), by Product Type 2024 & 2032
- Figure 70: South America Personalized Nutrition Market Volume Share (%), by Product Type 2024 & 2032
- Figure 71: South America Personalized Nutrition Market Revenue (Million), by Application 2024 & 2032
- Figure 72: South America Personalized Nutrition Market Volume (Billion), by Application 2024 & 2032
- Figure 73: South America Personalized Nutrition Market Revenue Share (%), by Application 2024 & 2032
- Figure 74: South America Personalized Nutrition Market Volume Share (%), by Application 2024 & 2032
- Figure 75: South America Personalized Nutrition Market Revenue (Million), by End User 2024 & 2032
- Figure 76: South America Personalized Nutrition Market Volume (Billion), by End User 2024 & 2032
- Figure 77: South America Personalized Nutrition Market Revenue Share (%), by End User 2024 & 2032
- Figure 78: South America Personalized Nutrition Market Volume Share (%), by End User 2024 & 2032
- Figure 79: South America Personalized Nutrition Market Revenue (Million), by Country 2024 & 2032
- Figure 80: South America Personalized Nutrition Market Volume (Billion), by Country 2024 & 2032
- Figure 81: South America Personalized Nutrition Market Revenue Share (%), by Country 2024 & 2032
- Figure 82: South America Personalized Nutrition Market Volume Share (%), by Country 2024 & 2032
List of Tables
- Table 1: Global Personalized Nutrition Market Revenue Million Forecast, by Region 2019 & 2032
- Table 2: Global Personalized Nutrition Market Volume Billion Forecast, by Region 2019 & 2032
- Table 3: Global Personalized Nutrition Market Revenue Million Forecast, by Product Type 2019 & 2032
- Table 4: Global Personalized Nutrition Market Volume Billion Forecast, by Product Type 2019 & 2032
- Table 5: Global Personalized Nutrition Market Revenue Million Forecast, by Application 2019 & 2032
- Table 6: Global Personalized Nutrition Market Volume Billion Forecast, by Application 2019 & 2032
- Table 7: Global Personalized Nutrition Market Revenue Million Forecast, by End User 2019 & 2032
- Table 8: Global Personalized Nutrition Market Volume Billion Forecast, by End User 2019 & 2032
- Table 9: Global Personalized Nutrition Market Revenue Million Forecast, by Region 2019 & 2032
- Table 10: Global Personalized Nutrition Market Volume Billion Forecast, by Region 2019 & 2032
- Table 11: Global Personalized Nutrition Market Revenue Million Forecast, by Product Type 2019 & 2032
- Table 12: Global Personalized Nutrition Market Volume Billion Forecast, by Product Type 2019 & 2032
- Table 13: Global Personalized Nutrition Market Revenue Million Forecast, by Application 2019 & 2032
- Table 14: Global Personalized Nutrition Market Volume Billion Forecast, by Application 2019 & 2032
- Table 15: Global Personalized Nutrition Market Revenue Million Forecast, by End User 2019 & 2032
- Table 16: Global Personalized Nutrition Market Volume Billion Forecast, by End User 2019 & 2032
- Table 17: Global Personalized Nutrition Market Revenue Million Forecast, by Country 2019 & 2032
- Table 18: Global Personalized Nutrition Market Volume Billion Forecast, by Country 2019 & 2032
- Table 19: United States Personalized Nutrition Market Revenue (Million) Forecast, by Application 2019 & 2032
- Table 20: United States Personalized Nutrition Market Volume (Billion) Forecast, by Application 2019 & 2032
- Table 21: Canada Personalized Nutrition Market Revenue (Million) Forecast, by Application 2019 & 2032
- Table 22: Canada Personalized Nutrition Market Volume (Billion) Forecast, by Application 2019 & 2032
- Table 23: Mexico Personalized Nutrition Market Revenue (Million) Forecast, by Application 2019 & 2032
- Table 24: Mexico Personalized Nutrition Market Volume (Billion) Forecast, by Application 2019 & 2032
- Table 25: Global Personalized Nutrition Market Revenue Million Forecast, by Product Type 2019 & 2032
- Table 26: Global Personalized Nutrition Market Volume Billion Forecast, by Product Type 2019 & 2032
- Table 27: Global Personalized Nutrition Market Revenue Million Forecast, by Application 2019 & 2032
- Table 28: Global Personalized Nutrition Market Volume Billion Forecast, by Application 2019 & 2032
- Table 29: Global Personalized Nutrition Market Revenue Million Forecast, by End User 2019 & 2032
- Table 30: Global Personalized Nutrition Market Volume Billion Forecast, by End User 2019 & 2032
- Table 31: Global Personalized Nutrition Market Revenue Million Forecast, by Country 2019 & 2032
- Table 32: Global Personalized Nutrition Market Volume Billion Forecast, by Country 2019 & 2032
- Table 33: Germany Personalized Nutrition Market Revenue (Million) Forecast, by Application 2019 & 2032
- Table 34: Germany Personalized Nutrition Market Volume (Billion) Forecast, by Application 2019 & 2032
- Table 35: United Kingdom Personalized Nutrition Market Revenue (Million) Forecast, by Application 2019 & 2032
- Table 36: United Kingdom Personalized Nutrition Market Volume (Billion) Forecast, by Application 2019 & 2032
- Table 37: France Personalized Nutrition Market Revenue (Million) Forecast, by Application 2019 & 2032
- Table 38: France Personalized Nutrition Market Volume (Billion) Forecast, by Application 2019 & 2032
- Table 39: Italy Personalized Nutrition Market Revenue (Million) Forecast, by Application 2019 & 2032
- Table 40: Italy Personalized Nutrition Market Volume (Billion) Forecast, by Application 2019 & 2032
- Table 41: Spain Personalized Nutrition Market Revenue (Million) Forecast, by Application 2019 & 2032
- Table 42: Spain Personalized Nutrition Market Volume (Billion) Forecast, by Application 2019 & 2032
- Table 43: Rest of Europe Personalized Nutrition Market Revenue (Million) Forecast, by Application 2019 & 2032
- Table 44: Rest of Europe Personalized Nutrition Market Volume (Billion) Forecast, by Application 2019 & 2032
- Table 45: Global Personalized Nutrition Market Revenue Million Forecast, by Product Type 2019 & 2032
- Table 46: Global Personalized Nutrition Market Volume Billion Forecast, by Product Type 2019 & 2032
- Table 47: Global Personalized Nutrition Market Revenue Million Forecast, by Application 2019 & 2032
- Table 48: Global Personalized Nutrition Market Volume Billion Forecast, by Application 2019 & 2032
- Table 49: Global Personalized Nutrition Market Revenue Million Forecast, by End User 2019 & 2032
- Table 50: Global Personalized Nutrition Market Volume Billion Forecast, by End User 2019 & 2032
- Table 51: Global Personalized Nutrition Market Revenue Million Forecast, by Country 2019 & 2032
- Table 52: Global Personalized Nutrition Market Volume Billion Forecast, by Country 2019 & 2032
- Table 53: China Personalized Nutrition Market Revenue (Million) Forecast, by Application 2019 & 2032
- Table 54: China Personalized Nutrition Market Volume (Billion) Forecast, by Application 2019 & 2032
- Table 55: Japan Personalized Nutrition Market Revenue (Million) Forecast, by Application 2019 & 2032
- Table 56: Japan Personalized Nutrition Market Volume (Billion) Forecast, by Application 2019 & 2032
- Table 57: India Personalized Nutrition Market Revenue (Million) Forecast, by Application 2019 & 2032
- Table 58: India Personalized Nutrition Market Volume (Billion) Forecast, by Application 2019 & 2032
- Table 59: Australia Personalized Nutrition Market Revenue (Million) Forecast, by Application 2019 & 2032
- Table 60: Australia Personalized Nutrition Market Volume (Billion) Forecast, by Application 2019 & 2032
- Table 61: South Korea Personalized Nutrition Market Revenue (Million) Forecast, by Application 2019 & 2032
- Table 62: South Korea Personalized Nutrition Market Volume (Billion) Forecast, by Application 2019 & 2032
- Table 63: Rest of Asia Pacific Personalized Nutrition Market Revenue (Million) Forecast, by Application 2019 & 2032
- Table 64: Rest of Asia Pacific Personalized Nutrition Market Volume (Billion) Forecast, by Application 2019 & 2032
- Table 65: Global Personalized Nutrition Market Revenue Million Forecast, by Product Type 2019 & 2032
- Table 66: Global Personalized Nutrition Market Volume Billion Forecast, by Product Type 2019 & 2032
- Table 67: Global Personalized Nutrition Market Revenue Million Forecast, by Application 2019 & 2032
- Table 68: Global Personalized Nutrition Market Volume Billion Forecast, by Application 2019 & 2032
- Table 69: Global Personalized Nutrition Market Revenue Million Forecast, by End User 2019 & 2032
- Table 70: Global Personalized Nutrition Market Volume Billion Forecast, by End User 2019 & 2032
- Table 71: Global Personalized Nutrition Market Revenue Million Forecast, by Country 2019 & 2032
- Table 72: Global Personalized Nutrition Market Volume Billion Forecast, by Country 2019 & 2032
- Table 73: GCC Personalized Nutrition Market Revenue (Million) Forecast, by Application 2019 & 2032
- Table 74: GCC Personalized Nutrition Market Volume (Billion) Forecast, by Application 2019 & 2032
- Table 75: South Africa Personalized Nutrition Market Revenue (Million) Forecast, by Application 2019 & 2032
- Table 76: South Africa Personalized Nutrition Market Volume (Billion) Forecast, by Application 2019 & 2032
- Table 77: Rest of Middle East and Africa Personalized Nutrition Market Revenue (Million) Forecast, by Application 2019 & 2032
- Table 78: Rest of Middle East and Africa Personalized Nutrition Market Volume (Billion) Forecast, by Application 2019 & 2032
- Table 79: Global Personalized Nutrition Market Revenue Million Forecast, by Product Type 2019 & 2032
- Table 80: Global Personalized Nutrition Market Volume Billion Forecast, by Product Type 2019 & 2032
- Table 81: Global Personalized Nutrition Market Revenue Million Forecast, by Application 2019 & 2032
- Table 82: Global Personalized Nutrition Market Volume Billion Forecast, by Application 2019 & 2032
- Table 83: Global Personalized Nutrition Market Revenue Million Forecast, by End User 2019 & 2032
- Table 84: Global Personalized Nutrition Market Volume Billion Forecast, by End User 2019 & 2032
- Table 85: Global Personalized Nutrition Market Revenue Million Forecast, by Country 2019 & 2032
- Table 86: Global Personalized Nutrition Market Volume Billion Forecast, by Country 2019 & 2032
- Table 87: Brazil Personalized Nutrition Market Revenue (Million) Forecast, by Application 2019 & 2032
- Table 88: Brazil Personalized Nutrition Market Volume (Billion) Forecast, by Application 2019 & 2032
- Table 89: Argentina Personalized Nutrition Market Revenue (Million) Forecast, by Application 2019 & 2032
- Table 90: Argentina Personalized Nutrition Market Volume (Billion) Forecast, by Application 2019 & 2032
- Table 91: Rest of South America Personalized Nutrition Market Revenue (Million) Forecast, by Application 2019 & 2032
- Table 92: Rest of South America Personalized Nutrition Market Volume (Billion) Forecast, by Application 2019 & 2032
Frequently Asked Questions
1. What is the projected Compound Annual Growth Rate (CAGR) of the Personalized Nutrition Market?
The projected CAGR is approximately 14.34%.
2. Which companies are prominent players in the Personalized Nutrition Market?
Key companies in the market include Amway Corp, Abbott, Superior Supplement Manufacturing, Herbalife International of America Inc, Metagenics Inc, GX Sciences LLC, Nutralliance, Divine Design Manufacturing, Archer Daniels Midland Company (ADM), Viome Life Sciences Inc *List Not Exhaustive.
3. What are the main segments of the Personalized Nutrition Market?
The market segments include Product Type, Application, End User.
4. Can you provide details about the market size?
The market size is estimated to be USD 14.27 Million as of 2022.
5. What are some drivers contributing to market growth?
Shift in Consumer Preference Due to a Rise in Health Awareness; Increasing Burden of Chronic Diseases and Geriatric Population; Technological Advancements and Growing Trend of Digital Healthcare.
6. What are the notable trends driving market growth?
Disease-based Segment Expected to Hold a Significant Share Over the Forecast Period.
7. Are there any restraints impacting market growth?
Shift in Consumer Preference Due to a Rise in Health Awareness; Increasing Burden of Chronic Diseases and Geriatric Population; Technological Advancements and Growing Trend of Digital Healthcare.
8. Can you provide examples of recent developments in the market?
September 2024: Bioniq announced its partnership with healthcare reimbursement and HSA/FSA spending solution Truemed. This partnership signifies that Bioniq’s unique pharmaceutical-grade nutritional supplements can be medically necessary, allowing for HSA and FSA to spend on the preventative healthcare routine.February 2024: Riise, a Berlin-based supplement startup, introduced its personalized microgranule nutrient blends, catering to individual nutritional needs and health objectives, thus eliminating the necessity for multiple pills and capsules.
9. What pricing options are available for accessing the report?
Pricing options include single-user, multi-user, and enterprise licenses priced at USD 4750, USD 5250, and USD 8750 respectively.
10. Is the market size provided in terms of value or volume?
The market size is provided in terms of value, measured in Million and volume, measured in Billion.
11. Are there any specific market keywords associated with the report?
Yes, the market keyword associated with the report is "Personalized Nutrition Market," which aids in identifying and referencing the specific market segment covered.
12. How do I determine which pricing option suits my needs best?
The pricing options vary based on user requirements and access needs. Individual users may opt for single-user licenses, while businesses requiring broader access may choose multi-user or enterprise licenses for cost-effective access to the report.
13. Are there any additional resources or data provided in the Personalized Nutrition Market report?
While the report offers comprehensive insights, it's advisable to review the specific contents or supplementary materials provided to ascertain if additional resources or data are available.
14. How can I stay updated on further developments or reports in the Personalized Nutrition Market?
To stay informed about further developments, trends, and reports in the Personalized Nutrition Market, consider subscribing to industry newsletters, following relevant companies and organizations, or regularly checking reputable industry news sources and publications.
Methodology
Step 1 - Identification of Relevant Samples Size from Population Database


Step 2 - Approaches for Defining Global Market Size (Value, Volume* & Price*)

Note*: In applicable scenarios
Step 3 - Data Sources
Primary Research
- Web Analytics
- Survey Reports
- Research Institute
- Latest Research Reports
- Opinion Leaders
Secondary Research
- Annual Reports
- White Paper
- Latest Press Release
- Industry Association
- Paid Database
- Investor Presentations

Step 4 - Data Triangulation
Involves using different sources of information in order to increase the validity of a study
These sources are likely to be stakeholders in a program - participants, other researchers, program staff, other community members, and so on.
Then we put all data in single framework & apply various statistical tools to find out the dynamic on the market.
During the analysis stage, feedback from the stakeholder groups would be compared to determine areas of agreement as well as areas of divergence


