


Key Insights
The global PET bottles market, exhibiting a robust CAGR of 6.80%, is poised for significant growth from 2025 to 2033. Driven by the burgeoning beverage industry, particularly the increasing demand for carbonated soft drinks, juices, and bottled water, the market is experiencing strong expansion. Further fueling this growth are the rising disposable incomes in emerging economies and the convenience associated with PET bottles for consumers. The food and personal care sectors also contribute substantially to market demand, with PET bottles preferred for their lightweight, shatter-resistant, and recyclable nature. However, environmental concerns surrounding plastic waste and the fluctuating price of raw materials (petroleum) present key challenges to market expansion. Innovation in sustainable packaging solutions, such as biodegradable PET alternatives and increased recycling initiatives, are crucial in mitigating these restraints. The market is segmented by end-user vertical (beverages, food, personal care, household care, pharmaceuticals, and others), with beverages dominating the market share. Geographically, North America and Asia-Pacific are projected to lead the market, driven by high consumption levels and robust manufacturing capacities. Market players are focusing on developing advanced technologies and efficient production processes to maintain a competitive edge, including lightweighting designs to reduce material usage and improve recyclability.
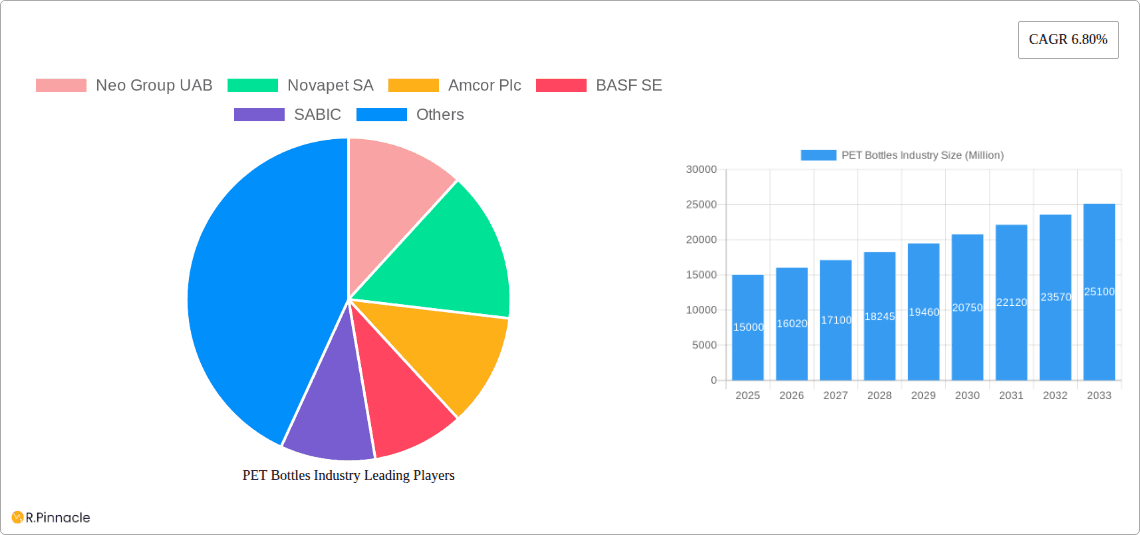
PET Bottles Industry Market Size (In Billion)

The competitive landscape is characterized by both large multinational corporations and regional players. Companies such as Amcor Plc, BASF SE, and Berry Global Inc. hold significant market share due to their extensive production capacity, strong distribution networks, and established brand recognition. However, smaller companies are actively participating in niche segments, often specializing in customized solutions or sustainable packaging options. The ongoing focus on product innovation, strategic partnerships, and mergers and acquisitions are reshaping the competitive dynamics within the industry. Future growth will depend on overcoming challenges related to sustainability and navigating fluctuating raw material costs while meeting the increasing consumer demand for convenient and reliable packaging. This will require ongoing investment in R&D and a commitment to environmentally responsible practices.

PET Bottles Industry Company Market Share
PET Bottles Industry: A Comprehensive Market Report (2019-2033)
This comprehensive report provides an in-depth analysis of the global PET bottles industry, offering valuable insights for industry professionals, investors, and strategic decision-makers. Spanning the period from 2019 to 2033, with a focus on 2025, this report dissects market dynamics, innovation trends, and future growth potential, revealing crucial opportunities and challenges. The report covers key players such as Neo Group UAB, Novapet SA, Amcor Plc, BASF SE, SABIC, Alpha Packaging, Indorama Ventures Public Company Ltd, Graham Packaging Company Inc, Berry Global Inc, and Plastipak Holdings Inc, among others. The total market size is estimated to reach xx Million by 2033, exhibiting a CAGR of xx%.
PET Bottles Industry Market Structure & Innovation Trends
This section analyzes the competitive landscape of the PET bottles industry, including market concentration, innovation drivers, regulatory frameworks, and M&A activities. The market is moderately concentrated, with top players holding a combined market share of approximately xx%. Key innovation drivers include advancements in lightweighting technologies, recycled PET (rPET) integration, and the development of sustainable packaging solutions. Stringent environmental regulations globally are pushing for increased adoption of rPET. Product substitutes, such as glass and alternative bio-based plastics, pose a competitive threat, although PET retains its dominance due to its cost-effectiveness and recyclability.
- Market Share: Top 5 players hold approximately xx% of the market share.
- M&A Activity: A total of xx Million in M&A deals were recorded between 2019 and 2024 (estimated). The focus has been on expanding production capacity and acquiring specialized technologies.
- End-user Demographics: The beverage industry accounts for the largest share of PET bottle consumption, followed by food and personal care products.
PET Bottles Industry Market Dynamics & Trends
The PET bottles market is experiencing significant growth driven by the increasing demand for packaged beverages and food products globally. The rising disposable income, coupled with changing consumer preferences towards convenience, fuels market expansion. Technological disruptions, including the development of barrier coatings and lighter weight bottles, are enhancing product performance and reducing material costs. The increasing focus on sustainability and circular economy principles is accelerating the adoption of rPET. However, fluctuating raw material prices and environmental concerns pose ongoing challenges. The market demonstrates a projected CAGR of xx% from 2025 to 2033, with market penetration increasing in emerging economies.
Dominant Regions & Segments in PET Bottles Industry
The Asia-Pacific region holds a dominant position in the PET bottles market, driven primarily by rapid economic growth, increasing population, and substantial beverage consumption. China, India, and Southeast Asia are key contributors to this regional dominance. The Beverages segment, particularly carbonated soft drinks and bottled water, accounts for the largest share of PET bottle consumption.
Key Drivers for Asia-Pacific:
- Rapid economic growth and rising disposable incomes.
- Large and growing populations.
- Increasing demand for packaged beverages and food products.
- Favorable government policies supporting the packaging industry.
Dominance Analysis: The strong growth of the beverage industry in Asia-Pacific and the established infrastructure supporting plastic packaging contribute to the region's dominance.
Other significant segments include Food, Personal Care, and Pharmaceuticals, each exhibiting substantial growth potential in different regions based on specific factors like per capita consumption and regulatory changes.
PET Bottles Industry Product Innovations
Recent product innovations have focused on lightweighting, improved barrier properties, and the incorporation of rPET. Companies are increasingly investing in advanced recycling technologies and sustainable materials to meet growing environmental concerns. The market is witnessing a rise in innovative bottle designs that enhance product appeal and convenience. These innovations are crucial for maintaining market competitiveness and satisfying evolving consumer expectations.
Report Scope & Segmentation Analysis
This report segments the PET bottles market by end-user vertical:
- Beverages: This segment is expected to witness substantial growth due to the ongoing popularity of bottled drinks. The competitive landscape is highly fragmented, with numerous regional and global players.
- Food: The food segment is expected to grow steadily, driven by increasing demand for packaged food products. Innovation in barrier technologies is critical in this sector.
- Personal Care: This segment shows consistent growth. The focus is on aesthetics and consumer preference for convenient packaging.
- Household Care: This segment demonstrates a moderate growth rate, with focus on durability and functionality.
- Pharmaceuticals: This segment is driven by the need for safe and tamper-evident packaging. The focus is on maintaining product integrity.
- Other End-user Verticals: This encompasses various applications with smaller market shares but potential for niche growth.
Key Drivers of PET Bottles Industry Growth
The PET bottles industry's growth is propelled by several factors: the rising demand for packaged goods in both developed and emerging economies, advancements in lightweighting technologies that reduce material costs, and the growing focus on rPET utilization to meet sustainability goals. Government regulations promoting recyclable packaging further stimulate market growth.
Challenges in the PET Bottles Industry Sector
The industry faces challenges including fluctuations in raw material prices (PET resin), stringent environmental regulations leading to increased compliance costs, and competition from alternative packaging materials. Supply chain disruptions also pose significant challenges, affecting production and distribution. These factors can impact profitability and market stability.
Emerging Opportunities in PET Bottles Industry
Emerging opportunities lie in the expansion of rPET utilization, the development of bio-based PET alternatives, and the exploration of new applications in specialized packaging segments. The growing demand for sustainable and eco-friendly packaging offers significant potential for growth in the industry.
Leading Players in the PET Bottles Industry Market
Key Developments in PET Bottles Industry
- October 2022: Indorama Ventures launched a new bottle-to-bottle recycling plant in the Philippines, signifying a significant investment in rPET production and furthering its position as a major player in sustainable packaging.
- May 2022: SABIC introduced a new resin made from ocean-bound PET, demonstrating commitment to circular economy principles and innovation in chemical recycling.
Future Outlook for PET Bottles Industry Market
The PET bottles market is poised for continued growth, driven by increasing demand, technological innovation, and a rising focus on sustainability. Opportunities abound for companies that invest in advanced recycling technologies, sustainable materials, and innovative packaging solutions. The market's future hinges on effectively addressing environmental concerns and adapting to evolving consumer preferences.
PET Bottles Industry Segmentation
-
1. End-user Vertical
-
1.1. Beverages
- 1.1.1. Packaged Water
- 1.1.2. Carbonated Soft Drinks
- 1.1.3. Fruit Juice
- 1.1.4. Energy Drinks
- 1.1.5. Other Beverages
- 1.2. Food
- 1.3. Personal Care
- 1.4. Household Care
- 1.5. Pharmaceuticals
- 1.6. Other End-user Verticals
-
1.1. Beverages
PET Bottles Industry Segmentation By Geography
-
1. North America
- 1.1. United States
- 1.2. Canada
-
2. Europe
- 2.1. United Kingdom
- 2.2. Germany
- 2.3. France
- 2.4. Italy
-
3. Asia
- 3.1. China
- 3.2. India
- 3.3. Japan
- 3.4. Australia and New Zealand
-
4. Latin America
- 4.1. Mexico
- 4.2. Brazil
- 4.3. Columbia
-
5. Middle East and Africa
- 5.1. Saudi Arabia
- 5.2. South Africa
- 5.3. United Arab Emirates

PET Bottles Industry Regional Market Share
Geographic Coverage of PET Bottles Industry
PET Bottles Industry REPORT HIGHLIGHTS
| Aspects | Details |
|---|---|
| Study Period | 2020-2034 |
| Base Year | 2025 |
| Estimated Year | 2026 |
| Forecast Period | 2026-2034 |
| Historical Period | 2020-2025 |
| Growth Rate | CAGR of 4.18% from 2020-2034 |
| Segmentation |
|
Table of Contents
- 1. Introduction
- 1.1. Research Scope
- 1.2. Market Segmentation
- 1.3. Research Methodology
- 1.4. Definitions and Assumptions
- 2. Executive Summary
- 2.1. Introduction
- 3. Market Dynamics
- 3.1. Introduction
- 3.2. Market Drivers
- 3.2.1. Increasing Adoption of Lightweight Packaging Methods; Increasing Demand from Bottled-water Industry
- 3.3. Market Restrains
- 3.3.1. Environmental Concerns Regarding Use of Plastics
- 3.4. Market Trends
- 3.4.1. Beverages Segment is Expected to Witness Significant Growth
- 4. Market Factor Analysis
- 4.1. Porters Five Forces
- 4.2. Supply/Value Chain
- 4.3. PESTEL analysis
- 4.4. Market Entropy
- 4.5. Patent/Trademark Analysis
- 5. Global PET Bottles Industry Analysis, Insights and Forecast, 2020-2032
- 5.1. Market Analysis, Insights and Forecast - by End-user Vertical
- 5.1.1. Beverages
- 5.1.1.1. Packaged Water
- 5.1.1.2. Carbonated Soft Drinks
- 5.1.1.3. Fruit Juice
- 5.1.1.4. Energy Drinks
- 5.1.1.5. Other Beverages
- 5.1.2. Food
- 5.1.3. Personal Care
- 5.1.4. Household Care
- 5.1.5. Pharmaceuticals
- 5.1.6. Other End-user Verticals
- 5.1.1. Beverages
- 5.2. Market Analysis, Insights and Forecast - by Region
- 5.2.1. North America
- 5.2.2. Europe
- 5.2.3. Asia
- 5.2.4. Latin America
- 5.2.5. Middle East and Africa
- 5.1. Market Analysis, Insights and Forecast - by End-user Vertical
- 6. North America PET Bottles Industry Analysis, Insights and Forecast, 2020-2032
- 6.1. Market Analysis, Insights and Forecast - by End-user Vertical
- 6.1.1. Beverages
- 6.1.1.1. Packaged Water
- 6.1.1.2. Carbonated Soft Drinks
- 6.1.1.3. Fruit Juice
- 6.1.1.4. Energy Drinks
- 6.1.1.5. Other Beverages
- 6.1.2. Food
- 6.1.3. Personal Care
- 6.1.4. Household Care
- 6.1.5. Pharmaceuticals
- 6.1.6. Other End-user Verticals
- 6.1.1. Beverages
- 6.1. Market Analysis, Insights and Forecast - by End-user Vertical
- 7. Europe PET Bottles Industry Analysis, Insights and Forecast, 2020-2032
- 7.1. Market Analysis, Insights and Forecast - by End-user Vertical
- 7.1.1. Beverages
- 7.1.1.1. Packaged Water
- 7.1.1.2. Carbonated Soft Drinks
- 7.1.1.3. Fruit Juice
- 7.1.1.4. Energy Drinks
- 7.1.1.5. Other Beverages
- 7.1.2. Food
- 7.1.3. Personal Care
- 7.1.4. Household Care
- 7.1.5. Pharmaceuticals
- 7.1.6. Other End-user Verticals
- 7.1.1. Beverages
- 7.1. Market Analysis, Insights and Forecast - by End-user Vertical
- 8. Asia PET Bottles Industry Analysis, Insights and Forecast, 2020-2032
- 8.1. Market Analysis, Insights and Forecast - by End-user Vertical
- 8.1.1. Beverages
- 8.1.1.1. Packaged Water
- 8.1.1.2. Carbonated Soft Drinks
- 8.1.1.3. Fruit Juice
- 8.1.1.4. Energy Drinks
- 8.1.1.5. Other Beverages
- 8.1.2. Food
- 8.1.3. Personal Care
- 8.1.4. Household Care
- 8.1.5. Pharmaceuticals
- 8.1.6. Other End-user Verticals
- 8.1.1. Beverages
- 8.1. Market Analysis, Insights and Forecast - by End-user Vertical
- 9. Latin America PET Bottles Industry Analysis, Insights and Forecast, 2020-2032
- 9.1. Market Analysis, Insights and Forecast - by End-user Vertical
- 9.1.1. Beverages
- 9.1.1.1. Packaged Water
- 9.1.1.2. Carbonated Soft Drinks
- 9.1.1.3. Fruit Juice
- 9.1.1.4. Energy Drinks
- 9.1.1.5. Other Beverages
- 9.1.2. Food
- 9.1.3. Personal Care
- 9.1.4. Household Care
- 9.1.5. Pharmaceuticals
- 9.1.6. Other End-user Verticals
- 9.1.1. Beverages
- 9.1. Market Analysis, Insights and Forecast - by End-user Vertical
- 10. Middle East and Africa PET Bottles Industry Analysis, Insights and Forecast, 2020-2032
- 10.1. Market Analysis, Insights and Forecast - by End-user Vertical
- 10.1.1. Beverages
- 10.1.1.1. Packaged Water
- 10.1.1.2. Carbonated Soft Drinks
- 10.1.1.3. Fruit Juice
- 10.1.1.4. Energy Drinks
- 10.1.1.5. Other Beverages
- 10.1.2. Food
- 10.1.3. Personal Care
- 10.1.4. Household Care
- 10.1.5. Pharmaceuticals
- 10.1.6. Other End-user Verticals
- 10.1.1. Beverages
- 10.1. Market Analysis, Insights and Forecast - by End-user Vertical
- 11. Competitive Analysis
- 11.1. Global Market Share Analysis 2025
- 11.2. Company Profiles
- 11.2.1 Neo Group UAB
- 11.2.1.1. Overview
- 11.2.1.2. Products
- 11.2.1.3. SWOT Analysis
- 11.2.1.4. Recent Developments
- 11.2.1.5. Financials (Based on Availability)
- 11.2.2 Novapet SA
- 11.2.2.1. Overview
- 11.2.2.2. Products
- 11.2.2.3. SWOT Analysis
- 11.2.2.4. Recent Developments
- 11.2.2.5. Financials (Based on Availability)
- 11.2.3 Amcor Plc
- 11.2.3.1. Overview
- 11.2.3.2. Products
- 11.2.3.3. SWOT Analysis
- 11.2.3.4. Recent Developments
- 11.2.3.5. Financials (Based on Availability)
- 11.2.4 BASF SE
- 11.2.4.1. Overview
- 11.2.4.2. Products
- 11.2.4.3. SWOT Analysis
- 11.2.4.4. Recent Developments
- 11.2.4.5. Financials (Based on Availability)
- 11.2.5 SABIC
- 11.2.5.1. Overview
- 11.2.5.2. Products
- 11.2.5.3. SWOT Analysis
- 11.2.5.4. Recent Developments
- 11.2.5.5. Financials (Based on Availability)
- 11.2.6 Alpha Packaging
- 11.2.6.1. Overview
- 11.2.6.2. Products
- 11.2.6.3. SWOT Analysis
- 11.2.6.4. Recent Developments
- 11.2.6.5. Financials (Based on Availability)
- 11.2.7 Indorama Ventures Public Company Ltd
- 11.2.7.1. Overview
- 11.2.7.2. Products
- 11.2.7.3. SWOT Analysis
- 11.2.7.4. Recent Developments
- 11.2.7.5. Financials (Based on Availability)
- 11.2.8 Graham Packaging Company Inc
- 11.2.8.1. Overview
- 11.2.8.2. Products
- 11.2.8.3. SWOT Analysis
- 11.2.8.4. Recent Developments
- 11.2.8.5. Financials (Based on Availability)
- 11.2.9 Berry Global Inc
- 11.2.9.1. Overview
- 11.2.9.2. Products
- 11.2.9.3. SWOT Analysis
- 11.2.9.4. Recent Developments
- 11.2.9.5. Financials (Based on Availability)
- 11.2.10 Plastipak Holdings Inc *List Not Exhaustive
- 11.2.10.1. Overview
- 11.2.10.2. Products
- 11.2.10.3. SWOT Analysis
- 11.2.10.4. Recent Developments
- 11.2.10.5. Financials (Based on Availability)
- 11.2.1 Neo Group UAB
List of Figures
- Figure 1: Global PET Bottles Industry Revenue Breakdown (undefined, %) by Region 2025 & 2033
- Figure 2: North America PET Bottles Industry Revenue (undefined), by End-user Vertical 2025 & 2033
- Figure 3: North America PET Bottles Industry Revenue Share (%), by End-user Vertical 2025 & 2033
- Figure 4: North America PET Bottles Industry Revenue (undefined), by Country 2025 & 2033
- Figure 5: North America PET Bottles Industry Revenue Share (%), by Country 2025 & 2033
- Figure 6: Europe PET Bottles Industry Revenue (undefined), by End-user Vertical 2025 & 2033
- Figure 7: Europe PET Bottles Industry Revenue Share (%), by End-user Vertical 2025 & 2033
- Figure 8: Europe PET Bottles Industry Revenue (undefined), by Country 2025 & 2033
- Figure 9: Europe PET Bottles Industry Revenue Share (%), by Country 2025 & 2033
- Figure 10: Asia PET Bottles Industry Revenue (undefined), by End-user Vertical 2025 & 2033
- Figure 11: Asia PET Bottles Industry Revenue Share (%), by End-user Vertical 2025 & 2033
- Figure 12: Asia PET Bottles Industry Revenue (undefined), by Country 2025 & 2033
- Figure 13: Asia PET Bottles Industry Revenue Share (%), by Country 2025 & 2033
- Figure 14: Latin America PET Bottles Industry Revenue (undefined), by End-user Vertical 2025 & 2033
- Figure 15: Latin America PET Bottles Industry Revenue Share (%), by End-user Vertical 2025 & 2033
- Figure 16: Latin America PET Bottles Industry Revenue (undefined), by Country 2025 & 2033
- Figure 17: Latin America PET Bottles Industry Revenue Share (%), by Country 2025 & 2033
- Figure 18: Middle East and Africa PET Bottles Industry Revenue (undefined), by End-user Vertical 2025 & 2033
- Figure 19: Middle East and Africa PET Bottles Industry Revenue Share (%), by End-user Vertical 2025 & 2033
- Figure 20: Middle East and Africa PET Bottles Industry Revenue (undefined), by Country 2025 & 2033
- Figure 21: Middle East and Africa PET Bottles Industry Revenue Share (%), by Country 2025 & 2033
List of Tables
- Table 1: Global PET Bottles Industry Revenue undefined Forecast, by End-user Vertical 2020 & 2033
- Table 2: Global PET Bottles Industry Revenue undefined Forecast, by Region 2020 & 2033
- Table 3: Global PET Bottles Industry Revenue undefined Forecast, by End-user Vertical 2020 & 2033
- Table 4: Global PET Bottles Industry Revenue undefined Forecast, by Country 2020 & 2033
- Table 5: United States PET Bottles Industry Revenue (undefined) Forecast, by Application 2020 & 2033
- Table 6: Canada PET Bottles Industry Revenue (undefined) Forecast, by Application 2020 & 2033
- Table 7: Global PET Bottles Industry Revenue undefined Forecast, by End-user Vertical 2020 & 2033
- Table 8: Global PET Bottles Industry Revenue undefined Forecast, by Country 2020 & 2033
- Table 9: United Kingdom PET Bottles Industry Revenue (undefined) Forecast, by Application 2020 & 2033
- Table 10: Germany PET Bottles Industry Revenue (undefined) Forecast, by Application 2020 & 2033
- Table 11: France PET Bottles Industry Revenue (undefined) Forecast, by Application 2020 & 2033
- Table 12: Italy PET Bottles Industry Revenue (undefined) Forecast, by Application 2020 & 2033
- Table 13: Global PET Bottles Industry Revenue undefined Forecast, by End-user Vertical 2020 & 2033
- Table 14: Global PET Bottles Industry Revenue undefined Forecast, by Country 2020 & 2033
- Table 15: China PET Bottles Industry Revenue (undefined) Forecast, by Application 2020 & 2033
- Table 16: India PET Bottles Industry Revenue (undefined) Forecast, by Application 2020 & 2033
- Table 17: Japan PET Bottles Industry Revenue (undefined) Forecast, by Application 2020 & 2033
- Table 18: Australia and New Zealand PET Bottles Industry Revenue (undefined) Forecast, by Application 2020 & 2033
- Table 19: Global PET Bottles Industry Revenue undefined Forecast, by End-user Vertical 2020 & 2033
- Table 20: Global PET Bottles Industry Revenue undefined Forecast, by Country 2020 & 2033
- Table 21: Mexico PET Bottles Industry Revenue (undefined) Forecast, by Application 2020 & 2033
- Table 22: Brazil PET Bottles Industry Revenue (undefined) Forecast, by Application 2020 & 2033
- Table 23: Columbia PET Bottles Industry Revenue (undefined) Forecast, by Application 2020 & 2033
- Table 24: Global PET Bottles Industry Revenue undefined Forecast, by End-user Vertical 2020 & 2033
- Table 25: Global PET Bottles Industry Revenue undefined Forecast, by Country 2020 & 2033
- Table 26: Saudi Arabia PET Bottles Industry Revenue (undefined) Forecast, by Application 2020 & 2033
- Table 27: South Africa PET Bottles Industry Revenue (undefined) Forecast, by Application 2020 & 2033
- Table 28: United Arab Emirates PET Bottles Industry Revenue (undefined) Forecast, by Application 2020 & 2033
Frequently Asked Questions
1. What is the projected Compound Annual Growth Rate (CAGR) of the PET Bottles Industry?
The projected CAGR is approximately 4.18%.
2. Which companies are prominent players in the PET Bottles Industry?
Key companies in the market include Neo Group UAB, Novapet SA, Amcor Plc, BASF SE, SABIC, Alpha Packaging, Indorama Ventures Public Company Ltd, Graham Packaging Company Inc, Berry Global Inc, Plastipak Holdings Inc *List Not Exhaustive.
3. What are the main segments of the PET Bottles Industry?
The market segments include End-user Vertical.
4. Can you provide details about the market size?
The market size is estimated to be USD XXX N/A as of 2022.
5. What are some drivers contributing to market growth?
Increasing Adoption of Lightweight Packaging Methods; Increasing Demand from Bottled-water Industry.
6. What are the notable trends driving market growth?
Beverages Segment is Expected to Witness Significant Growth.
7. Are there any restraints impacting market growth?
Environmental Concerns Regarding Use of Plastics.
8. Can you provide examples of recent developments in the market?
October 2022: Indorama Ventures announced the opening of its PETValue bottle-to-bottle recycling plant in the Philippines in partnership with Coca-Cola Beverages Philippines. The plant is IVL's latest recycled PET plant. This internationally integrated petrochemical company continues to expand its position as one of the world's largest producers of recycled resins for plastic beverage bottles.
9. What pricing options are available for accessing the report?
Pricing options include single-user, multi-user, and enterprise licenses priced at USD 4750, USD 5250, and USD 8750 respectively.
10. Is the market size provided in terms of value or volume?
The market size is provided in terms of value, measured in N/A.
11. Are there any specific market keywords associated with the report?
Yes, the market keyword associated with the report is "PET Bottles Industry," which aids in identifying and referencing the specific market segment covered.
12. How do I determine which pricing option suits my needs best?
The pricing options vary based on user requirements and access needs. Individual users may opt for single-user licenses, while businesses requiring broader access may choose multi-user or enterprise licenses for cost-effective access to the report.
13. Are there any additional resources or data provided in the PET Bottles Industry report?
While the report offers comprehensive insights, it's advisable to review the specific contents or supplementary materials provided to ascertain if additional resources or data are available.
14. How can I stay updated on further developments or reports in the PET Bottles Industry?
To stay informed about further developments, trends, and reports in the PET Bottles Industry, consider subscribing to industry newsletters, following relevant companies and organizations, or regularly checking reputable industry news sources and publications.
Methodology
Step 1 - Identification of Relevant Samples Size from Population Database


Step 2 - Approaches for Defining Global Market Size (Value, Volume* & Price*)

Note*: In applicable scenarios
Step 3 - Data Sources
Primary Research
- Web Analytics
- Survey Reports
- Research Institute
- Latest Research Reports
- Opinion Leaders
Secondary Research
- Annual Reports
- White Paper
- Latest Press Release
- Industry Association
- Paid Database
- Investor Presentations

Step 4 - Data Triangulation
Involves using different sources of information in order to increase the validity of a study
These sources are likely to be stakeholders in a program - participants, other researchers, program staff, other community members, and so on.
Then we put all data in single framework & apply various statistical tools to find out the dynamic on the market.
During the analysis stage, feedback from the stakeholder groups would be compared to determine areas of agreement as well as areas of divergence