

Key Insights
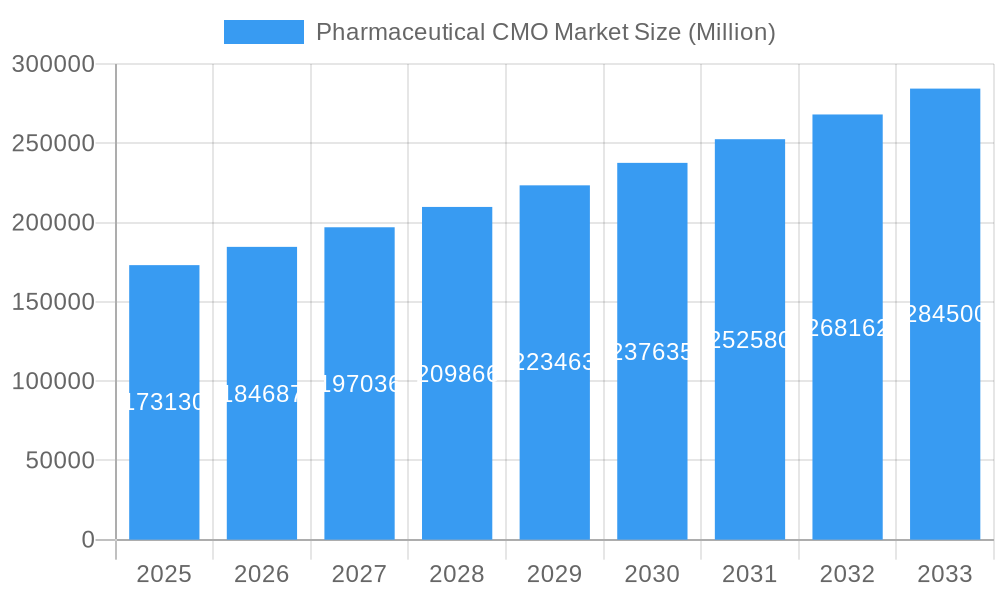
The global Pharmaceutical Contract Manufacturing Organization (CMO) market, valued at $173.13 billion in 2025, is projected to experience robust growth, driven by several key factors. The increasing complexity of drug development, coupled with rising R&D costs, is pushing pharmaceutical companies to outsource manufacturing processes to specialized CMOs. This trend is particularly pronounced for high-potency APIs (HPAPIs) and complex formulations, where specialized expertise and advanced technologies are essential. Furthermore, the growing demand for biologics and personalized medicines is fueling the expansion of the market, as CMOs adapt their capabilities to meet these evolving needs. The market is segmented by service type, encompassing API manufacturing, HPAPI manufacturing, finished dosage formulation (FDF) development and manufacturing across various dosage forms (tablets, capsules, powders, injectables), and secondary packaging services. Geographical expansion, particularly in emerging markets like Asia, is another significant growth driver. However, regulatory hurdles and stringent quality control requirements present challenges for CMOs. The competitive landscape is characterized by a mix of large multinational corporations and smaller specialized firms.
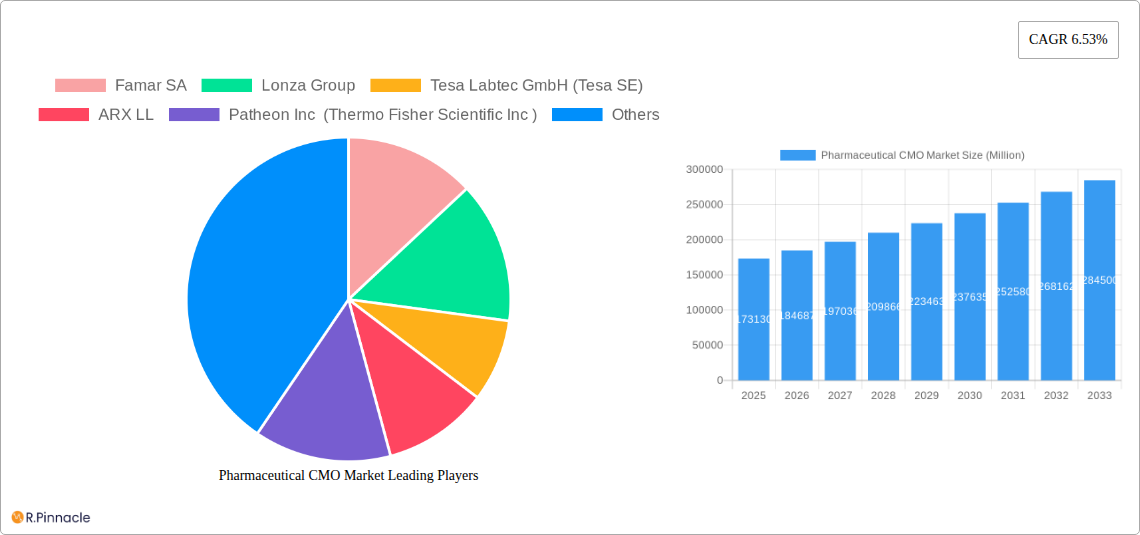
Pharmaceutical CMO Market Market Size (In Billion)
The forecast period of 2025-2033 anticipates a continued expansion of the pharmaceutical CMO market, propelled by sustained growth in drug development and increasing outsourcing trends. The projected CAGR of 6.53% indicates substantial market expansion over the forecast period. Key players like Lonza, Catalent, and Thermo Fisher Scientific are strategically investing in capacity expansion and technological advancements to maintain their market positions. The market will see increasing consolidation through mergers and acquisitions as companies seek to gain scale and access to a broader range of services. Growth will vary across geographical regions, with North America and Europe remaining dominant markets, while Asia-Pacific is expected to witness faster growth fueled by expanding pharmaceutical industries in countries like India and China. Maintaining consistent quality and compliance with regulatory standards will remain crucial for success in this competitive market.
Pharmaceutical CMO Market Company Market Share
Pharmaceutical CMO Market Report: A Comprehensive Analysis (2019-2033)
This in-depth report provides a comprehensive analysis of the Pharmaceutical Contract Manufacturing Organization (CMO) market, offering invaluable insights for industry professionals, investors, and strategic decision-makers. The report covers the period 2019-2033, with a focus on the 2025-2033 forecast period. The market is segmented by service type, providing a granular view of key trends and opportunities within the Active Pharmaceutical Ingredient (API) Manufacturing, High Potency API (HPAPI), Finished Dosage Formulation (FDF), Solid Dose Formulation, Injectable Dose Formulation, and Secondary Packaging sectors. Key players such as Catalent Inc, Lonza Group, and Recipharm AB are analyzed, alongside emerging market dynamics. Expect detailed market sizing (in Millions), CAGR projections, and a deep dive into the competitive landscape.
Pharmaceutical CMO Market Market Structure & Innovation Trends
The Pharmaceutical CMO market exhibits a moderately consolidated structure, with a few large players holding significant market share. Market concentration is influenced by factors such as economies of scale, technological capabilities, and regulatory compliance. The leading companies, including Catalent Inc, Lonza Group, and Recipharm AB, hold an estimated xx% combined market share in 2025, driving significant consolidation in recent years. The total market size in 2025 is estimated at xx Million.
Innovation Drivers:
- Technological advancements in drug delivery systems (e.g., targeted drug delivery).
- Rising demand for complex generics and biosimilars.
- Growing adoption of advanced analytical technologies for quality control.
Regulatory Frameworks:
Stringent regulatory requirements, including GMP (Good Manufacturing Practices) and other quality standards, significantly shape the market landscape. Compliance costs and the need for continuous improvement are crucial factors impacting market dynamics. Recent M&A activity is driven partly by the need for larger companies to improve regulatory capabilities.
Product Substitutes:
Limited direct substitutes exist for CMO services; however, internal manufacturing capabilities within pharmaceutical companies represent indirect competition. This is influenced by factors like company size and budget, with larger pharma companies typically having a larger in-house manufacturing ability.
End-User Demographics:
The end-user base primarily comprises pharmaceutical companies of varying sizes, from large multinational corporations to small and medium-sized enterprises (SMEs). The market is further influenced by the growth and development of biopharmaceutical and biotechnology companies.
M&A Activities:
Significant M&A activity has characterized the market in recent years, driven by the pursuit of scale, technological capabilities, and geographic expansion. Total M&A deal values reached an estimated xx Million in 2024, with an expected value of xx Million for 2025. Consolidation is expected to continue.
Pharmaceutical CMO Market Market Dynamics & Trends
The Pharmaceutical CMO market is experiencing robust growth, driven by several key factors. The market is projected to grow at a CAGR of xx% during the forecast period (2025-2033), reaching a market size of xx Million by 2033. This growth is fueled by the increasing outsourcing of manufacturing processes by pharmaceutical companies, particularly for specialized formulations and complex APIs. The demand for cost optimization and efficient manufacturing capacities further contributes to market expansion.
Technological disruptions, including automation, AI, and advanced analytics, are transforming manufacturing efficiency and product quality. These advancements enhance process optimization, speed drug development, reduce operational costs, and improve production consistency.
Consumer preferences towards innovative drug delivery systems and personalized medicines create a positive market outlook, demanding sophisticated CMO capabilities. Increasing competition in the pharmaceutical industry fuels the trend towards outsourcing to CMOs to gain access to specialized expertise and avoid high capital investments. Furthermore, the increasing complexity of drug development processes fuels the growth of this sector, as specialized CMOs offer the needed capabilities to handle these complex tasks.
Dominant Regions & Segments in Pharmaceutical CMO Market
Dominant Region: North America currently holds the largest market share due to the presence of major pharmaceutical companies and significant investment in R&D. The well-established regulatory framework and robust healthcare infrastructure also contribute to this dominance.
Dominant Segment (By Service Type): The Finished Dosage Formulation (FDF) development and manufacturing segment is currently the dominant segment, driven by the significant demand for various dosage forms.
Key Drivers by Segment:
- Active Pharmaceutical Ingredient (API) Manufacturing: Growing demand for generic drugs and increasing outsourcing of API manufacturing.
- High Potency API (HPAPI): Finished Dosage Formulation (FDF) Development and Manufacturing: Increasing prevalence of complex and potent drugs requiring specialized manufacturing capabilities.
- Solid Dose Formulation: High demand for oral solid dosage forms like tablets and capsules remains a driving factor for this segment.
- Injectable Dose Formulation: Growing demand for injectable drugs for various therapeutic areas contributes to the market expansion.
- Secondary Packaging: Rising demand for customized packaging solutions to meet consumer needs and regulatory requirements.
Detailed Dominance Analysis:
The dominance of North America in the overall market is expected to continue throughout the forecast period. However, other regions like Asia-Pacific are showing accelerated growth due to the increasing presence of pharmaceutical companies and favorable regulatory environments. The demand for FDF will likely remain the most significant driver within the segmentation structure.
Pharmaceutical CMO Market Product Innovations
Recent product innovations in the Pharmaceutical CMO market focus on advanced drug delivery systems, such as innovative formulations that enhance bioavailability, improve patient compliance, and reduce side effects. Technological advancements, such as continuous manufacturing and process analytical technology (PAT), are improving efficiency and reducing costs. These innovations increase the market’s competitiveness, offering pharmaceutical companies improved outcomes and higher quality. Furthermore, the introduction of advanced analytical techniques and technologies are contributing to faster drug development cycles and product optimization.
Report Scope & Segmentation Analysis
This report provides a comprehensive market segmentation analysis by service type:
- Active Pharmaceutical Ingredient (API) Manufacturing: Market size is projected to reach xx Million by 2033, with a CAGR of xx%. Competitive dynamics are shaped by pricing pressures and technology advancements.
- High Potency API (HPAPI): Finished Dosage Formulation (FDF) Development and Manufacturing: Expected to reach xx Million by 2033, with a CAGR of xx%. Stringent regulatory compliance and specialized expertise create high barriers to entry.
- Solid Dose Formulation: Projected to reach xx Million by 2033, with a CAGR of xx%. This segment is influenced by the demand for generic and branded solid-dose formulations.
- Injectable Dose Formulation: Projected to reach xx Million by 2033, with a CAGR of xx%. Growth is driven by the increasing use of biologics and complex injectable drugs.
- Secondary Packaging: Projected to reach xx Million by 2033, with a CAGR of xx%. This market is impacted by evolving packaging technologies and stringent regulatory requirements.
Key Drivers of Pharmaceutical CMO Market Growth
Several factors contribute to the growth of the Pharmaceutical CMO market:
- Increasing outsourcing: Pharmaceutical companies are increasingly outsourcing manufacturing processes to focus on R&D and core competencies.
- Technological advancements: Automation, AI, and advanced analytics are enhancing efficiency and reducing costs.
- Stringent regulatory requirements: Demand for contract manufacturers with strong regulatory compliance capabilities is increasing.
- Rising demand for complex generics and biosimilars: Specialized CMOs with the expertise to manufacture these products are in high demand.
Challenges in the Pharmaceutical CMO Market Sector
The Pharmaceutical CMO market faces certain challenges:
- Regulatory hurdles: Meeting stringent regulatory requirements for GMP and other quality standards can be costly and complex.
- Supply chain issues: Disruptions to the supply chain can impact manufacturing timelines and costs.
- Competitive pressures: The market is becoming increasingly competitive, with both established and new players vying for market share. Price competition can significantly impact profit margins.
Emerging Opportunities in Pharmaceutical CMO Market
Emerging opportunities include:
- Growth in emerging markets: Expansion into emerging markets in Asia and Latin America offers significant growth potential.
- Advancements in drug delivery technologies: CMOs with expertise in advanced drug delivery systems are well-positioned for growth.
- Demand for personalized medicine: CMOs providing services for personalized medicines are anticipated to experience robust growth.
Leading Players in the Pharmaceutical CMO Market Market
- Famar SA
- Lonza Group
- Tesa Labtec GmbH (Tesa SE)
- ARX LL
- Patheon Inc (Thermo Fisher Scientific Inc)
- Pfizer CentreSource (Pfizer Inc)
- Tapemark
- Aenova Holdings GmbH
- Catalent Inc
- Boehringer Ingelheim Group
- Recipharm AB
- Baxter Biopharma Solutions (Baxter International Inc)
- Jubilant Biosys Ltd (Jubilant Pharmova Ltd)
Key Developments in Pharmaceutical CMO Market Industry
- January 2023: Catalent signed a development and license agreement with Ethicann Pharmaceuticals Inc. to develop cannabinoid drug therapies using Zydis ODT technology. This highlights the growing interest in cannabis-based pharmaceuticals and the role of CMOs in their development.
- March 2023: Biose Industria opened a new facility in Boston, Massachusetts, strengthening its presence in the US market and its capabilities in Live Biotech Process Development and Production (LBP). This signifies the expansion of CMO services in the biotech sector.
- July 2023: Recipharm opened a new analytical laboratory in Bangalore, India, increasing its global testing capabilities for nitrosamines, extractables, leachables, and elemental impurities. This demonstrates the increasing importance of quality control and compliance within the CMO industry.
Future Outlook for Pharmaceutical CMO Market Market
The Pharmaceutical CMO market is poised for continued growth, driven by factors such as the increasing outsourcing of pharmaceutical manufacturing, technological advancements in drug delivery systems, and the growing demand for complex and personalized medicines. Strategic partnerships and collaborations between CMOs and pharmaceutical companies will further fuel expansion. The market is expected to continue its consolidation trend, with larger players acquiring smaller companies to expand their service offerings and geographic reach. Investing in advanced technologies and expanding capacity to meet growing demand will be crucial for success in this dynamic market.
Pharmaceutical CMO Market Segmentation
-
1. Service Type
-
1.1. Active P
- 1.1.1. Small Molecule
- 1.1.2. Large Molecule
- 1.1.3. High Potency API (HPAPI)
-
1.2. Finished
-
1.2.1. Solid Dose Formulation
- 1.2.1.1. Tablets
- 1.2.1.2. Other Types (Capsules, Powders, etc.)
- 1.2.2. Liquid Dose Formulation
- 1.2.3. Injectable Dose Formulation
-
1.2.1. Solid Dose Formulation
- 1.3. Secondary Packaging
-
1.1. Active P
Pharmaceutical CMO Market Segmentation By Geography
-
1. North America
- 1.1. United States
- 1.2. Canada
-
2. Europe
- 2.1. United Kingdom
- 2.2. Germany
- 2.3. France
- 2.4. Italy
- 2.5. Spain
-
3. Asia
- 3.1. China
- 3.2. India
- 3.3. Japan
- 3.4. Australia
- 4. Australia and New Zealand
-
5. Latin America
- 5.1. Brazil
- 5.2. Mexico
- 5.3. Argentina
-
6. Middle East and Africa
- 6.1. United Arab Emirates
- 6.2. Saudi Arabia
- 6.3. South Africa
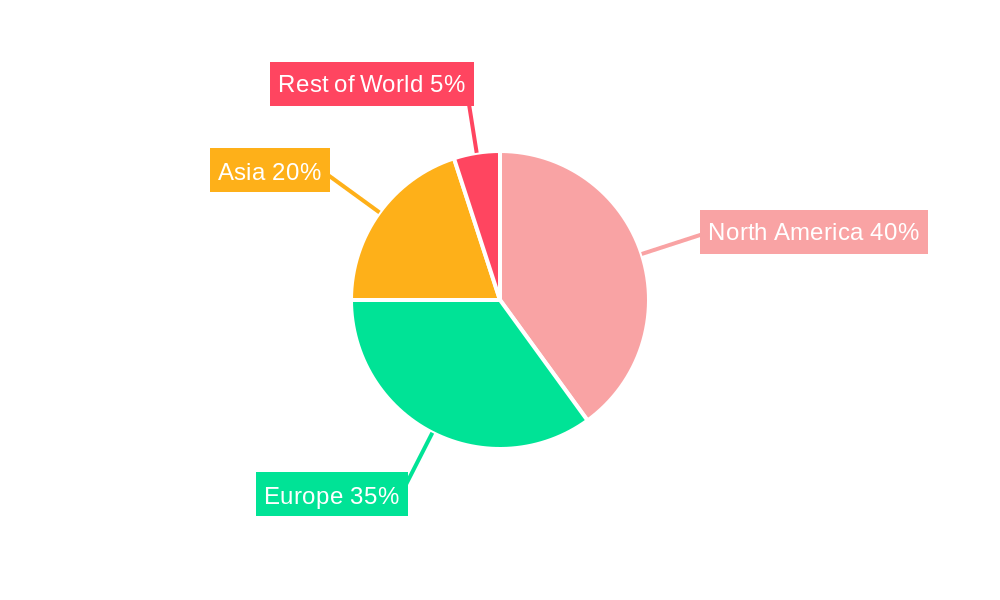
Pharmaceutical CMO Market Regional Market Share
Geographic Coverage of Pharmaceutical CMO Market
Pharmaceutical CMO Market REPORT HIGHLIGHTS
| Aspects | Details |
|---|---|
| Study Period | 2020-2034 |
| Base Year | 2025 |
| Estimated Year | 2026 |
| Forecast Period | 2026-2034 |
| Historical Period | 2020-2025 |
| Growth Rate | CAGR of 6.53% from 2020-2034 |
| Segmentation |
|
Table of Contents
- 1. Introduction
- 1.1. Research Scope
- 1.2. Market Segmentation
- 1.3. Research Objective
- 1.4. Definitions and Assumptions
- 2. Executive Summary
- 2.1. Market Snapshot
- 3. Market Dynamics
- 3.1. Market Drivers
- 3.2. Market Restrains
- 3.3. Market Trends
- 3.4. Market Opportunities
- 4. Market Factor Analysis
- 4.1. Porters Five Forces
- 4.1.1. Bargaining Power of Suppliers
- 4.1.2. Bargaining Power of Buyers
- 4.1.3. Threat of New Entrants
- 4.1.4. Threat of Substitutes
- 4.1.5. Competitive Rivalry
- 4.2. PESTEL analysis
- 4.3. BCG Analysis
- 4.3.1. Stars (High Growth, High Market Share)
- 4.3.2. Cash Cows (Low Growth, High Market Share)
- 4.3.3. Question Mark (High Growth, Low Market Share)
- 4.3.4. Dogs (Low Growth, Low Market Share)
- 4.4. Ansoff Matrix Analysis
- 4.5. Supply Chain Analysis
- 4.6. Regulatory Landscape
- 4.7. Current Market Potential and Opportunity Assessment (TAM–SAM–SOM Framework)
- 4.8. PRI Analyst Note
- 4.1. Porters Five Forces
- 5. Market Analysis, Insights and Forecast 2021-2033
- 5.1. Market Analysis, Insights and Forecast - by Service Type
- 5.1.1. Active P
- 5.1.1.1. Small Molecule
- 5.1.1.2. Large Molecule
- 5.1.1.3. High Potency API (HPAPI)
- 5.1.2. Finished
- 5.1.2.1. Solid Dose Formulation
- 5.1.2.1.1. Tablets
- 5.1.2.1.2. Other Types (Capsules, Powders, etc.)
- 5.1.2.2. Liquid Dose Formulation
- 5.1.2.3. Injectable Dose Formulation
- 5.1.2.1. Solid Dose Formulation
- 5.1.3. Secondary Packaging
- 5.1.1. Active P
- 5.2. Market Analysis, Insights and Forecast - by Region
- 5.2.1. North America
- 5.2.2. Europe
- 5.2.3. Asia
- 5.2.4. Australia and New Zealand
- 5.2.5. Latin America
- 5.2.6. Middle East and Africa
- 5.1. Market Analysis, Insights and Forecast - by Service Type
- 6. Global Pharmaceutical CMO Market Analysis, Insights and Forecast, 2021-2033
- 6.1. Market Analysis, Insights and Forecast - by Service Type
- 6.1.1. Active P
- 6.1.1.1. Small Molecule
- 6.1.1.2. Large Molecule
- 6.1.1.3. High Potency API (HPAPI)
- 6.1.2. Finished
- 6.1.2.1. Solid Dose Formulation
- 6.1.2.1.1. Tablets
- 6.1.2.1.2. Other Types (Capsules, Powders, etc.)
- 6.1.2.2. Liquid Dose Formulation
- 6.1.2.3. Injectable Dose Formulation
- 6.1.2.1. Solid Dose Formulation
- 6.1.3. Secondary Packaging
- 6.1.1. Active P
- 6.1. Market Analysis, Insights and Forecast - by Service Type
- 7. North America Pharmaceutical CMO Market Analysis, Insights and Forecast, 2020-2032
- 7.1. Market Analysis, Insights and Forecast - by Service Type
- 7.1.1. Active P
- 7.1.1.1. Small Molecule
- 7.1.1.2. Large Molecule
- 7.1.1.3. High Potency API (HPAPI)
- 7.1.2. Finished
- 7.1.2.1. Solid Dose Formulation
- 7.1.2.1.1. Tablets
- 7.1.2.1.2. Other Types (Capsules, Powders, etc.)
- 7.1.2.2. Liquid Dose Formulation
- 7.1.2.3. Injectable Dose Formulation
- 7.1.2.1. Solid Dose Formulation
- 7.1.3. Secondary Packaging
- 7.1.1. Active P
- 7.1. Market Analysis, Insights and Forecast - by Service Type
- 8. Europe Pharmaceutical CMO Market Analysis, Insights and Forecast, 2020-2032
- 8.1. Market Analysis, Insights and Forecast - by Service Type
- 8.1.1. Active P
- 8.1.1.1. Small Molecule
- 8.1.1.2. Large Molecule
- 8.1.1.3. High Potency API (HPAPI)
- 8.1.2. Finished
- 8.1.2.1. Solid Dose Formulation
- 8.1.2.1.1. Tablets
- 8.1.2.1.2. Other Types (Capsules, Powders, etc.)
- 8.1.2.2. Liquid Dose Formulation
- 8.1.2.3. Injectable Dose Formulation
- 8.1.2.1. Solid Dose Formulation
- 8.1.3. Secondary Packaging
- 8.1.1. Active P
- 8.1. Market Analysis, Insights and Forecast - by Service Type
- 9. Asia Pharmaceutical CMO Market Analysis, Insights and Forecast, 2020-2032
- 9.1. Market Analysis, Insights and Forecast - by Service Type
- 9.1.1. Active P
- 9.1.1.1. Small Molecule
- 9.1.1.2. Large Molecule
- 9.1.1.3. High Potency API (HPAPI)
- 9.1.2. Finished
- 9.1.2.1. Solid Dose Formulation
- 9.1.2.1.1. Tablets
- 9.1.2.1.2. Other Types (Capsules, Powders, etc.)
- 9.1.2.2. Liquid Dose Formulation
- 9.1.2.3. Injectable Dose Formulation
- 9.1.2.1. Solid Dose Formulation
- 9.1.3. Secondary Packaging
- 9.1.1. Active P
- 9.1. Market Analysis, Insights and Forecast - by Service Type
- 10. Australia and New Zealand Pharmaceutical CMO Market Analysis, Insights and Forecast, 2020-2032
- 10.1. Market Analysis, Insights and Forecast - by Service Type
- 10.1.1. Active P
- 10.1.1.1. Small Molecule
- 10.1.1.2. Large Molecule
- 10.1.1.3. High Potency API (HPAPI)
- 10.1.2. Finished
- 10.1.2.1. Solid Dose Formulation
- 10.1.2.1.1. Tablets
- 10.1.2.1.2. Other Types (Capsules, Powders, etc.)
- 10.1.2.2. Liquid Dose Formulation
- 10.1.2.3. Injectable Dose Formulation
- 10.1.2.1. Solid Dose Formulation
- 10.1.3. Secondary Packaging
- 10.1.1. Active P
- 10.1. Market Analysis, Insights and Forecast - by Service Type
- 11. Latin America Pharmaceutical CMO Market Analysis, Insights and Forecast, 2020-2032
- 11.1. Market Analysis, Insights and Forecast - by Service Type
- 11.1.1. Active P
- 11.1.1.1. Small Molecule
- 11.1.1.2. Large Molecule
- 11.1.1.3. High Potency API (HPAPI)
- 11.1.2. Finished
- 11.1.2.1. Solid Dose Formulation
- 11.1.2.1.1. Tablets
- 11.1.2.1.2. Other Types (Capsules, Powders, etc.)
- 11.1.2.2. Liquid Dose Formulation
- 11.1.2.3. Injectable Dose Formulation
- 11.1.2.1. Solid Dose Formulation
- 11.1.3. Secondary Packaging
- 11.1.1. Active P
- 11.1. Market Analysis, Insights and Forecast - by Service Type
- 12. Middle East and Africa Pharmaceutical CMO Market Analysis, Insights and Forecast, 2020-2032
- 12.1. Market Analysis, Insights and Forecast - by Service Type
- 12.1.1. Active P
- 12.1.1.1. Small Molecule
- 12.1.1.2. Large Molecule
- 12.1.1.3. High Potency API (HPAPI)
- 12.1.2. Finished
- 12.1.2.1. Solid Dose Formulation
- 12.1.2.1.1. Tablets
- 12.1.2.1.2. Other Types (Capsules, Powders, etc.)
- 12.1.2.2. Liquid Dose Formulation
- 12.1.2.3. Injectable Dose Formulation
- 12.1.2.1. Solid Dose Formulation
- 12.1.3. Secondary Packaging
- 12.1.1. Active P
- 12.1. Market Analysis, Insights and Forecast - by Service Type
- 13. Competitive Analysis
- 13.1. Company Profiles
- 13.1.1 Famar SA
- 13.1.1.1. Company Overview
- 13.1.1.2. Products
- 13.1.1.3. Company Financials
- 13.1.1.4. SWOT Analysis
- 13.1.2 Lonza Group
- 13.1.2.1. Company Overview
- 13.1.2.2. Products
- 13.1.2.3. Company Financials
- 13.1.2.4. SWOT Analysis
- 13.1.3 Tesa Labtec GmbH (Tesa SE)
- 13.1.3.1. Company Overview
- 13.1.3.2. Products
- 13.1.3.3. Company Financials
- 13.1.3.4. SWOT Analysis
- 13.1.4 ARX LL
- 13.1.4.1. Company Overview
- 13.1.4.2. Products
- 13.1.4.3. Company Financials
- 13.1.4.4. SWOT Analysis
- 13.1.5 Patheon Inc (Thermo Fisher Scientific Inc )
- 13.1.5.1. Company Overview
- 13.1.5.2. Products
- 13.1.5.3. Company Financials
- 13.1.5.4. SWOT Analysis
- 13.1.6 Pfizer CentreSource (Pfizer Inc )
- 13.1.6.1. Company Overview
- 13.1.6.2. Products
- 13.1.6.3. Company Financials
- 13.1.6.4. SWOT Analysis
- 13.1.7 Tapemark
- 13.1.7.1. Company Overview
- 13.1.7.2. Products
- 13.1.7.3. Company Financials
- 13.1.7.4. SWOT Analysis
- 13.1.8 Aenova Holdings GmbH
- 13.1.8.1. Company Overview
- 13.1.8.2. Products
- 13.1.8.3. Company Financials
- 13.1.8.4. SWOT Analysis
- 13.1.9 Catalent Inc
- 13.1.9.1. Company Overview
- 13.1.9.2. Products
- 13.1.9.3. Company Financials
- 13.1.9.4. SWOT Analysis
- 13.1.10 Boehringer Ingelheim Group
- 13.1.10.1. Company Overview
- 13.1.10.2. Products
- 13.1.10.3. Company Financials
- 13.1.10.4. SWOT Analysis
- 13.1.11 Recipharm AB
- 13.1.11.1. Company Overview
- 13.1.11.2. Products
- 13.1.11.3. Company Financials
- 13.1.11.4. SWOT Analysis
- 13.1.12 Baxter Biopharma Solutions (Baxter International Inc )
- 13.1.12.1. Company Overview
- 13.1.12.2. Products
- 13.1.12.3. Company Financials
- 13.1.12.4. SWOT Analysis
- 13.1.13 Jubilant Biosys Ltd (Jubilant Pharmova Ltd)
- 13.1.13.1. Company Overview
- 13.1.13.2. Products
- 13.1.13.3. Company Financials
- 13.1.13.4. SWOT Analysis
- 13.1.1 Famar SA
- 13.2. Market Entropy
- 13.2.1 Company's Key Areas Served
- 13.2.2 Recent Developments
- 13.3. Company Market Share Analysis 2025
- 13.3.1 Top 5 Companies Market Share Analysis
- 13.3.2 Top 3 Companies Market Share Analysis
- 13.4. List of Potential Customers
- 14. Research Methodology
List of Figures
- Figure 1: Global Pharmaceutical CMO Market Revenue Breakdown (Million, %) by Region 2025 & 2033
- Figure 2: North America Pharmaceutical CMO Market Revenue (Million), by Service Type 2025 & 2033
- Figure 3: North America Pharmaceutical CMO Market Revenue Share (%), by Service Type 2025 & 2033
- Figure 4: North America Pharmaceutical CMO Market Revenue (Million), by Country 2025 & 2033
- Figure 5: North America Pharmaceutical CMO Market Revenue Share (%), by Country 2025 & 2033
- Figure 6: Europe Pharmaceutical CMO Market Revenue (Million), by Service Type 2025 & 2033
- Figure 7: Europe Pharmaceutical CMO Market Revenue Share (%), by Service Type 2025 & 2033
- Figure 8: Europe Pharmaceutical CMO Market Revenue (Million), by Country 2025 & 2033
- Figure 9: Europe Pharmaceutical CMO Market Revenue Share (%), by Country 2025 & 2033
- Figure 10: Asia Pharmaceutical CMO Market Revenue (Million), by Service Type 2025 & 2033
- Figure 11: Asia Pharmaceutical CMO Market Revenue Share (%), by Service Type 2025 & 2033
- Figure 12: Asia Pharmaceutical CMO Market Revenue (Million), by Country 2025 & 2033
- Figure 13: Asia Pharmaceutical CMO Market Revenue Share (%), by Country 2025 & 2033
- Figure 14: Australia and New Zealand Pharmaceutical CMO Market Revenue (Million), by Service Type 2025 & 2033
- Figure 15: Australia and New Zealand Pharmaceutical CMO Market Revenue Share (%), by Service Type 2025 & 2033
- Figure 16: Australia and New Zealand Pharmaceutical CMO Market Revenue (Million), by Country 2025 & 2033
- Figure 17: Australia and New Zealand Pharmaceutical CMO Market Revenue Share (%), by Country 2025 & 2033
- Figure 18: Latin America Pharmaceutical CMO Market Revenue (Million), by Service Type 2025 & 2033
- Figure 19: Latin America Pharmaceutical CMO Market Revenue Share (%), by Service Type 2025 & 2033
- Figure 20: Latin America Pharmaceutical CMO Market Revenue (Million), by Country 2025 & 2033
- Figure 21: Latin America Pharmaceutical CMO Market Revenue Share (%), by Country 2025 & 2033
- Figure 22: Middle East and Africa Pharmaceutical CMO Market Revenue (Million), by Service Type 2025 & 2033
- Figure 23: Middle East and Africa Pharmaceutical CMO Market Revenue Share (%), by Service Type 2025 & 2033
- Figure 24: Middle East and Africa Pharmaceutical CMO Market Revenue (Million), by Country 2025 & 2033
- Figure 25: Middle East and Africa Pharmaceutical CMO Market Revenue Share (%), by Country 2025 & 2033
List of Tables
- Table 1: Global Pharmaceutical CMO Market Revenue Million Forecast, by Service Type 2020 & 2033
- Table 2: Global Pharmaceutical CMO Market Revenue Million Forecast, by Region 2020 & 2033
- Table 3: Global Pharmaceutical CMO Market Revenue Million Forecast, by Service Type 2020 & 2033
- Table 4: Global Pharmaceutical CMO Market Revenue Million Forecast, by Country 2020 & 2033
- Table 5: United States Pharmaceutical CMO Market Revenue (Million) Forecast, by Application 2020 & 2033
- Table 6: Canada Pharmaceutical CMO Market Revenue (Million) Forecast, by Application 2020 & 2033
- Table 7: Global Pharmaceutical CMO Market Revenue Million Forecast, by Service Type 2020 & 2033
- Table 8: Global Pharmaceutical CMO Market Revenue Million Forecast, by Country 2020 & 2033
- Table 9: United Kingdom Pharmaceutical CMO Market Revenue (Million) Forecast, by Application 2020 & 2033
- Table 10: Germany Pharmaceutical CMO Market Revenue (Million) Forecast, by Application 2020 & 2033
- Table 11: France Pharmaceutical CMO Market Revenue (Million) Forecast, by Application 2020 & 2033
- Table 12: Italy Pharmaceutical CMO Market Revenue (Million) Forecast, by Application 2020 & 2033
- Table 13: Spain Pharmaceutical CMO Market Revenue (Million) Forecast, by Application 2020 & 2033
- Table 14: Global Pharmaceutical CMO Market Revenue Million Forecast, by Service Type 2020 & 2033
- Table 15: Global Pharmaceutical CMO Market Revenue Million Forecast, by Country 2020 & 2033
- Table 16: China Pharmaceutical CMO Market Revenue (Million) Forecast, by Application 2020 & 2033
- Table 17: India Pharmaceutical CMO Market Revenue (Million) Forecast, by Application 2020 & 2033
- Table 18: Japan Pharmaceutical CMO Market Revenue (Million) Forecast, by Application 2020 & 2033
- Table 19: Australia Pharmaceutical CMO Market Revenue (Million) Forecast, by Application 2020 & 2033
- Table 20: Global Pharmaceutical CMO Market Revenue Million Forecast, by Service Type 2020 & 2033
- Table 21: Global Pharmaceutical CMO Market Revenue Million Forecast, by Country 2020 & 2033
- Table 22: Global Pharmaceutical CMO Market Revenue Million Forecast, by Service Type 2020 & 2033
- Table 23: Global Pharmaceutical CMO Market Revenue Million Forecast, by Country 2020 & 2033
- Table 24: Brazil Pharmaceutical CMO Market Revenue (Million) Forecast, by Application 2020 & 2033
- Table 25: Mexico Pharmaceutical CMO Market Revenue (Million) Forecast, by Application 2020 & 2033
- Table 26: Argentina Pharmaceutical CMO Market Revenue (Million) Forecast, by Application 2020 & 2033
- Table 27: Global Pharmaceutical CMO Market Revenue Million Forecast, by Service Type 2020 & 2033
- Table 28: Global Pharmaceutical CMO Market Revenue Million Forecast, by Country 2020 & 2033
- Table 29: United Arab Emirates Pharmaceutical CMO Market Revenue (Million) Forecast, by Application 2020 & 2033
- Table 30: Saudi Arabia Pharmaceutical CMO Market Revenue (Million) Forecast, by Application 2020 & 2033
- Table 31: South Africa Pharmaceutical CMO Market Revenue (Million) Forecast, by Application 2020 & 2033
Frequently Asked Questions
1. What is the projected Compound Annual Growth Rate (CAGR) of the Pharmaceutical CMO Market?
The projected CAGR is approximately 6.53%.
2. Which companies are prominent players in the Pharmaceutical CMO Market?
Key companies in the market include Famar SA, Lonza Group, Tesa Labtec GmbH (Tesa SE), ARX LL, Patheon Inc (Thermo Fisher Scientific Inc ), Pfizer CentreSource (Pfizer Inc ), Tapemark, Aenova Holdings GmbH, Catalent Inc, Boehringer Ingelheim Group, Recipharm AB, Baxter Biopharma Solutions (Baxter International Inc ), Jubilant Biosys Ltd (Jubilant Pharmova Ltd).
3. What are the main segments of the Pharmaceutical CMO Market?
The market segments include Service Type.
4. Can you provide details about the market size?
The market size is estimated to be USD 173.13 Million as of 2022.
5. What are some drivers contributing to market growth?
Increasing Outsourcing Volume by Pharmaceutical Companies; Increasing Investment in Research and Development.
6. What are the notable trends driving market growth?
Active Pharmaceutical Ingredient (API) and Intermediates are Expected to Witness Robust Demand.
7. Are there any restraints impacting market growth?
Increasing Lead Time and Logistics Costs; Stringent Regulatory Requirements; Capacity Utilization Issues Affecting the Profitability of CMOs.
8. Can you provide examples of recent developments in the market?
January 2023: Catalent announced that it had signed a development and license agreement with Ethicann Pharmaceuticals Inc., a Canadian/American specialty pharmaceutical company specializing in creating high-value cannabinoid drug therapies using Zydisorally disintegrating tablet (ODT) technology to advance Ethicann's clinical drug pipeline. Per the agreement, Catalent would use its Zydis technology to develop pharmaceutical products containing cannabidiol (CBD) and tetrahydrocannabinol (THC) for Ethicann's use in clinical trials for various conditions.
9. What pricing options are available for accessing the report?
Pricing options include single-user, multi-user, and enterprise licenses priced at USD 4750, USD 5250, and USD 8750 respectively.
10. Is the market size provided in terms of value or volume?
The market size is provided in terms of value, measured in Million.
11. Are there any specific market keywords associated with the report?
Yes, the market keyword associated with the report is "Pharmaceutical CMO Market," which aids in identifying and referencing the specific market segment covered.
12. How do I determine which pricing option suits my needs best?
The pricing options vary based on user requirements and access needs. Individual users may opt for single-user licenses, while businesses requiring broader access may choose multi-user or enterprise licenses for cost-effective access to the report.
13. Are there any additional resources or data provided in the Pharmaceutical CMO Market report?
While the report offers comprehensive insights, it's advisable to review the specific contents or supplementary materials provided to ascertain if additional resources or data are available.
14. How can I stay updated on further developments or reports in the Pharmaceutical CMO Market?
To stay informed about further developments, trends, and reports in the Pharmaceutical CMO Market, consider subscribing to industry newsletters, following relevant companies and organizations, or regularly checking reputable industry news sources and publications.
Methodology
Step 1 - Identification of Relevant Samples Size from Population Database


Step 2 - Approaches for Defining Global Market Size (Value, Volume* & Price*)

Note*: In applicable scenarios
Step 3 - Data Sources
Primary Research
- Web Analytics
- Survey Reports
- Research Institute
- Latest Research Reports
- Opinion Leaders
Secondary Research
- Annual Reports
- White Paper
- Latest Press Release
- Industry Association
- Paid Database
- Investor Presentations

Step 4 - Data Triangulation
Involves using different sources of information in order to increase the validity of a study
These sources are likely to be stakeholders in a program - participants, other researchers, program staff, other community members, and so on.
Then we put all data in single framework & apply various statistical tools to find out the dynamic on the market.
During the analysis stage, feedback from the stakeholder groups would be compared to determine areas of agreement as well as areas of divergence