
Key Insights
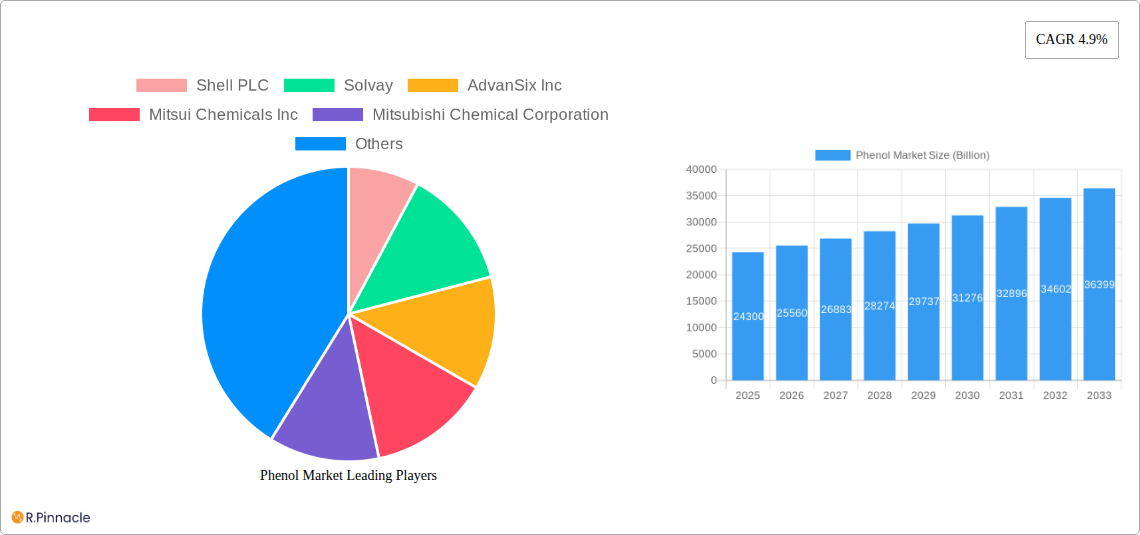
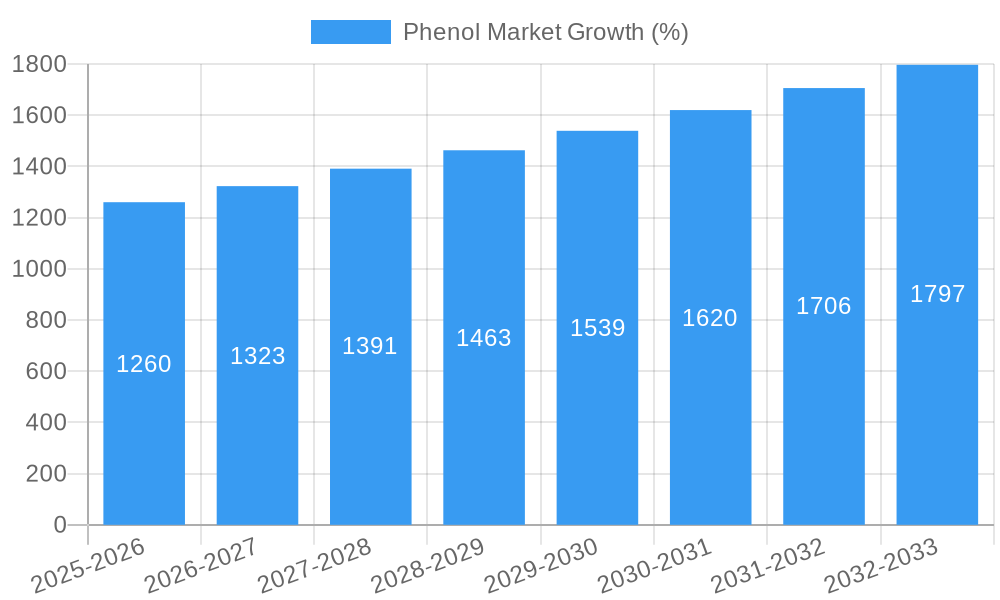
The global phenol market, valued at $24.3 billion in 2025, is projected to experience robust growth, driven by a compound annual growth rate (CAGR) of 4.9% from 2025 to 2033. This expansion is fueled by increasing demand from key downstream industries, particularly in the production of phenolic resins used extensively in construction, automotive, and electrical applications. The rising global population and subsequent infrastructure development projects are significant contributors to this demand surge. Furthermore, the growing adoption of advanced materials in various industries, including aerospace and electronics, further bolsters the market's growth trajectory. The market is segmented by product type, with phenolic resins dominating the landscape due to their versatility and cost-effectiveness. Key players such as Shell PLC, Solvay, and Mitsui Chemicals Inc. are strategically positioned to capitalize on these market trends through investments in research and development, capacity expansions, and strategic partnerships. Geographic growth is expected to be diverse, with Asia-Pacific anticipated to witness significant growth propelled by rapid industrialization and expanding manufacturing sectors in countries like China and India. While the market faces certain restraints, including fluctuating raw material prices and stringent environmental regulations, the overall positive market outlook is expected to prevail in the long term.
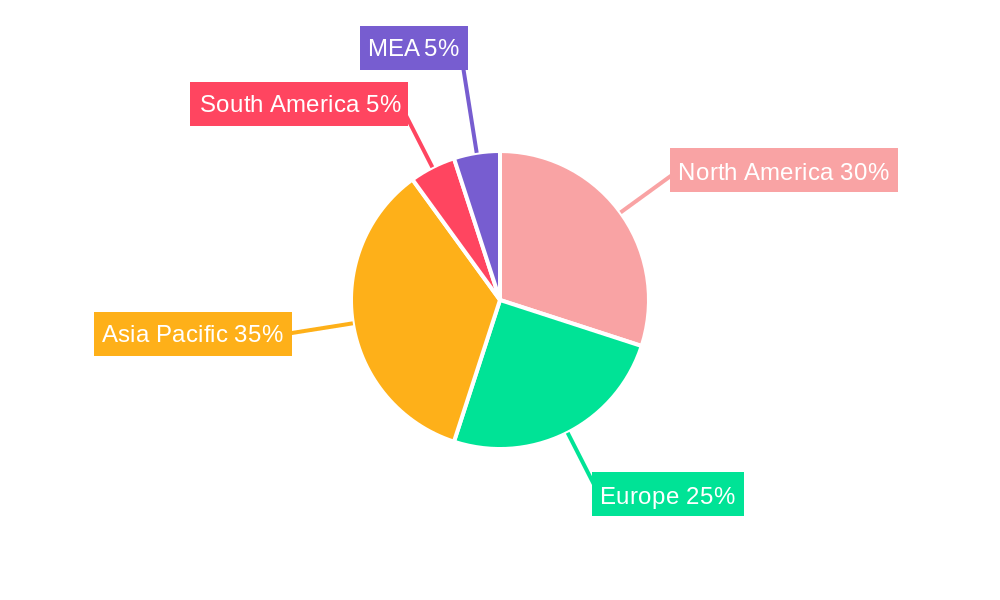
The competitive landscape is characterized by a mix of large multinational corporations and regional players. Companies are actively pursuing strategies such as mergers and acquisitions, capacity expansion, and product diversification to maintain their market share. The adoption of sustainable production practices and the development of innovative phenol-based products are expected to be crucial factors influencing future market growth. North America and Europe currently hold significant market shares, but the Asia-Pacific region is poised to experience the fastest growth, driven by increasing industrialization and economic development. The industry is likely to see increased focus on the development of high-performance phenol-based materials with improved properties, particularly focusing on enhanced sustainability and reduced environmental impact. This will be driven by growing global awareness of environmental concerns and stricter regulations.
Phenol Market Report: A Comprehensive Analysis (2019-2033)
This in-depth report provides a comprehensive analysis of the global Phenol market, offering invaluable insights for industry professionals, investors, and stakeholders. Covering the period from 2019 to 2033, with a focus on 2025, this report unveils the market's structure, dynamics, dominant players, and future trajectory. The market is projected to reach xx Billion by 2033.
Phenol Market Structure & Innovation Trends
This section analyzes the competitive landscape of the Phenol market, focusing on market concentration, innovation drivers, regulatory frameworks, product substitutes, end-user demographics, and M&A activities. The report delves into the market share held by key players like Shell PLC, Solvay, and INEOS Capital Limited, assessing their strategies and market influence. We examine the impact of regulatory changes on market growth and the role of innovation in driving product diversification and market expansion.
- Market Concentration: The report quantifies the market share of the top 5 players, revealing the level of competition and potential for market disruption.
- Innovation Drivers: Analysis covers the role of R&D investments, technological advancements (e.g., sustainable production methods), and consumer demand in shaping market innovation.
- Regulatory Frameworks: The impact of environmental regulations and safety standards on production processes and market access is examined.
- Product Substitutes: The report evaluates the threat posed by substitute materials and their potential impact on market demand.
- M&A Activities: Detailed analysis of recent mergers and acquisitions, including the INEOS Phenol acquisition of Mitsui Phenols Singapore Ltd (USD 330 Million), highlighting their impact on market consolidation and capacity expansion.
Phenol Market Dynamics & Trends
This section provides a detailed analysis of the factors driving Phenol market growth, including technological advancements, evolving consumer preferences, and the competitive dynamics among key players. The report examines market growth drivers, technological disruptions, and consumer preferences, providing a comprehensive understanding of market evolution. The report will project the Compound Annual Growth Rate (CAGR) for the forecast period (2025-2033) and analyze market penetration rates for different product types.
- Market Growth Drivers: Detailed explanation of the factors contributing to market expansion, such as increasing demand from downstream industries.
- Technological Disruptions: The impact of innovations in production technology and sustainable practices is explored, including Cepsa's launch of NextPhenol.
- Consumer Preferences: The report analyzes shifts in consumer preferences and their effect on product demand.
- Competitive Dynamics: Analysis of the competitive strategies employed by leading players, focusing on pricing, product differentiation, and market share.
Dominant Regions & Segments in Phenol Market
This section identifies the leading regions and segments within the Phenol market. The analysis focuses on the performance of different product types: Phenolic Resins, Caprolactum, Bisphenol-A, and Other Product Types, highlighting their market share and growth drivers. The report will determine the leading geographical region and analyze the factors responsible for its dominance.
- Phenolic Resins: Key drivers include growth in construction, automotive, and electronics industries.
- Caprolactum: Analysis focuses on its application in the nylon industry and associated market trends.
- Bisphenol-A (BPA): This section examines the demand for BPA in polycarbonate production and its future outlook.
- Other Product Types: This segment analyzes the market dynamics of less prominent phenol applications.
Detailed analysis of dominant regions (e.g., Asia-Pacific, North America, Europe) will be provided, focusing on economic policies, infrastructure development, and industrial growth as drivers of regional market dominance.
Phenol Market Product Innovations
This section provides a summary of recent product developments, focusing on technological trends and market fit. It analyzes new product applications, and discusses competitive advantages offered by innovative solutions, such as Cepsa's NextPhenol.
Report Scope & Segmentation Analysis
The report provides a detailed overview of the market segmentation based on product type: Phenolic Resins, Caprolactum, Bisphenol-A, and Other Product Types. For each segment, the report provides detailed growth projections, market size estimations, and competitive dynamics. Each segment’s historical data, current market size, future projections, and competitive dynamics are included.
Key Drivers of Phenol Market Growth
This section outlines the key factors driving the growth of the Phenol market. These include technological advancements, favorable economic conditions, and supportive regulatory frameworks. Specific examples are provided to illustrate these factors.
Challenges in the Phenol Market Sector
This section examines the challenges hindering Phenol market growth, such as regulatory hurdles, supply chain disruptions, and competitive pressures. The report quantifies the impact of these challenges.
Emerging Opportunities in Phenol Market
This section highlights emerging opportunities within the Phenol market, focusing on new market segments, technologies, and changing consumer preferences.
Leading Players in the Phenol Market Market
- Shell PLC (Shell PLC)
- Solvay (Solvay)
- AdvanSix Inc (AdvanSix Inc)
- Mitsui Chemicals Inc (Mitsui Chemicals Inc)
- Mitsubishi Chemical Corporation (Mitsubishi Chemical Corporation)
- Cepsa (Cepsa)
- Altivia
- Domo Chemical GmbH (Domo Chemical GmbH)
- PTT Phenol Company Limited
- Formosa Chemicals & Fibre Corp
- INEOS Capital Limited (INEOS Capital Limited)
- Kumho P&B Chemicals Inc
Key Developments in Phenol Market Industry
- August 2022: INEOS Phenol acquired the asset base of Mitsui Phenols Singapore Ltd for USD 330 million, increasing production capacity by 1 million tonnes.
- April 2022: Cepsa launched NextPhenol, a sustainable chemical produced from recycled feedstock.
Future Outlook for Phenol Market Market
This section summarizes the growth accelerators and strategic opportunities within the Phenol market, emphasizing the future market potential and highlighting key areas for future growth. It also explores potential disruptions and their impact on the future of the market.
Phenol Market Segmentation
-
1. Product Type
- 1.1. Phenolic Resins
- 1.2. Caprolactum
- 1.3. Bisphenol-A
- 1.4. Other Product Types
Phenol Market Segmentation By Geography
-
1. Asia Pacific
- 1.1. China
- 1.2. India
- 1.3. Japan
- 1.4. South Korea
- 1.5. Rest of Asia Pacific
-
2. North America
- 2.1. United States
- 2.2. Canada
- 2.3. Mexico
-
3. Europe
- 3.1. Germany
- 3.2. United Kingdom
- 3.3. France
- 3.4. Italy
- 3.5. Rest of Europe
-
4. South America
- 4.1. Brazil
- 4.2. Argentina
- 4.3. Rest of South America
-
5. Middle East and Africa
- 5.1. Saudi Arabia
- 5.2. South Africa
- 5.3. Rest of Middle East and Africa
Phenol Market REPORT HIGHLIGHTS
| Aspects | Details |
|---|---|
| Study Period | 2019-2033 |
| Base Year | 2024 |
| Estimated Year | 2025 |
| Forecast Period | 2025-2033 |
| Historical Period | 2019-2024 |
| Growth Rate | CAGR of 4.9% from 2019-2033 |
| Segmentation |
|
Table of Contents
- 1. Introduction
- 1.1. Research Scope
- 1.2. Market Segmentation
- 1.3. Research Methodology
- 1.4. Definitions and Assumptions
- 2. Executive Summary
- 2.1. Introduction
- 3. Market Dynamics
- 3.1. Introduction
- 3.2. Market Drivers
- 3.2.1. High Demand of Bisphenol-A; Other Drivers
- 3.3. Market Restrains
- 3.3.1. Ban on BPA in the United States and Europe; Others Restraints
- 3.4. Market Trends
- 3.4.1. Bisphenol-A Product Type to Drive the Market
- 4. Market Factor Analysis
- 4.1. Porters Five Forces
- 4.2. Supply/Value Chain
- 4.3. PESTEL analysis
- 4.4. Market Entropy
- 4.5. Patent/Trademark Analysis
- 5. Global Phenol Market Analysis, Insights and Forecast, 2019-2031
- 5.1. Market Analysis, Insights and Forecast - by Product Type
- 5.1.1. Phenolic Resins
- 5.1.2. Caprolactum
- 5.1.3. Bisphenol-A
- 5.1.4. Other Product Types
- 5.2. Market Analysis, Insights and Forecast - by Region
- 5.2.1. Asia Pacific
- 5.2.2. North America
- 5.2.3. Europe
- 5.2.4. South America
- 5.2.5. Middle East and Africa
- 5.1. Market Analysis, Insights and Forecast - by Product Type
- 6. Asia Pacific Phenol Market Analysis, Insights and Forecast, 2019-2031
- 6.1. Market Analysis, Insights and Forecast - by Product Type
- 6.1.1. Phenolic Resins
- 6.1.2. Caprolactum
- 6.1.3. Bisphenol-A
- 6.1.4. Other Product Types
- 6.1. Market Analysis, Insights and Forecast - by Product Type
- 7. North America Phenol Market Analysis, Insights and Forecast, 2019-2031
- 7.1. Market Analysis, Insights and Forecast - by Product Type
- 7.1.1. Phenolic Resins
- 7.1.2. Caprolactum
- 7.1.3. Bisphenol-A
- 7.1.4. Other Product Types
- 7.1. Market Analysis, Insights and Forecast - by Product Type
- 8. Europe Phenol Market Analysis, Insights and Forecast, 2019-2031
- 8.1. Market Analysis, Insights and Forecast - by Product Type
- 8.1.1. Phenolic Resins
- 8.1.2. Caprolactum
- 8.1.3. Bisphenol-A
- 8.1.4. Other Product Types
- 8.1. Market Analysis, Insights and Forecast - by Product Type
- 9. South America Phenol Market Analysis, Insights and Forecast, 2019-2031
- 9.1. Market Analysis, Insights and Forecast - by Product Type
- 9.1.1. Phenolic Resins
- 9.1.2. Caprolactum
- 9.1.3. Bisphenol-A
- 9.1.4. Other Product Types
- 9.1. Market Analysis, Insights and Forecast - by Product Type
- 10. Middle East and Africa Phenol Market Analysis, Insights and Forecast, 2019-2031
- 10.1. Market Analysis, Insights and Forecast - by Product Type
- 10.1.1. Phenolic Resins
- 10.1.2. Caprolactum
- 10.1.3. Bisphenol-A
- 10.1.4. Other Product Types
- 10.1. Market Analysis, Insights and Forecast - by Product Type
- 11. North America Phenol Market Analysis, Insights and Forecast, 2019-2031
- 11.1. Market Analysis, Insights and Forecast - By Country/Sub-region
- 11.1.1 United States
- 11.1.2 Canada
- 11.1.3 Mexico
- 12. Europe Phenol Market Analysis, Insights and Forecast, 2019-2031
- 12.1. Market Analysis, Insights and Forecast - By Country/Sub-region
- 12.1.1 Germany
- 12.1.2 France
- 12.1.3 Italy
- 12.1.4 United Kingdom
- 12.1.5 Netherlands
- 12.1.6 Rest of Europe
- 13. Asia Pacific Phenol Market Analysis, Insights and Forecast, 2019-2031
- 13.1. Market Analysis, Insights and Forecast - By Country/Sub-region
- 13.1.1 China
- 13.1.2 Japan
- 13.1.3 India
- 13.1.4 South Korea
- 13.1.5 Taiwan
- 13.1.6 Australia
- 13.1.7 Rest of Asia-Pacific
- 14. South America Phenol Market Analysis, Insights and Forecast, 2019-2031
- 14.1. Market Analysis, Insights and Forecast - By Country/Sub-region
- 14.1.1 Brazil
- 14.1.2 Argentina
- 14.1.3 Rest of South America
- 15. MEA Phenol Market Analysis, Insights and Forecast, 2019-2031
- 15.1. Market Analysis, Insights and Forecast - By Country/Sub-region
- 15.1.1 Middle East
- 15.1.2 Africa
- 16. Competitive Analysis
- 16.1. Global Market Share Analysis 2024
- 16.2. Company Profiles
- 16.2.1 Shell PLC
- 16.2.1.1. Overview
- 16.2.1.2. Products
- 16.2.1.3. SWOT Analysis
- 16.2.1.4. Recent Developments
- 16.2.1.5. Financials (Based on Availability)
- 16.2.2 Solvay
- 16.2.2.1. Overview
- 16.2.2.2. Products
- 16.2.2.3. SWOT Analysis
- 16.2.2.4. Recent Developments
- 16.2.2.5. Financials (Based on Availability)
- 16.2.3 AdvanSix Inc
- 16.2.3.1. Overview
- 16.2.3.2. Products
- 16.2.3.3. SWOT Analysis
- 16.2.3.4. Recent Developments
- 16.2.3.5. Financials (Based on Availability)
- 16.2.4 Mitsui Chemicals Inc
- 16.2.4.1. Overview
- 16.2.4.2. Products
- 16.2.4.3. SWOT Analysis
- 16.2.4.4. Recent Developments
- 16.2.4.5. Financials (Based on Availability)
- 16.2.5 Mitsubishi Chemical Corporation
- 16.2.5.1. Overview
- 16.2.5.2. Products
- 16.2.5.3. SWOT Analysis
- 16.2.5.4. Recent Developments
- 16.2.5.5. Financials (Based on Availability)
- 16.2.6 Cepsa
- 16.2.6.1. Overview
- 16.2.6.2. Products
- 16.2.6.3. SWOT Analysis
- 16.2.6.4. Recent Developments
- 16.2.6.5. Financials (Based on Availability)
- 16.2.7 Altivia
- 16.2.7.1. Overview
- 16.2.7.2. Products
- 16.2.7.3. SWOT Analysis
- 16.2.7.4. Recent Developments
- 16.2.7.5. Financials (Based on Availability)
- 16.2.8 Domo Chemical GmbH
- 16.2.8.1. Overview
- 16.2.8.2. Products
- 16.2.8.3. SWOT Analysis
- 16.2.8.4. Recent Developments
- 16.2.8.5. Financials (Based on Availability)
- 16.2.9 PTT Phenol Company Limited
- 16.2.9.1. Overview
- 16.2.9.2. Products
- 16.2.9.3. SWOT Analysis
- 16.2.9.4. Recent Developments
- 16.2.9.5. Financials (Based on Availability)
- 16.2.10 Formosa Chemicals & Fibre Corp
- 16.2.10.1. Overview
- 16.2.10.2. Products
- 16.2.10.3. SWOT Analysis
- 16.2.10.4. Recent Developments
- 16.2.10.5. Financials (Based on Availability)
- 16.2.11 INEOS Capital Limited
- 16.2.11.1. Overview
- 16.2.11.2. Products
- 16.2.11.3. SWOT Analysis
- 16.2.11.4. Recent Developments
- 16.2.11.5. Financials (Based on Availability)
- 16.2.12 Kumho P&B Chemicals Inc
- 16.2.12.1. Overview
- 16.2.12.2. Products
- 16.2.12.3. SWOT Analysis
- 16.2.12.4. Recent Developments
- 16.2.12.5. Financials (Based on Availability)
- 16.2.1 Shell PLC
List of Figures
- Figure 1: Global Phenol Market Revenue Breakdown (Billion, %) by Region 2024 & 2032
- Figure 2: Global Phenol Market Volume Breakdown (K Tons, %) by Region 2024 & 2032
- Figure 3: North America Phenol Market Revenue (Billion), by Country 2024 & 2032
- Figure 4: North America Phenol Market Volume (K Tons), by Country 2024 & 2032
- Figure 5: North America Phenol Market Revenue Share (%), by Country 2024 & 2032
- Figure 6: North America Phenol Market Volume Share (%), by Country 2024 & 2032
- Figure 7: Europe Phenol Market Revenue (Billion), by Country 2024 & 2032
- Figure 8: Europe Phenol Market Volume (K Tons), by Country 2024 & 2032
- Figure 9: Europe Phenol Market Revenue Share (%), by Country 2024 & 2032
- Figure 10: Europe Phenol Market Volume Share (%), by Country 2024 & 2032
- Figure 11: Asia Pacific Phenol Market Revenue (Billion), by Country 2024 & 2032
- Figure 12: Asia Pacific Phenol Market Volume (K Tons), by Country 2024 & 2032
- Figure 13: Asia Pacific Phenol Market Revenue Share (%), by Country 2024 & 2032
- Figure 14: Asia Pacific Phenol Market Volume Share (%), by Country 2024 & 2032
- Figure 15: South America Phenol Market Revenue (Billion), by Country 2024 & 2032
- Figure 16: South America Phenol Market Volume (K Tons), by Country 2024 & 2032
- Figure 17: South America Phenol Market Revenue Share (%), by Country 2024 & 2032
- Figure 18: South America Phenol Market Volume Share (%), by Country 2024 & 2032
- Figure 19: MEA Phenol Market Revenue (Billion), by Country 2024 & 2032
- Figure 20: MEA Phenol Market Volume (K Tons), by Country 2024 & 2032
- Figure 21: MEA Phenol Market Revenue Share (%), by Country 2024 & 2032
- Figure 22: MEA Phenol Market Volume Share (%), by Country 2024 & 2032
- Figure 23: Asia Pacific Phenol Market Revenue (Billion), by Product Type 2024 & 2032
- Figure 24: Asia Pacific Phenol Market Volume (K Tons), by Product Type 2024 & 2032
- Figure 25: Asia Pacific Phenol Market Revenue Share (%), by Product Type 2024 & 2032
- Figure 26: Asia Pacific Phenol Market Volume Share (%), by Product Type 2024 & 2032
- Figure 27: Asia Pacific Phenol Market Revenue (Billion), by Country 2024 & 2032
- Figure 28: Asia Pacific Phenol Market Volume (K Tons), by Country 2024 & 2032
- Figure 29: Asia Pacific Phenol Market Revenue Share (%), by Country 2024 & 2032
- Figure 30: Asia Pacific Phenol Market Volume Share (%), by Country 2024 & 2032
- Figure 31: North America Phenol Market Revenue (Billion), by Product Type 2024 & 2032
- Figure 32: North America Phenol Market Volume (K Tons), by Product Type 2024 & 2032
- Figure 33: North America Phenol Market Revenue Share (%), by Product Type 2024 & 2032
- Figure 34: North America Phenol Market Volume Share (%), by Product Type 2024 & 2032
- Figure 35: North America Phenol Market Revenue (Billion), by Country 2024 & 2032
- Figure 36: North America Phenol Market Volume (K Tons), by Country 2024 & 2032
- Figure 37: North America Phenol Market Revenue Share (%), by Country 2024 & 2032
- Figure 38: North America Phenol Market Volume Share (%), by Country 2024 & 2032
- Figure 39: Europe Phenol Market Revenue (Billion), by Product Type 2024 & 2032
- Figure 40: Europe Phenol Market Volume (K Tons), by Product Type 2024 & 2032
- Figure 41: Europe Phenol Market Revenue Share (%), by Product Type 2024 & 2032
- Figure 42: Europe Phenol Market Volume Share (%), by Product Type 2024 & 2032
- Figure 43: Europe Phenol Market Revenue (Billion), by Country 2024 & 2032
- Figure 44: Europe Phenol Market Volume (K Tons), by Country 2024 & 2032
- Figure 45: Europe Phenol Market Revenue Share (%), by Country 2024 & 2032
- Figure 46: Europe Phenol Market Volume Share (%), by Country 2024 & 2032
- Figure 47: South America Phenol Market Revenue (Billion), by Product Type 2024 & 2032
- Figure 48: South America Phenol Market Volume (K Tons), by Product Type 2024 & 2032
- Figure 49: South America Phenol Market Revenue Share (%), by Product Type 2024 & 2032
- Figure 50: South America Phenol Market Volume Share (%), by Product Type 2024 & 2032
- Figure 51: South America Phenol Market Revenue (Billion), by Country 2024 & 2032
- Figure 52: South America Phenol Market Volume (K Tons), by Country 2024 & 2032
- Figure 53: South America Phenol Market Revenue Share (%), by Country 2024 & 2032
- Figure 54: South America Phenol Market Volume Share (%), by Country 2024 & 2032
- Figure 55: Middle East and Africa Phenol Market Revenue (Billion), by Product Type 2024 & 2032
- Figure 56: Middle East and Africa Phenol Market Volume (K Tons), by Product Type 2024 & 2032
- Figure 57: Middle East and Africa Phenol Market Revenue Share (%), by Product Type 2024 & 2032
- Figure 58: Middle East and Africa Phenol Market Volume Share (%), by Product Type 2024 & 2032
- Figure 59: Middle East and Africa Phenol Market Revenue (Billion), by Country 2024 & 2032
- Figure 60: Middle East and Africa Phenol Market Volume (K Tons), by Country 2024 & 2032
- Figure 61: Middle East and Africa Phenol Market Revenue Share (%), by Country 2024 & 2032
- Figure 62: Middle East and Africa Phenol Market Volume Share (%), by Country 2024 & 2032
List of Tables
- Table 1: Global Phenol Market Revenue Billion Forecast, by Region 2019 & 2032
- Table 2: Global Phenol Market Volume K Tons Forecast, by Region 2019 & 2032
- Table 3: Global Phenol Market Revenue Billion Forecast, by Product Type 2019 & 2032
- Table 4: Global Phenol Market Volume K Tons Forecast, by Product Type 2019 & 2032
- Table 5: Global Phenol Market Revenue Billion Forecast, by Region 2019 & 2032
- Table 6: Global Phenol Market Volume K Tons Forecast, by Region 2019 & 2032
- Table 7: Global Phenol Market Revenue Billion Forecast, by Country 2019 & 2032
- Table 8: Global Phenol Market Volume K Tons Forecast, by Country 2019 & 2032
- Table 9: United States Phenol Market Revenue (Billion) Forecast, by Application 2019 & 2032
- Table 10: United States Phenol Market Volume (K Tons) Forecast, by Application 2019 & 2032
- Table 11: Canada Phenol Market Revenue (Billion) Forecast, by Application 2019 & 2032
- Table 12: Canada Phenol Market Volume (K Tons) Forecast, by Application 2019 & 2032
- Table 13: Mexico Phenol Market Revenue (Billion) Forecast, by Application 2019 & 2032
- Table 14: Mexico Phenol Market Volume (K Tons) Forecast, by Application 2019 & 2032
- Table 15: Global Phenol Market Revenue Billion Forecast, by Country 2019 & 2032
- Table 16: Global Phenol Market Volume K Tons Forecast, by Country 2019 & 2032
- Table 17: Germany Phenol Market Revenue (Billion) Forecast, by Application 2019 & 2032
- Table 18: Germany Phenol Market Volume (K Tons) Forecast, by Application 2019 & 2032
- Table 19: France Phenol Market Revenue (Billion) Forecast, by Application 2019 & 2032
- Table 20: France Phenol Market Volume (K Tons) Forecast, by Application 2019 & 2032
- Table 21: Italy Phenol Market Revenue (Billion) Forecast, by Application 2019 & 2032
- Table 22: Italy Phenol Market Volume (K Tons) Forecast, by Application 2019 & 2032
- Table 23: United Kingdom Phenol Market Revenue (Billion) Forecast, by Application 2019 & 2032
- Table 24: United Kingdom Phenol Market Volume (K Tons) Forecast, by Application 2019 & 2032
- Table 25: Netherlands Phenol Market Revenue (Billion) Forecast, by Application 2019 & 2032
- Table 26: Netherlands Phenol Market Volume (K Tons) Forecast, by Application 2019 & 2032
- Table 27: Rest of Europe Phenol Market Revenue (Billion) Forecast, by Application 2019 & 2032
- Table 28: Rest of Europe Phenol Market Volume (K Tons) Forecast, by Application 2019 & 2032
- Table 29: Global Phenol Market Revenue Billion Forecast, by Country 2019 & 2032
- Table 30: Global Phenol Market Volume K Tons Forecast, by Country 2019 & 2032
- Table 31: China Phenol Market Revenue (Billion) Forecast, by Application 2019 & 2032
- Table 32: China Phenol Market Volume (K Tons) Forecast, by Application 2019 & 2032
- Table 33: Japan Phenol Market Revenue (Billion) Forecast, by Application 2019 & 2032
- Table 34: Japan Phenol Market Volume (K Tons) Forecast, by Application 2019 & 2032
- Table 35: India Phenol Market Revenue (Billion) Forecast, by Application 2019 & 2032
- Table 36: India Phenol Market Volume (K Tons) Forecast, by Application 2019 & 2032
- Table 37: South Korea Phenol Market Revenue (Billion) Forecast, by Application 2019 & 2032
- Table 38: South Korea Phenol Market Volume (K Tons) Forecast, by Application 2019 & 2032
- Table 39: Taiwan Phenol Market Revenue (Billion) Forecast, by Application 2019 & 2032
- Table 40: Taiwan Phenol Market Volume (K Tons) Forecast, by Application 2019 & 2032
- Table 41: Australia Phenol Market Revenue (Billion) Forecast, by Application 2019 & 2032
- Table 42: Australia Phenol Market Volume (K Tons) Forecast, by Application 2019 & 2032
- Table 43: Rest of Asia-Pacific Phenol Market Revenue (Billion) Forecast, by Application 2019 & 2032
- Table 44: Rest of Asia-Pacific Phenol Market Volume (K Tons) Forecast, by Application 2019 & 2032
- Table 45: Global Phenol Market Revenue Billion Forecast, by Country 2019 & 2032
- Table 46: Global Phenol Market Volume K Tons Forecast, by Country 2019 & 2032
- Table 47: Brazil Phenol Market Revenue (Billion) Forecast, by Application 2019 & 2032
- Table 48: Brazil Phenol Market Volume (K Tons) Forecast, by Application 2019 & 2032
- Table 49: Argentina Phenol Market Revenue (Billion) Forecast, by Application 2019 & 2032
- Table 50: Argentina Phenol Market Volume (K Tons) Forecast, by Application 2019 & 2032
- Table 51: Rest of South America Phenol Market Revenue (Billion) Forecast, by Application 2019 & 2032
- Table 52: Rest of South America Phenol Market Volume (K Tons) Forecast, by Application 2019 & 2032
- Table 53: Global Phenol Market Revenue Billion Forecast, by Country 2019 & 2032
- Table 54: Global Phenol Market Volume K Tons Forecast, by Country 2019 & 2032
- Table 55: Middle East Phenol Market Revenue (Billion) Forecast, by Application 2019 & 2032
- Table 56: Middle East Phenol Market Volume (K Tons) Forecast, by Application 2019 & 2032
- Table 57: Africa Phenol Market Revenue (Billion) Forecast, by Application 2019 & 2032
- Table 58: Africa Phenol Market Volume (K Tons) Forecast, by Application 2019 & 2032
- Table 59: Global Phenol Market Revenue Billion Forecast, by Product Type 2019 & 2032
- Table 60: Global Phenol Market Volume K Tons Forecast, by Product Type 2019 & 2032
- Table 61: Global Phenol Market Revenue Billion Forecast, by Country 2019 & 2032
- Table 62: Global Phenol Market Volume K Tons Forecast, by Country 2019 & 2032
- Table 63: China Phenol Market Revenue (Billion) Forecast, by Application 2019 & 2032
- Table 64: China Phenol Market Volume (K Tons) Forecast, by Application 2019 & 2032
- Table 65: India Phenol Market Revenue (Billion) Forecast, by Application 2019 & 2032
- Table 66: India Phenol Market Volume (K Tons) Forecast, by Application 2019 & 2032
- Table 67: Japan Phenol Market Revenue (Billion) Forecast, by Application 2019 & 2032
- Table 68: Japan Phenol Market Volume (K Tons) Forecast, by Application 2019 & 2032
- Table 69: South Korea Phenol Market Revenue (Billion) Forecast, by Application 2019 & 2032
- Table 70: South Korea Phenol Market Volume (K Tons) Forecast, by Application 2019 & 2032
- Table 71: Rest of Asia Pacific Phenol Market Revenue (Billion) Forecast, by Application 2019 & 2032
- Table 72: Rest of Asia Pacific Phenol Market Volume (K Tons) Forecast, by Application 2019 & 2032
- Table 73: Global Phenol Market Revenue Billion Forecast, by Product Type 2019 & 2032
- Table 74: Global Phenol Market Volume K Tons Forecast, by Product Type 2019 & 2032
- Table 75: Global Phenol Market Revenue Billion Forecast, by Country 2019 & 2032
- Table 76: Global Phenol Market Volume K Tons Forecast, by Country 2019 & 2032
- Table 77: United States Phenol Market Revenue (Billion) Forecast, by Application 2019 & 2032
- Table 78: United States Phenol Market Volume (K Tons) Forecast, by Application 2019 & 2032
- Table 79: Canada Phenol Market Revenue (Billion) Forecast, by Application 2019 & 2032
- Table 80: Canada Phenol Market Volume (K Tons) Forecast, by Application 2019 & 2032
- Table 81: Mexico Phenol Market Revenue (Billion) Forecast, by Application 2019 & 2032
- Table 82: Mexico Phenol Market Volume (K Tons) Forecast, by Application 2019 & 2032
- Table 83: Global Phenol Market Revenue Billion Forecast, by Product Type 2019 & 2032
- Table 84: Global Phenol Market Volume K Tons Forecast, by Product Type 2019 & 2032
- Table 85: Global Phenol Market Revenue Billion Forecast, by Country 2019 & 2032
- Table 86: Global Phenol Market Volume K Tons Forecast, by Country 2019 & 2032
- Table 87: Germany Phenol Market Revenue (Billion) Forecast, by Application 2019 & 2032
- Table 88: Germany Phenol Market Volume (K Tons) Forecast, by Application 2019 & 2032
- Table 89: United Kingdom Phenol Market Revenue (Billion) Forecast, by Application 2019 & 2032
- Table 90: United Kingdom Phenol Market Volume (K Tons) Forecast, by Application 2019 & 2032
- Table 91: France Phenol Market Revenue (Billion) Forecast, by Application 2019 & 2032
- Table 92: France Phenol Market Volume (K Tons) Forecast, by Application 2019 & 2032
- Table 93: Italy Phenol Market Revenue (Billion) Forecast, by Application 2019 & 2032
- Table 94: Italy Phenol Market Volume (K Tons) Forecast, by Application 2019 & 2032
- Table 95: Rest of Europe Phenol Market Revenue (Billion) Forecast, by Application 2019 & 2032
- Table 96: Rest of Europe Phenol Market Volume (K Tons) Forecast, by Application 2019 & 2032
- Table 97: Global Phenol Market Revenue Billion Forecast, by Product Type 2019 & 2032
- Table 98: Global Phenol Market Volume K Tons Forecast, by Product Type 2019 & 2032
- Table 99: Global Phenol Market Revenue Billion Forecast, by Country 2019 & 2032
- Table 100: Global Phenol Market Volume K Tons Forecast, by Country 2019 & 2032
- Table 101: Brazil Phenol Market Revenue (Billion) Forecast, by Application 2019 & 2032
- Table 102: Brazil Phenol Market Volume (K Tons) Forecast, by Application 2019 & 2032
- Table 103: Argentina Phenol Market Revenue (Billion) Forecast, by Application 2019 & 2032
- Table 104: Argentina Phenol Market Volume (K Tons) Forecast, by Application 2019 & 2032
- Table 105: Rest of South America Phenol Market Revenue (Billion) Forecast, by Application 2019 & 2032
- Table 106: Rest of South America Phenol Market Volume (K Tons) Forecast, by Application 2019 & 2032
- Table 107: Global Phenol Market Revenue Billion Forecast, by Product Type 2019 & 2032
- Table 108: Global Phenol Market Volume K Tons Forecast, by Product Type 2019 & 2032
- Table 109: Global Phenol Market Revenue Billion Forecast, by Country 2019 & 2032
- Table 110: Global Phenol Market Volume K Tons Forecast, by Country 2019 & 2032
- Table 111: Saudi Arabia Phenol Market Revenue (Billion) Forecast, by Application 2019 & 2032
- Table 112: Saudi Arabia Phenol Market Volume (K Tons) Forecast, by Application 2019 & 2032
- Table 113: South Africa Phenol Market Revenue (Billion) Forecast, by Application 2019 & 2032
- Table 114: South Africa Phenol Market Volume (K Tons) Forecast, by Application 2019 & 2032
- Table 115: Rest of Middle East and Africa Phenol Market Revenue (Billion) Forecast, by Application 2019 & 2032
- Table 116: Rest of Middle East and Africa Phenol Market Volume (K Tons) Forecast, by Application 2019 & 2032
Frequently Asked Questions
1. What is the projected Compound Annual Growth Rate (CAGR) of the Phenol Market?
The projected CAGR is approximately 4.9%.
2. Which companies are prominent players in the Phenol Market?
Key companies in the market include Shell PLC, Solvay, AdvanSix Inc, Mitsui Chemicals Inc, Mitsubishi Chemical Corporation, Cepsa, Altivia, Domo Chemical GmbH, PTT Phenol Company Limited, Formosa Chemicals & Fibre Corp, INEOS Capital Limited, Kumho P&B Chemicals Inc.
3. What are the main segments of the Phenol Market?
The market segments include Product Type.
4. Can you provide details about the market size?
The market size is estimated to be USD 24.3 Billion as of 2022.
5. What are some drivers contributing to market growth?
High Demand of Bisphenol-A; Other Drivers.
6. What are the notable trends driving market growth?
Bisphenol-A Product Type to Drive the Market.
7. Are there any restraints impacting market growth?
Ban on BPA in the United States and Europe; Others Restraints.
8. Can you provide examples of recent developments in the market?
August 2022: INEOS Phenol announced the acquisition of the asset base of Mitsui Phenols Singapore Ltd from Mitsui Chemicals for a total consideration of USD 330 million. The addition of the Jurong phenol and BPA assets will provide integration opportunities with manufacturing sites in Germany, Belgium, and the United States. The acquisition will increase the total production capacity by 1 million tonnes.
9. What pricing options are available for accessing the report?
Pricing options include single-user, multi-user, and enterprise licenses priced at USD 4750, USD 5250, and USD 8750 respectively.
10. Is the market size provided in terms of value or volume?
The market size is provided in terms of value, measured in Billion and volume, measured in K Tons.
11. Are there any specific market keywords associated with the report?
Yes, the market keyword associated with the report is "Phenol Market," which aids in identifying and referencing the specific market segment covered.
12. How do I determine which pricing option suits my needs best?
The pricing options vary based on user requirements and access needs. Individual users may opt for single-user licenses, while businesses requiring broader access may choose multi-user or enterprise licenses for cost-effective access to the report.
13. Are there any additional resources or data provided in the Phenol Market report?
While the report offers comprehensive insights, it's advisable to review the specific contents or supplementary materials provided to ascertain if additional resources or data are available.
14. How can I stay updated on further developments or reports in the Phenol Market?
To stay informed about further developments, trends, and reports in the Phenol Market, consider subscribing to industry newsletters, following relevant companies and organizations, or regularly checking reputable industry news sources and publications.
Methodology
Step 1 - Identification of Relevant Samples Size from Population Database


Step 2 - Approaches for Defining Global Market Size (Value, Volume* & Price*)

Note*: In applicable scenarios
Step 3 - Data Sources
Primary Research
- Web Analytics
- Survey Reports
- Research Institute
- Latest Research Reports
- Opinion Leaders
Secondary Research
- Annual Reports
- White Paper
- Latest Press Release
- Industry Association
- Paid Database
- Investor Presentations

Step 4 - Data Triangulation
Involves using different sources of information in order to increase the validity of a study
These sources are likely to be stakeholders in a program - participants, other researchers, program staff, other community members, and so on.
Then we put all data in single framework & apply various statistical tools to find out the dynamic on the market.
During the analysis stage, feedback from the stakeholder groups would be compared to determine areas of agreement as well as areas of divergence


