

Key Insights
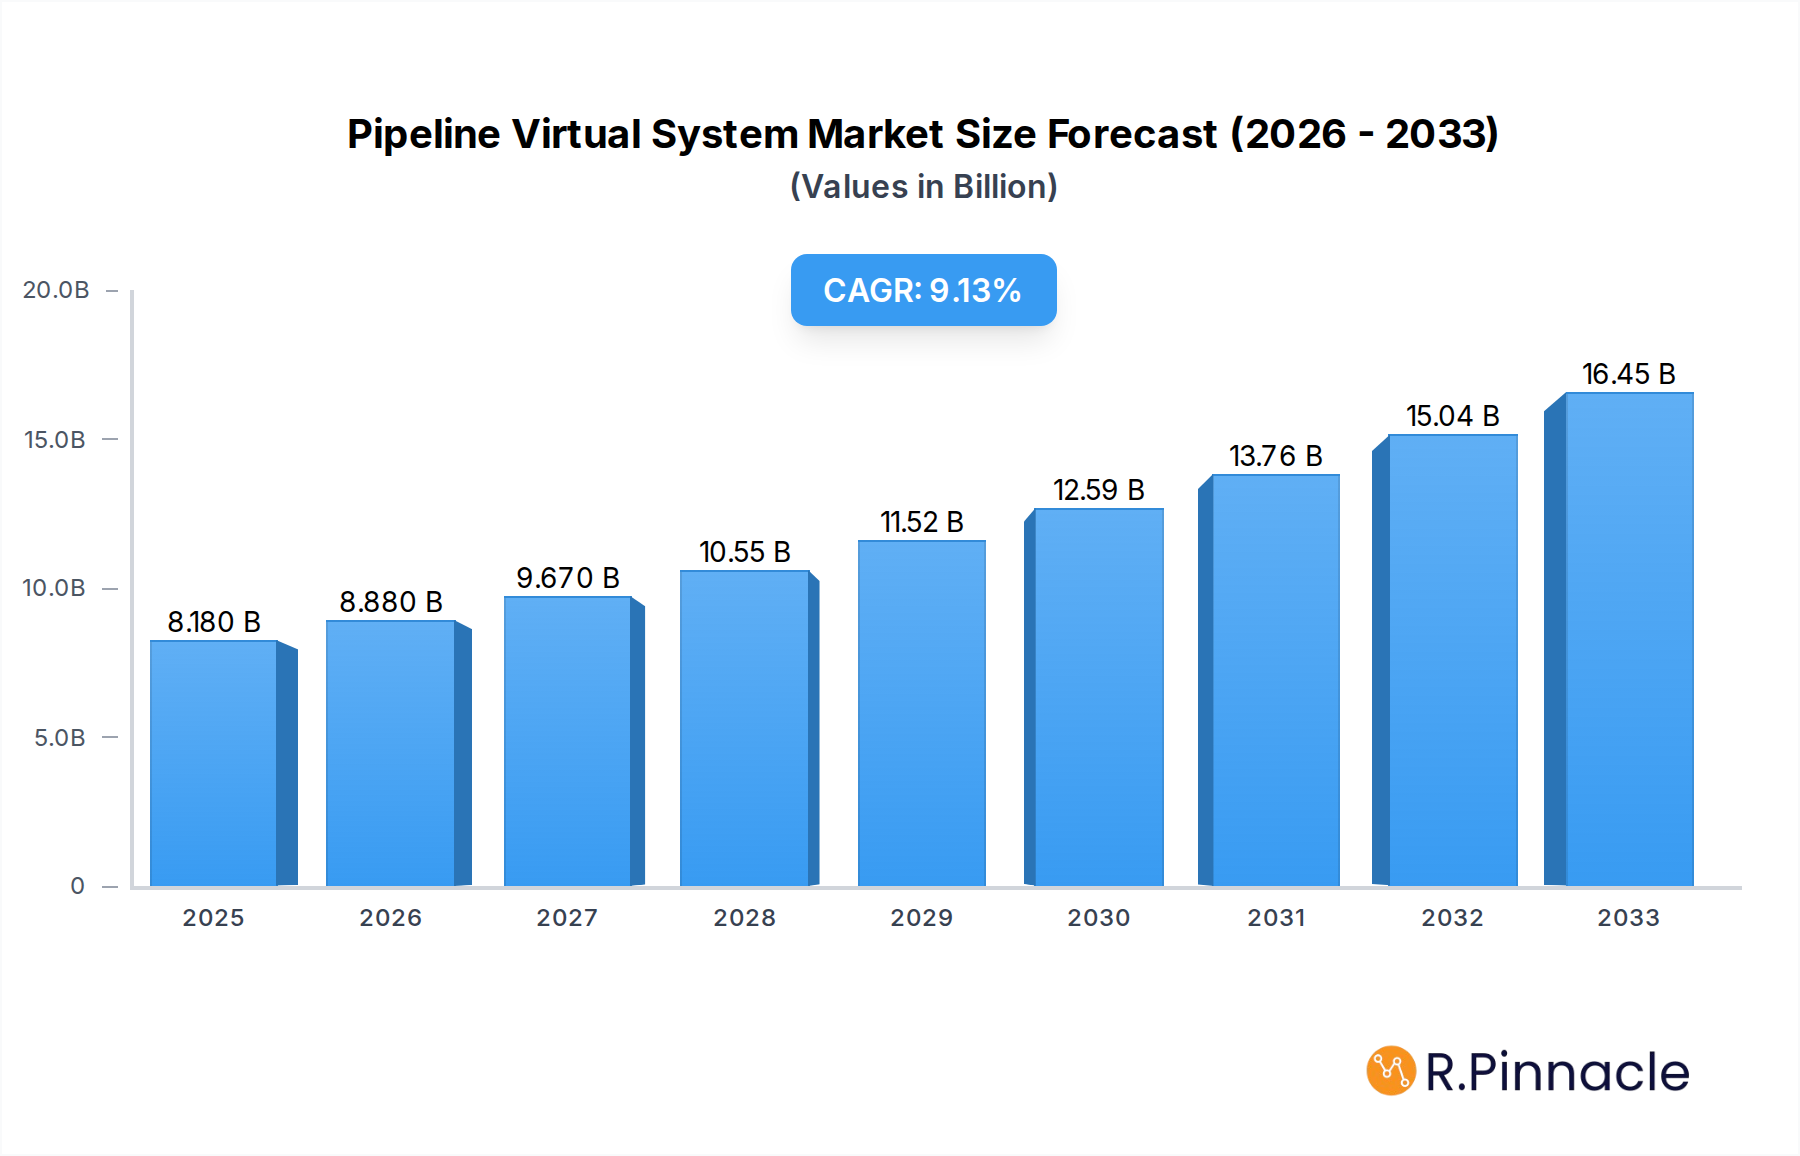
The global Pipeline Virtual System market is poised for substantial expansion, projected to reach $8.18 billion by 2025 with a robust Compound Annual Growth Rate (CAGR) of 8.82% over the forecast period. This dynamic growth is primarily fueled by an increasing demand for efficient and reliable energy transportation solutions, coupled with the inherent advantages of virtual pipelines in terms of cost-effectiveness and environmental sustainability. The industrial sector, a key application area, is driving significant adoption due to the need for uninterrupted supply of natural gas and other feedstocks for manufacturing processes. Furthermore, the transportation sector is increasingly leveraging virtual pipelines for cleaner fuel alternatives, such as compressed natural gas (CNG) and liquefied natural gas (LNG), especially in regions with developing natural gas infrastructure. The market's expansion is also supported by advancements in technology, leading to the development of both small-scale and large-scale systems capable of catering to diverse logistical and volumetric requirements.

Pipeline Virtual System Market Size (In Billion)
The projected growth trajectory of the Pipeline Virtual System market is further augmented by several key trends, including the increasing focus on reducing greenhouse gas emissions and the pursuit of energy independence. Virtual pipelines offer a flexible and less capital-intensive alternative to traditional pipeline construction, making them an attractive option for bridging supply-demand gaps and accessing remote or underserved markets. Key market drivers include supportive government regulations promoting the use of natural gas as a cleaner fuel, and technological innovations enhancing the efficiency and safety of virtual pipeline operations. While the market presents significant opportunities, potential restraints such as fluctuating natural gas prices and the need for stringent safety regulations could influence the pace of adoption in certain regions. However, the overall outlook remains overwhelmingly positive, with substantial growth expected across all major application and system types.
Pipeline Virtual System Company Market Share
Pipeline Virtual System Market Structure & Innovation Trends
The global Pipeline Virtual System market exhibits a highly fragmented structure, with a mix of established players and emerging innovators driving significant market share gains through strategic product development and service expansion. Innovation is primarily fueled by advancements in digitalization, IoT integration, and advanced analytics, enabling real-time monitoring, predictive maintenance, and optimized flow management. Regulatory frameworks surrounding natural gas distribution, safety standards, and environmental compliance play a pivotal role in shaping market entry and operational strategies. While direct pipeline infrastructure remains a substitute, virtual systems offer unparalleled flexibility and cost-effectiveness for reaching remote or underserviced areas. End-user demographics span a broad spectrum, from industrial giants seeking reliable energy solutions to residential communities demanding cleaner alternatives. Mergers and acquisitions (M&A) activity is on an upward trajectory, with an estimated multi-billion dollar deal value observed in the historical period (2019-2024), as larger entities acquire innovative startups to bolster their technological capabilities and market reach. The study period (2019-2033) anticipates a steady consolidation, with market share expected to shift towards companies demonstrating superior digital integration and operational efficiency.
Pipeline Virtual System Market Dynamics & Trends
The Pipeline Virtual System market is poised for robust growth, driven by an escalating demand for flexible and accessible natural gas solutions across diverse sectors. The Compound Annual Growth Rate (CAGR) is projected to be in the high single digits throughout the forecast period (2025-2033). This expansion is significantly propelled by technological disruptions, particularly the integration of Artificial Intelligence (AI) and Machine Learning (ML) for predictive analytics, optimizing gas flow, and enhancing safety protocols. The growing emphasis on decarbonization and cleaner energy alternatives further bolsters market penetration, as virtual pipelines offer a viable solution for regions lacking extensive traditional pipeline infrastructure.
Consumer preferences are shifting towards more adaptable and cost-effective energy supply models. Businesses, particularly in the Industrial and Transportation segments, are increasingly opting for virtual systems to manage fluctuating energy needs and reduce reliance on volatile fossil fuel markets. The Commercial sector is also witnessing a rise in adoption, driven by the need for reliable and on-demand gas supply for heating, cooking, and specialized industrial processes. The Residential segment, while still nascent in large-scale adoption, presents significant long-term potential as the technology matures and becomes more accessible.
Competitive dynamics are characterized by intense innovation and strategic partnerships. Companies are investing heavily in developing advanced liquefaction and regasification technologies, alongside sophisticated logistics and supply chain management platforms. The ability to offer end-to-end solutions, from gas sourcing to final delivery, is becoming a key differentiator. Market penetration is expected to accelerate as the economic advantages of virtual pipelines become more widely recognized, especially for last-mile delivery and serving niche markets. The estimated market size is projected to reach several hundred billion dollars by the end of the forecast period.
Dominant Regions & Segments in Pipeline Virtual System
The North American region stands as the dominant force in the global Pipeline Virtual System market, with the United States leading the charge. This dominance is underpinned by a confluence of factors, including robust existing natural gas infrastructure, significant shale gas production, and proactive governmental policies supporting energy diversification and infrastructure modernization. The Industrial segment within North America is the primary driver of this dominance, fueled by the energy-intensive nature of manufacturing, chemical production, and refining industries that require reliable and substantial natural gas supplies.
Key Drivers of North American Dominance:
- Abundant Natural Gas Reserves: The U.S. possesses vast reserves of natural gas, particularly from shale formations, providing a readily available and cost-effective feedstock for virtual pipeline operations.
- Developed Infrastructure: Existing natural gas pipelines, storage facilities, and LNG terminals create a synergistic ecosystem that supports the efficient deployment and operation of virtual pipeline systems.
- Favorable Regulatory Environment: Government initiatives and incentives promoting energy independence and the utilization of cleaner fuels have fostered an environment conducive to the growth of virtual pipeline solutions.
- Technological Advancements: Significant investment in R&D has led to advancements in cryogenic transportation and storage technologies, enhancing the efficiency and cost-effectiveness of virtual pipeline operations.
Within the Types segmentation, the Large Scale System is experiencing the most significant demand, particularly from industrial and commercial users requiring substantial volumes of natural gas. These systems leverage larger cryogenic trailers and optimized logistical networks to serve major consumption centers and industrial complexes.
The Transportation segment is emerging as a significant growth area, driven by the increasing adoption of natural gas vehicles (NGVs) in trucking and fleet operations. Virtual pipelines provide a crucial solution for refueling these vehicles in locations not served by traditional compressed natural gas (CNG) or liquefied natural gas (LNG) stations. The Commercial segment, encompassing businesses requiring natural gas for heating, cooling, and specific industrial processes, also represents a substantial market. The ability of virtual pipelines to offer flexible supply solutions caters to the variable demands of these enterprises.
Pipeline Virtual System Product Innovations
Pipeline Virtual System innovation is centered on enhancing efficiency, safety, and accessibility. Advancements in cryogenic tank design and lightweight composite materials are reducing transportation costs and increasing payload capacity. The integration of IoT sensors and advanced analytics platforms allows for real-time monitoring of gas pressure, temperature, and flow, enabling predictive maintenance and optimizing delivery schedules. Furthermore, developments in small-scale liquefaction and regasification units are making virtual pipeline solutions more viable for remote or smaller-scale applications, thereby expanding their market reach and competitive advantage.
Report Scope & Segmentation Analysis
This report provides a comprehensive analysis of the Pipeline Virtual System market, segmenting it by Application and Type. The Application segment includes Industrial, Transportation, Commercial, and Residential. The Industrial segment is projected to exhibit strong growth due to sustained energy demand from manufacturing and processing industries, with an estimated market size in the tens of billions of dollars. The Transportation segment is anticipated to see rapid expansion driven by the increasing adoption of NGVs, with an estimated growth rate of over 15% CAGR. The Commercial segment will experience steady growth, catering to businesses needing flexible gas supply, with a projected market size in the billions. The Residential segment, while smaller, holds substantial long-term potential as technology becomes more accessible and affordable, with an estimated growth rate in the high single digits.
The Type segment comprises Small Scale System and Large Scale System. The Large Scale System currently dominates the market due to industrial and transportation needs, with an estimated market share exceeding 70% and a market size in the hundreds of billions. The Small Scale System is expected to witness a higher CAGR as it caters to niche applications and emerging markets, with an estimated growth rate of over 12% CAGR.
Key Drivers of Pipeline Virtual System Growth
The Pipeline Virtual System market is propelled by a confluence of powerful growth drivers. Technologically, the advancements in cryogenic storage and transportation technologies, coupled with the pervasive integration of IoT and AI for optimized logistics and predictive maintenance, are making virtual pipelines more efficient and cost-effective. Economically, the increasing price volatility of traditional energy sources and the growing demand for cleaner energy alternatives are pushing industries and consumers towards flexible and readily available gas supplies. Regulatory drivers include government initiatives supporting energy diversification, reduced emissions targets, and the development of infrastructure for non-pipeline gas delivery, all of which create a favorable environment for virtual pipeline expansion.
Challenges in the Pipeline Virtual System Sector
Despite the promising growth trajectory, the Pipeline Virtual System sector faces several significant challenges. High initial capital investment for liquefaction, transportation, and regasification infrastructure remains a considerable barrier. Stringent regulatory hurdles and permitting processes associated with the transportation of cryogenic liquids and natural gas can lead to project delays and increased costs. Furthermore, supply chain disruptions and the availability of specialized equipment and skilled labor can impact operational efficiency. Intense competitive pressures from both traditional pipeline operators and alternative energy solutions also necessitate continuous innovation and cost optimization to maintain market share.
Emerging Opportunities in Pipeline Virtual System
The Pipeline Virtual System sector is rife with emerging opportunities, driven by evolving market needs and technological breakthroughs. The growing demand for decentralized energy solutions presents a significant opportunity for virtual pipelines to serve remote communities and industrial sites lacking traditional infrastructure. The expansion of the NGV market globally will continue to fuel demand for mobile fueling solutions facilitated by virtual pipelines. Furthermore, advancements in small-scale LNG liquefaction and regasification technologies are opening doors for new applications in sectors like marine bunkering and microgrids. The increasing focus on sustainability and reducing carbon footprints also creates opportunities for virtual pipelines to deliver cleaner fuels like biomethane and hydrogen blends.
Leading Players in the Pipeline Virtual System Market
- GE Oil & Gas
- Hexagon Composites ASA
- Luxfer Holdings PLC
- Galileo Technologies S.A.
- Pentagon Energy LLC
- LightSail Energy
- Cimarron Composites
- Xpress Natural Gas LLC
- NG Advantage LLC
- Compass Natural Gas
- Broadwind Energy, Inc.
- REV LNG, LLC
- Global Partners LP
- CNG Services
- GAS MALAYSIA
Key Developments in Pipeline Virtual System Industry
- 2023: Expansion of cryogenic trailer manufacturing capacity by key players to meet growing demand.
- 2023: Increased adoption of AI-powered route optimization software for enhanced delivery efficiency.
- 2022: Significant investments in R&D for advanced composite materials to reduce trailer weight and increase payload.
- 2022: Introduction of enhanced safety monitoring systems utilizing IoT for real-time leak detection.
- 2021: Strategic partnerships formed between virtual pipeline operators and NGV fleet providers.
- 2021: Pilot programs launched for the delivery of biomethane via virtual pipeline systems.
- 2020: Development of modular and scalable regasification units for diverse applications.
- 2019: Increased M&A activity as larger energy companies acquire specialized virtual pipeline service providers.
Future Outlook for Pipeline Virtual System Market
The future outlook for the Pipeline Virtual System market is exceptionally bright, poised for sustained expansion driven by a powerful synergy of technological innovation and evolving market demands. The projected growth is expected to reach several hundred billion dollars by the end of the study period. Strategic opportunities lie in the continued development and deployment of advanced digital solutions for end-to-end supply chain management, alongside innovations in energy storage and transportation technologies. As the global imperative for cleaner energy intensifies, virtual pipelines will play an increasingly crucial role in facilitating the transition by providing flexible and accessible natural gas solutions, including the potential for future hydrogen and biomethane integration.
Pipeline Virtual System Segmentation
-
1. Application
- 1.1. Industrial
- 1.2. Transportation
- 1.3. Commercial
- 1.4. Residential
-
2. Types
- 2.1. Small Scale System
- 2.2. Large Scale System
Pipeline Virtual System Segmentation By Geography
-
1. North America
- 1.1. United States
- 1.2. Canada
- 1.3. Mexico
-
2. South America
- 2.1. Brazil
- 2.2. Argentina
- 2.3. Rest of South America
-
3. Europe
- 3.1. United Kingdom
- 3.2. Germany
- 3.3. France
- 3.4. Italy
- 3.5. Spain
- 3.6. Russia
- 3.7. Benelux
- 3.8. Nordics
- 3.9. Rest of Europe
-
4. Middle East & Africa
- 4.1. Turkey
- 4.2. Israel
- 4.3. GCC
- 4.4. North Africa
- 4.5. South Africa
- 4.6. Rest of Middle East & Africa
-
5. Asia Pacific
- 5.1. China
- 5.2. India
- 5.3. Japan
- 5.4. South Korea
- 5.5. ASEAN
- 5.6. Oceania
- 5.7. Rest of Asia Pacific
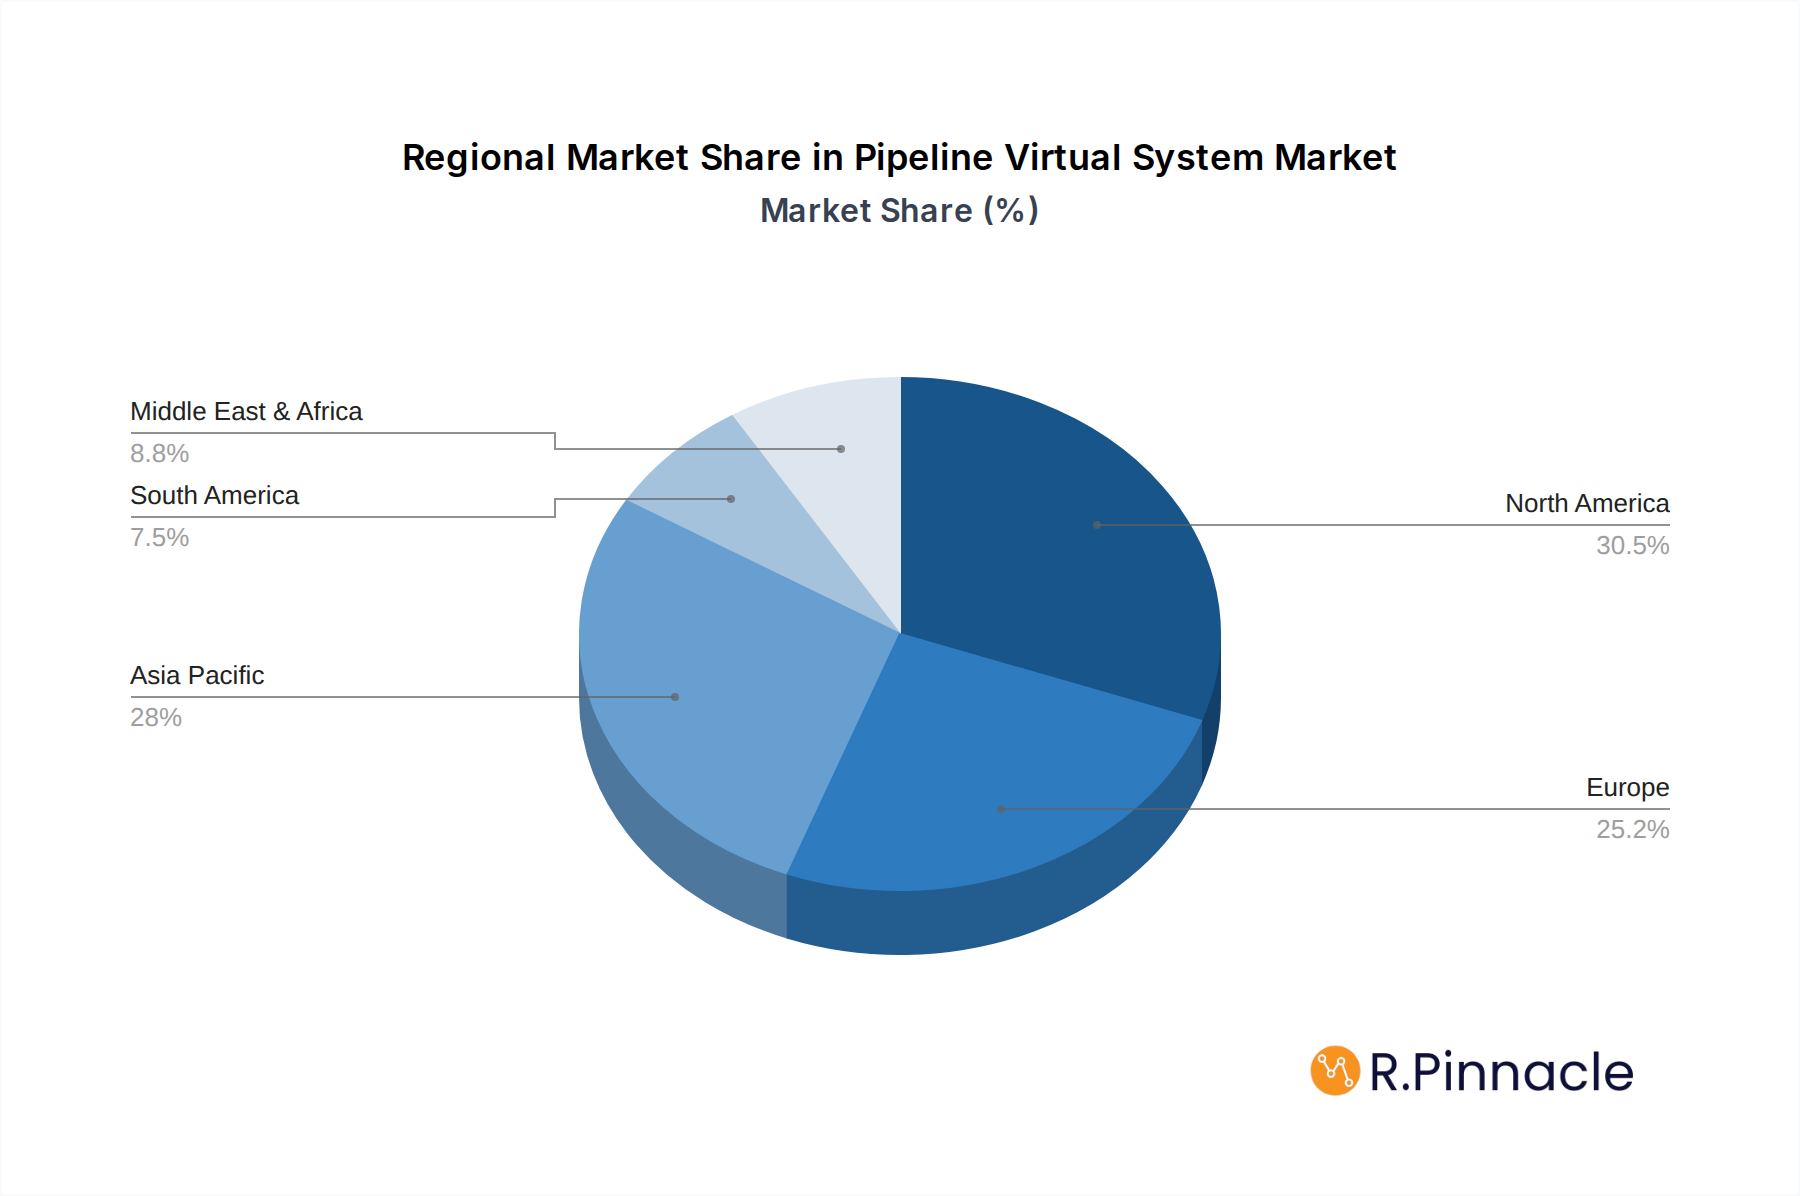
Pipeline Virtual System Regional Market Share
Geographic Coverage of Pipeline Virtual System
Pipeline Virtual System REPORT HIGHLIGHTS
| Aspects | Details |
|---|---|
| Study Period | 2020-2034 |
| Base Year | 2025 |
| Estimated Year | 2026 |
| Forecast Period | 2026-2034 |
| Historical Period | 2020-2025 |
| Growth Rate | CAGR of 8.82% from 2020-2034 |
| Segmentation |
|
Table of Contents
- 1. Introduction
- 1.1. Research Scope
- 1.2. Market Segmentation
- 1.3. Research Methodology
- 1.4. Definitions and Assumptions
- 2. Executive Summary
- 2.1. Introduction
- 3. Market Dynamics
- 3.1. Introduction
- 3.2. Market Drivers
- 3.3. Market Restrains
- 3.4. Market Trends
- 4. Market Factor Analysis
- 4.1. Porters Five Forces
- 4.2. Supply/Value Chain
- 4.3. PESTEL analysis
- 4.4. Market Entropy
- 4.5. Patent/Trademark Analysis
- 5. Global Pipeline Virtual System Analysis, Insights and Forecast, 2020-2032
- 5.1. Market Analysis, Insights and Forecast - by Application
- 5.1.1. Industrial
- 5.1.2. Transportation
- 5.1.3. Commercial
- 5.1.4. Residential
- 5.2. Market Analysis, Insights and Forecast - by Types
- 5.2.1. Small Scale System
- 5.2.2. Large Scale System
- 5.3. Market Analysis, Insights and Forecast - by Region
- 5.3.1. North America
- 5.3.2. South America
- 5.3.3. Europe
- 5.3.4. Middle East & Africa
- 5.3.5. Asia Pacific
- 5.1. Market Analysis, Insights and Forecast - by Application
- 6. North America Pipeline Virtual System Analysis, Insights and Forecast, 2020-2032
- 6.1. Market Analysis, Insights and Forecast - by Application
- 6.1.1. Industrial
- 6.1.2. Transportation
- 6.1.3. Commercial
- 6.1.4. Residential
- 6.2. Market Analysis, Insights and Forecast - by Types
- 6.2.1. Small Scale System
- 6.2.2. Large Scale System
- 6.1. Market Analysis, Insights and Forecast - by Application
- 7. South America Pipeline Virtual System Analysis, Insights and Forecast, 2020-2032
- 7.1. Market Analysis, Insights and Forecast - by Application
- 7.1.1. Industrial
- 7.1.2. Transportation
- 7.1.3. Commercial
- 7.1.4. Residential
- 7.2. Market Analysis, Insights and Forecast - by Types
- 7.2.1. Small Scale System
- 7.2.2. Large Scale System
- 7.1. Market Analysis, Insights and Forecast - by Application
- 8. Europe Pipeline Virtual System Analysis, Insights and Forecast, 2020-2032
- 8.1. Market Analysis, Insights and Forecast - by Application
- 8.1.1. Industrial
- 8.1.2. Transportation
- 8.1.3. Commercial
- 8.1.4. Residential
- 8.2. Market Analysis, Insights and Forecast - by Types
- 8.2.1. Small Scale System
- 8.2.2. Large Scale System
- 8.1. Market Analysis, Insights and Forecast - by Application
- 9. Middle East & Africa Pipeline Virtual System Analysis, Insights and Forecast, 2020-2032
- 9.1. Market Analysis, Insights and Forecast - by Application
- 9.1.1. Industrial
- 9.1.2. Transportation
- 9.1.3. Commercial
- 9.1.4. Residential
- 9.2. Market Analysis, Insights and Forecast - by Types
- 9.2.1. Small Scale System
- 9.2.2. Large Scale System
- 9.1. Market Analysis, Insights and Forecast - by Application
- 10. Asia Pacific Pipeline Virtual System Analysis, Insights and Forecast, 2020-2032
- 10.1. Market Analysis, Insights and Forecast - by Application
- 10.1.1. Industrial
- 10.1.2. Transportation
- 10.1.3. Commercial
- 10.1.4. Residential
- 10.2. Market Analysis, Insights and Forecast - by Types
- 10.2.1. Small Scale System
- 10.2.2. Large Scale System
- 10.1. Market Analysis, Insights and Forecast - by Application
- 11. Competitive Analysis
- 11.1. Global Market Share Analysis 2025
- 11.2. Company Profiles
- 11.2.1 GE Oil & Gas
- 11.2.1.1. Overview
- 11.2.1.2. Products
- 11.2.1.3. SWOT Analysis
- 11.2.1.4. Recent Developments
- 11.2.1.5. Financials (Based on Availability)
- 11.2.2 Hexagon Composites ASA
- 11.2.2.1. Overview
- 11.2.2.2. Products
- 11.2.2.3. SWOT Analysis
- 11.2.2.4. Recent Developments
- 11.2.2.5. Financials (Based on Availability)
- 11.2.3 Luxfer Holdings PLC
- 11.2.3.1. Overview
- 11.2.3.2. Products
- 11.2.3.3. SWOT Analysis
- 11.2.3.4. Recent Developments
- 11.2.3.5. Financials (Based on Availability)
- 11.2.4 Galileo Technologies S.A.
- 11.2.4.1. Overview
- 11.2.4.2. Products
- 11.2.4.3. SWOT Analysis
- 11.2.4.4. Recent Developments
- 11.2.4.5. Financials (Based on Availability)
- 11.2.5 Pentagon Energy LLC
- 11.2.5.1. Overview
- 11.2.5.2. Products
- 11.2.5.3. SWOT Analysis
- 11.2.5.4. Recent Developments
- 11.2.5.5. Financials (Based on Availability)
- 11.2.6 LightSail Energy
- 11.2.6.1. Overview
- 11.2.6.2. Products
- 11.2.6.3. SWOT Analysis
- 11.2.6.4. Recent Developments
- 11.2.6.5. Financials (Based on Availability)
- 11.2.7 Cimarron Composites
- 11.2.7.1. Overview
- 11.2.7.2. Products
- 11.2.7.3. SWOT Analysis
- 11.2.7.4. Recent Developments
- 11.2.7.5. Financials (Based on Availability)
- 11.2.8 Xpress Natural Gas LLC
- 11.2.8.1. Overview
- 11.2.8.2. Products
- 11.2.8.3. SWOT Analysis
- 11.2.8.4. Recent Developments
- 11.2.8.5. Financials (Based on Availability)
- 11.2.9 NG Advantage LLC
- 11.2.9.1. Overview
- 11.2.9.2. Products
- 11.2.9.3. SWOT Analysis
- 11.2.9.4. Recent Developments
- 11.2.9.5. Financials (Based on Availability)
- 11.2.10 Compass Natural Gas
- 11.2.10.1. Overview
- 11.2.10.2. Products
- 11.2.10.3. SWOT Analysis
- 11.2.10.4. Recent Developments
- 11.2.10.5. Financials (Based on Availability)
- 11.2.11 Broadwind Energy
- 11.2.11.1. Overview
- 11.2.11.2. Products
- 11.2.11.3. SWOT Analysis
- 11.2.11.4. Recent Developments
- 11.2.11.5. Financials (Based on Availability)
- 11.2.12 Inc.
- 11.2.12.1. Overview
- 11.2.12.2. Products
- 11.2.12.3. SWOT Analysis
- 11.2.12.4. Recent Developments
- 11.2.12.5. Financials (Based on Availability)
- 11.2.13 REV LNG
- 11.2.13.1. Overview
- 11.2.13.2. Products
- 11.2.13.3. SWOT Analysis
- 11.2.13.4. Recent Developments
- 11.2.13.5. Financials (Based on Availability)
- 11.2.14 LLC
- 11.2.14.1. Overview
- 11.2.14.2. Products
- 11.2.14.3. SWOT Analysis
- 11.2.14.4. Recent Developments
- 11.2.14.5. Financials (Based on Availability)
- 11.2.15 Global Partners LP
- 11.2.15.1. Overview
- 11.2.15.2. Products
- 11.2.15.3. SWOT Analysis
- 11.2.15.4. Recent Developments
- 11.2.15.5. Financials (Based on Availability)
- 11.2.16 CNG Services
- 11.2.16.1. Overview
- 11.2.16.2. Products
- 11.2.16.3. SWOT Analysis
- 11.2.16.4. Recent Developments
- 11.2.16.5. Financials (Based on Availability)
- 11.2.17 GAS MALAYSIA
- 11.2.17.1. Overview
- 11.2.17.2. Products
- 11.2.17.3. SWOT Analysis
- 11.2.17.4. Recent Developments
- 11.2.17.5. Financials (Based on Availability)
- 11.2.1 GE Oil & Gas
List of Figures
- Figure 1: Global Pipeline Virtual System Revenue Breakdown (undefined, %) by Region 2025 & 2033
- Figure 2: North America Pipeline Virtual System Revenue (undefined), by Application 2025 & 2033
- Figure 3: North America Pipeline Virtual System Revenue Share (%), by Application 2025 & 2033
- Figure 4: North America Pipeline Virtual System Revenue (undefined), by Types 2025 & 2033
- Figure 5: North America Pipeline Virtual System Revenue Share (%), by Types 2025 & 2033
- Figure 6: North America Pipeline Virtual System Revenue (undefined), by Country 2025 & 2033
- Figure 7: North America Pipeline Virtual System Revenue Share (%), by Country 2025 & 2033
- Figure 8: South America Pipeline Virtual System Revenue (undefined), by Application 2025 & 2033
- Figure 9: South America Pipeline Virtual System Revenue Share (%), by Application 2025 & 2033
- Figure 10: South America Pipeline Virtual System Revenue (undefined), by Types 2025 & 2033
- Figure 11: South America Pipeline Virtual System Revenue Share (%), by Types 2025 & 2033
- Figure 12: South America Pipeline Virtual System Revenue (undefined), by Country 2025 & 2033
- Figure 13: South America Pipeline Virtual System Revenue Share (%), by Country 2025 & 2033
- Figure 14: Europe Pipeline Virtual System Revenue (undefined), by Application 2025 & 2033
- Figure 15: Europe Pipeline Virtual System Revenue Share (%), by Application 2025 & 2033
- Figure 16: Europe Pipeline Virtual System Revenue (undefined), by Types 2025 & 2033
- Figure 17: Europe Pipeline Virtual System Revenue Share (%), by Types 2025 & 2033
- Figure 18: Europe Pipeline Virtual System Revenue (undefined), by Country 2025 & 2033
- Figure 19: Europe Pipeline Virtual System Revenue Share (%), by Country 2025 & 2033
- Figure 20: Middle East & Africa Pipeline Virtual System Revenue (undefined), by Application 2025 & 2033
- Figure 21: Middle East & Africa Pipeline Virtual System Revenue Share (%), by Application 2025 & 2033
- Figure 22: Middle East & Africa Pipeline Virtual System Revenue (undefined), by Types 2025 & 2033
- Figure 23: Middle East & Africa Pipeline Virtual System Revenue Share (%), by Types 2025 & 2033
- Figure 24: Middle East & Africa Pipeline Virtual System Revenue (undefined), by Country 2025 & 2033
- Figure 25: Middle East & Africa Pipeline Virtual System Revenue Share (%), by Country 2025 & 2033
- Figure 26: Asia Pacific Pipeline Virtual System Revenue (undefined), by Application 2025 & 2033
- Figure 27: Asia Pacific Pipeline Virtual System Revenue Share (%), by Application 2025 & 2033
- Figure 28: Asia Pacific Pipeline Virtual System Revenue (undefined), by Types 2025 & 2033
- Figure 29: Asia Pacific Pipeline Virtual System Revenue Share (%), by Types 2025 & 2033
- Figure 30: Asia Pacific Pipeline Virtual System Revenue (undefined), by Country 2025 & 2033
- Figure 31: Asia Pacific Pipeline Virtual System Revenue Share (%), by Country 2025 & 2033
List of Tables
- Table 1: Global Pipeline Virtual System Revenue undefined Forecast, by Application 2020 & 2033
- Table 2: Global Pipeline Virtual System Revenue undefined Forecast, by Types 2020 & 2033
- Table 3: Global Pipeline Virtual System Revenue undefined Forecast, by Region 2020 & 2033
- Table 4: Global Pipeline Virtual System Revenue undefined Forecast, by Application 2020 & 2033
- Table 5: Global Pipeline Virtual System Revenue undefined Forecast, by Types 2020 & 2033
- Table 6: Global Pipeline Virtual System Revenue undefined Forecast, by Country 2020 & 2033
- Table 7: United States Pipeline Virtual System Revenue (undefined) Forecast, by Application 2020 & 2033
- Table 8: Canada Pipeline Virtual System Revenue (undefined) Forecast, by Application 2020 & 2033
- Table 9: Mexico Pipeline Virtual System Revenue (undefined) Forecast, by Application 2020 & 2033
- Table 10: Global Pipeline Virtual System Revenue undefined Forecast, by Application 2020 & 2033
- Table 11: Global Pipeline Virtual System Revenue undefined Forecast, by Types 2020 & 2033
- Table 12: Global Pipeline Virtual System Revenue undefined Forecast, by Country 2020 & 2033
- Table 13: Brazil Pipeline Virtual System Revenue (undefined) Forecast, by Application 2020 & 2033
- Table 14: Argentina Pipeline Virtual System Revenue (undefined) Forecast, by Application 2020 & 2033
- Table 15: Rest of South America Pipeline Virtual System Revenue (undefined) Forecast, by Application 2020 & 2033
- Table 16: Global Pipeline Virtual System Revenue undefined Forecast, by Application 2020 & 2033
- Table 17: Global Pipeline Virtual System Revenue undefined Forecast, by Types 2020 & 2033
- Table 18: Global Pipeline Virtual System Revenue undefined Forecast, by Country 2020 & 2033
- Table 19: United Kingdom Pipeline Virtual System Revenue (undefined) Forecast, by Application 2020 & 2033
- Table 20: Germany Pipeline Virtual System Revenue (undefined) Forecast, by Application 2020 & 2033
- Table 21: France Pipeline Virtual System Revenue (undefined) Forecast, by Application 2020 & 2033
- Table 22: Italy Pipeline Virtual System Revenue (undefined) Forecast, by Application 2020 & 2033
- Table 23: Spain Pipeline Virtual System Revenue (undefined) Forecast, by Application 2020 & 2033
- Table 24: Russia Pipeline Virtual System Revenue (undefined) Forecast, by Application 2020 & 2033
- Table 25: Benelux Pipeline Virtual System Revenue (undefined) Forecast, by Application 2020 & 2033
- Table 26: Nordics Pipeline Virtual System Revenue (undefined) Forecast, by Application 2020 & 2033
- Table 27: Rest of Europe Pipeline Virtual System Revenue (undefined) Forecast, by Application 2020 & 2033
- Table 28: Global Pipeline Virtual System Revenue undefined Forecast, by Application 2020 & 2033
- Table 29: Global Pipeline Virtual System Revenue undefined Forecast, by Types 2020 & 2033
- Table 30: Global Pipeline Virtual System Revenue undefined Forecast, by Country 2020 & 2033
- Table 31: Turkey Pipeline Virtual System Revenue (undefined) Forecast, by Application 2020 & 2033
- Table 32: Israel Pipeline Virtual System Revenue (undefined) Forecast, by Application 2020 & 2033
- Table 33: GCC Pipeline Virtual System Revenue (undefined) Forecast, by Application 2020 & 2033
- Table 34: North Africa Pipeline Virtual System Revenue (undefined) Forecast, by Application 2020 & 2033
- Table 35: South Africa Pipeline Virtual System Revenue (undefined) Forecast, by Application 2020 & 2033
- Table 36: Rest of Middle East & Africa Pipeline Virtual System Revenue (undefined) Forecast, by Application 2020 & 2033
- Table 37: Global Pipeline Virtual System Revenue undefined Forecast, by Application 2020 & 2033
- Table 38: Global Pipeline Virtual System Revenue undefined Forecast, by Types 2020 & 2033
- Table 39: Global Pipeline Virtual System Revenue undefined Forecast, by Country 2020 & 2033
- Table 40: China Pipeline Virtual System Revenue (undefined) Forecast, by Application 2020 & 2033
- Table 41: India Pipeline Virtual System Revenue (undefined) Forecast, by Application 2020 & 2033
- Table 42: Japan Pipeline Virtual System Revenue (undefined) Forecast, by Application 2020 & 2033
- Table 43: South Korea Pipeline Virtual System Revenue (undefined) Forecast, by Application 2020 & 2033
- Table 44: ASEAN Pipeline Virtual System Revenue (undefined) Forecast, by Application 2020 & 2033
- Table 45: Oceania Pipeline Virtual System Revenue (undefined) Forecast, by Application 2020 & 2033
- Table 46: Rest of Asia Pacific Pipeline Virtual System Revenue (undefined) Forecast, by Application 2020 & 2033
Frequently Asked Questions
1. What is the projected Compound Annual Growth Rate (CAGR) of the Pipeline Virtual System?
The projected CAGR is approximately 8.82%.
2. Which companies are prominent players in the Pipeline Virtual System?
Key companies in the market include GE Oil & Gas, Hexagon Composites ASA, Luxfer Holdings PLC, Galileo Technologies S.A., Pentagon Energy LLC, LightSail Energy, Cimarron Composites, Xpress Natural Gas LLC, NG Advantage LLC, Compass Natural Gas, Broadwind Energy, Inc., REV LNG, LLC, Global Partners LP, CNG Services, GAS MALAYSIA.
3. What are the main segments of the Pipeline Virtual System?
The market segments include Application, Types.
4. Can you provide details about the market size?
The market size is estimated to be USD XXX N/A as of 2022.
5. What are some drivers contributing to market growth?
N/A
6. What are the notable trends driving market growth?
N/A
7. Are there any restraints impacting market growth?
N/A
8. Can you provide examples of recent developments in the market?
N/A
9. What pricing options are available for accessing the report?
Pricing options include single-user, multi-user, and enterprise licenses priced at USD 4900.00, USD 7350.00, and USD 9800.00 respectively.
10. Is the market size provided in terms of value or volume?
The market size is provided in terms of value, measured in N/A.
11. Are there any specific market keywords associated with the report?
Yes, the market keyword associated with the report is "Pipeline Virtual System," which aids in identifying and referencing the specific market segment covered.
12. How do I determine which pricing option suits my needs best?
The pricing options vary based on user requirements and access needs. Individual users may opt for single-user licenses, while businesses requiring broader access may choose multi-user or enterprise licenses for cost-effective access to the report.
13. Are there any additional resources or data provided in the Pipeline Virtual System report?
While the report offers comprehensive insights, it's advisable to review the specific contents or supplementary materials provided to ascertain if additional resources or data are available.
14. How can I stay updated on further developments or reports in the Pipeline Virtual System?
To stay informed about further developments, trends, and reports in the Pipeline Virtual System, consider subscribing to industry newsletters, following relevant companies and organizations, or regularly checking reputable industry news sources and publications.
Methodology
Step 1 - Identification of Relevant Samples Size from Population Database


Step 2 - Approaches for Defining Global Market Size (Value, Volume* & Price*)

Note*: In applicable scenarios
Step 3 - Data Sources
Primary Research
- Web Analytics
- Survey Reports
- Research Institute
- Latest Research Reports
- Opinion Leaders
Secondary Research
- Annual Reports
- White Paper
- Latest Press Release
- Industry Association
- Paid Database
- Investor Presentations

Step 4 - Data Triangulation
Involves using different sources of information in order to increase the validity of a study
These sources are likely to be stakeholders in a program - participants, other researchers, program staff, other community members, and so on.
Then we put all data in single framework & apply various statistical tools to find out the dynamic on the market.
During the analysis stage, feedback from the stakeholder groups would be compared to determine areas of agreement as well as areas of divergence