

Key Insights
The Global Plasma Therapy Market is projected for substantial growth, expected to reach $436.2 million by 2025. This expansion is driven by a robust Compound Annual Growth Rate (CAGR) of 14.2% from the 2025 base year, indicating strong market momentum. Key growth factors include the rising incidence of chronic diseases necessitating plasma-derived therapies, technological advancements in fractionation improving product efficacy, and increasing healthcare professional and patient awareness of plasma product benefits. Demand for immunoglobulins in treating autoimmune disorders and primary immunodeficiencies remains high, alongside essential applications of albumin in critical care and plasma-derived factor VIII for hemophilia management.
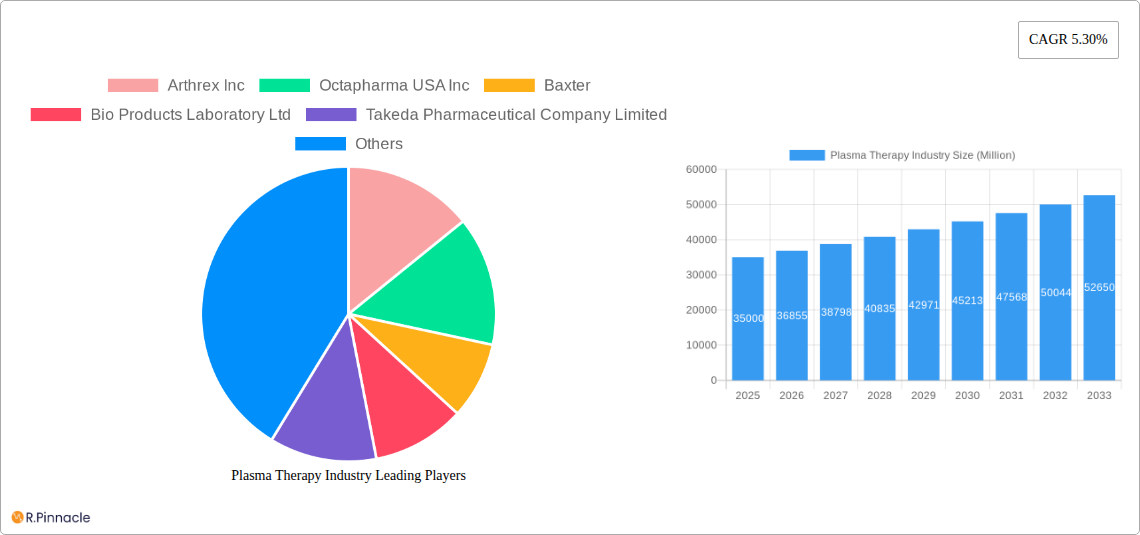
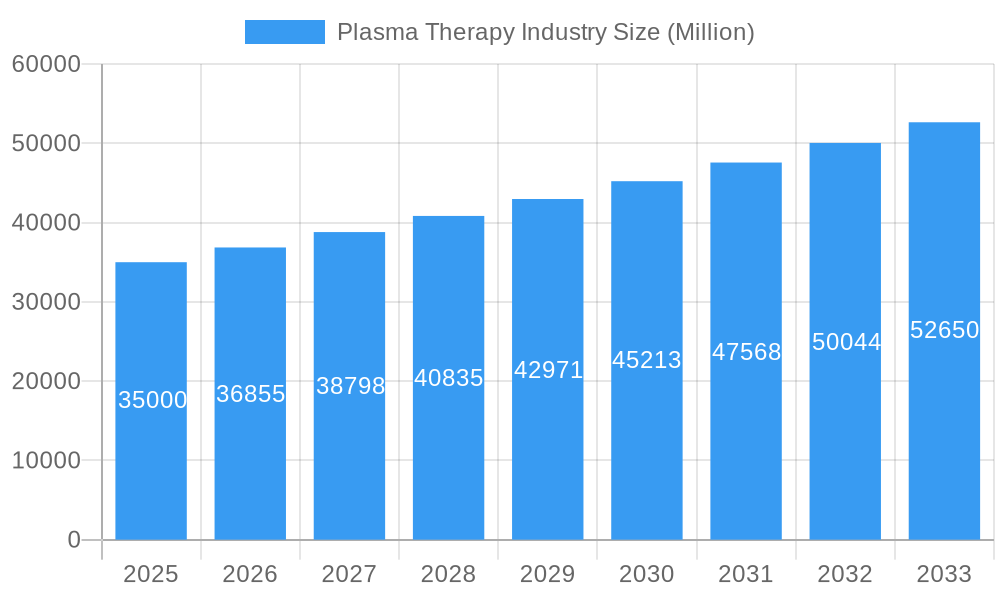
Plasma Therapy Industry Market Size (In Million)
The competitive market features leading companies such as Grifols S.A., CSL Limited, and Takeda Pharmaceutical Company Limited. While stringent regulations for plasma collection and product approval, along with potential donation risks and shortages, present market challenges, ongoing research into novel plasma-derived protein applications and enhanced collection methods are anticipated to address these concerns. North America and Europe currently lead the market, supported by advanced healthcare systems and large patient bases. The Asia Pacific region, particularly China and Japan, is forecast to experience the fastest growth, fueled by improved healthcare accessibility and rising disposable incomes.
Plasma Therapy Industry Company Market Share
Comprehensive Plasma Therapy Industry Report: Market Insights, Trends, and Future Outlook (2019–2033)
Unlock critical insights into the dynamic plasma therapy market with this in-depth report. Covering the historical period (2019–2024), base year (2025), and forecast period (2025–2033), this analysis provides a detailed examination of market structure, growth drivers, regional dominance, and key players shaping the future of plasma-derived medicines. With an estimated market size of XX Million in the base year, this report is essential for industry professionals seeking to understand current trends and capitalize on emerging opportunities in immunoglobulin, albumin, and plasma derived factor VIII segments, addressing applications like hemophilia, idiopathic thrombocytopenic purpura, and primary immunodeficiencies.
Plasma Therapy Industry Market Structure & Innovation Trends
The plasma therapy industry is characterized by a moderate to high market concentration, with a few dominant players accounting for a significant portion of the global market share. Innovation is a key differentiator, driven by advancements in plasma fractionation techniques, diagnostic tools, and novel therapeutic applications. Regulatory frameworks, primarily overseen by bodies like the FDA and EMA, play a crucial role in ensuring product safety, efficacy, and market access, influencing R&D investments and market entry strategies. The landscape also sees a growing emphasis on patient-centric approaches and personalized medicine.
- Market Concentration: Dominated by multinational corporations with substantial manufacturing capabilities and established distribution networks.
- Innovation Drivers:
- Development of novel therapeutic proteins.
- Improved plasma collection and processing technologies.
- Expansion of treatment indications for existing plasma-derived therapies.
- Adoption of advanced analytics for disease management and patient identification.
- Regulatory Frameworks: Stringent approval processes, post-market surveillance, and evolving guidelines for plasma safety and efficacy.
- Product Substitutes: Emerging gene therapies and biosimil alternatives present potential long-term substitutes, though currently plasma-derived therapies remain the standard of care for many conditions.
- End-User Demographics: Primarily comprises patients with rare genetic disorders, autoimmune diseases, and critical care needs, necessitating specialized treatment protocols.
- M&A Activities: Driven by the need to expand product portfolios, secure plasma supply chains, and gain access to new technologies and markets. Notable M&A deal values are estimated to be in the hundreds of Millions.
Plasma Therapy Industry Market Dynamics & Trends
The plasma therapy market is poised for robust growth, driven by a confluence of factors including the increasing prevalence of chronic and rare diseases, an aging global population, and significant advancements in medical research and technology. The rising incidence of conditions such as primary immunodeficiencies and hemophilia, coupled with a growing awareness and improved diagnosis rates, are contributing to a sustained demand for plasma-derived therapies. Technological disruptions are at the forefront, with innovations in plasma collection systems and fractionation processes enhancing efficiency, safety, and the yield of vital therapeutic proteins.
Furthermore, shifting consumer preferences towards more effective and less invasive treatment options, alongside a greater emphasis on patient quality of life, are accelerating the adoption of advanced plasma therapies. The competitive dynamics within the industry are intensifying, as established players and emerging companies vie for market share through product differentiation, strategic partnerships, and expansion into underserved regions. The global market penetration of plasma therapies is steadily increasing, reflecting their critical role in modern healthcare.
Key market growth drivers include:
- Increasing Prevalence of Rare Diseases: Conditions like Hemophilia and Primary Immunodeficiencies are seeing higher diagnosis rates, boosting demand.
- Technological Advancements: Innovations in plasma fractionation and collection methods are improving product quality and availability.
- Aging Global Population: Older demographics are more susceptible to chronic diseases requiring plasma therapies.
- Enhanced Diagnostic Capabilities: Better tools for identifying and diagnosing rare conditions lead to earlier treatment initiation.
- Growing Healthcare Expenditure: Increased investment in healthcare infrastructure globally facilitates access to advanced therapies.
The Compound Annual Growth Rate (CAGR) for the plasma therapy market is projected to be in the range of 5% to 7% over the forecast period, underscoring its significant expansion potential.
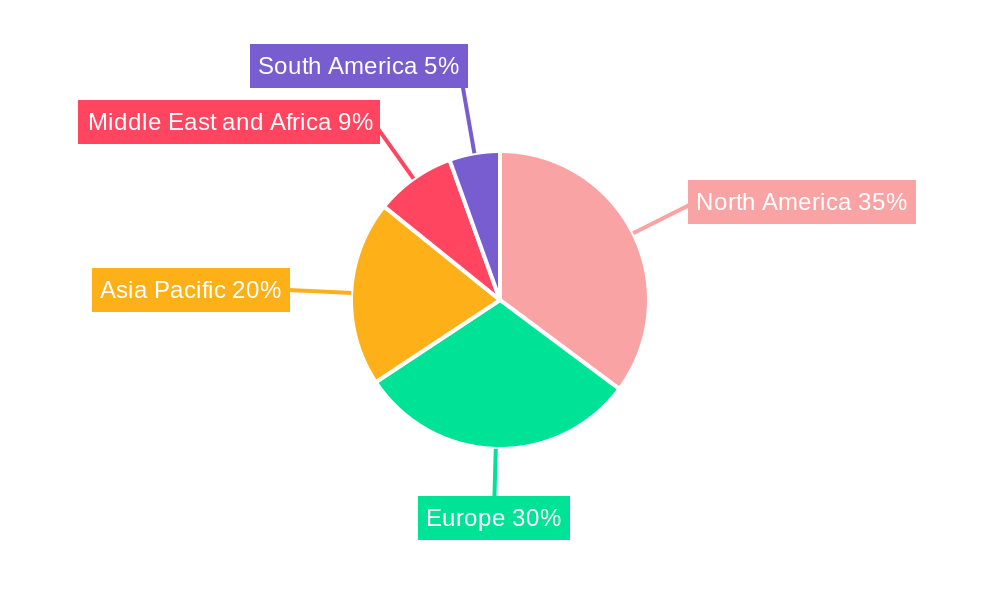
Dominant Regions & Segments in Plasma Therapy Industry
North America, particularly the United States, stands as the dominant region in the global plasma therapy market. This dominance is attributed to several key factors, including a well-established healthcare infrastructure, high per capita healthcare spending, advanced research and development capabilities, and a robust regulatory environment that fosters innovation and market access for plasma-derived products. The presence of major plasma fractionation centers and leading pharmaceutical companies in the region further solidifies its leadership position.
Within this region, the Immunoglobulin segment commands the largest market share. This is driven by the widespread application of immunoglobulins in treating a broad spectrum of conditions, most notably Primary Immunodeficiencies (PIDs), autoimmune disorders, and neurological conditions. The increasing diagnosis rates of PIDs and the growing use of immunoglobulin therapy as a life-sustaining treatment for these patients are primary growth catalysts.
- Leading Region: North America
- Key Drivers:
- High per capita healthcare expenditure.
- Advanced research and development ecosystem.
- Favorable reimbursement policies for specialty drugs.
- Presence of leading plasma fractionation companies.
- Extensive plasma donation networks.
- Key Drivers:
- Dominant Product Segment: Immunoglobulin
- Detailed Dominance Analysis:
- Primary Immunodeficiencies (PIDs): A significant and growing indication, with increasing awareness and improved diagnostic tools leading to higher treatment rates.
- Autoimmune Disorders: Expanding therapeutic applications in conditions like Guillain-Barré syndrome, myasthenia gravis, and various neuropathies.
- Neurological Conditions: Crucial for managing conditions such as multifocal motor neuropathy and chronic inflammatory demyelinating polyneuropathy.
- Technological Advancements: Continuous innovation in IVIG and SCIg formulations enhances patient convenience and treatment efficacy.
- Market Size: Estimated to be in the tens of billions of US dollars for the immunoglobulin segment alone.
- Detailed Dominance Analysis:
- Dominant Application Segment: Primary Immunodeficiencies
- Detailed Dominance Analysis:
- Lifelong Treatment Need: PIDs require lifelong immunoglobulin replacement therapy, ensuring a consistent and substantial demand.
- Genetic Predisposition: The inherent nature of these disorders necessitates external therapeutic intervention.
- Improved Quality of Life: Immunoglobulin therapy significantly reduces infection rates and improves the overall health outcomes and quality of life for PID patients.
- Increased Diagnosis: Greater awareness and genetic screening contribute to a rising number of diagnosed cases.
- Market Penetration: High penetration due to being the primary treatment modality.
- Detailed Dominance Analysis:
The Albumin segment also represents a substantial market, crucial for critical care applications such as treating hypovolemic shock, burns, and liver cirrhosis. The Plasma Derived Factor VIII segment, while addressing a more niche but critical application for hemophilia A, continues to be vital, although facing competition from recombinant alternatives.
Plasma Therapy Industry Product Innovations
Product innovations in the plasma therapy industry are centered on enhancing efficacy, safety, and patient convenience. Advancements in fractionation technologies are leading to purer and more potent plasma-derived products, such as highly concentrated immunoglobulins and albumin formulations. Innovations in delivery systems, including subcutaneous immunoglobulin (SCIG) therapies, are revolutionizing treatment by offering patients greater flexibility and reducing the frequency of administration. Furthermore, research into novel plasma proteins for treating emerging or rare diseases is expanding the therapeutic horizon. These innovations provide a significant competitive advantage by addressing unmet clinical needs and improving patient adherence.
Report Scope & Segmentation Analysis
This report provides a comprehensive analysis of the global plasma therapy market, segmented by product type and application. The product segmentation includes Immunoglobulin, Albumin, Plasma Derived Factor VIII, and Other Products. The application segmentation encompasses Hemophilia, Idiopathic Thrombocytopenic Purpura, Primary Immunodeficiencies, and Other Applications. Each segment is analyzed in detail, including current market sizes, projected growth rates, and key market dynamics. The Immunoglobulin segment is projected to experience a CAGR of XX% from 2025-2033, reaching an estimated market size of XX Million by 2033. Albumin is expected to grow at a CAGR of XX%, while Plasma Derived Factor VIII is projected to grow at XX%. The Primary Immunodeficiencies application segment is anticipated to lead growth due to its critical and lifelong treatment needs.
Key Drivers of Plasma Therapy Industry Growth
The plasma therapy industry is propelled by several key growth drivers:
- Increasing Incidence of Rare and Chronic Diseases: A rising global prevalence of conditions like primary immunodeficiencies, hemophilia, and autoimmune disorders directly fuels demand for plasma-derived therapies.
- Technological Advancements in Plasma Fractionation: Continuous innovation in processing technologies leads to higher yields, improved purity, and the development of novel plasma protein therapeutics.
- Aging Global Population: The demographic shift towards an older population increases the susceptibility to chronic diseases that often require plasma-based treatments.
- Enhanced Diagnostic Capabilities and Awareness: Improved diagnostic tools and increased awareness among healthcare professionals and the public lead to earlier and more accurate diagnoses, facilitating timely treatment.
- Government Initiatives and Support: Favorable policies, funding for research, and initiatives aimed at improving blood and plasma collection infrastructure in various countries contribute to market expansion.
Challenges in the Plasma Therapy Industry Sector
Despite its growth, the plasma therapy industry faces several significant challenges:
- Plasma Supply Chain Volatility: Reliance on human plasma as a raw material makes the supply chain susceptible to disruptions caused by epidemics, donor fatigue, and geopolitical factors.
- High Manufacturing Costs: The complex and resource-intensive process of plasma fractionation contributes to high production costs and consequently, the high price of plasma-derived therapies.
- Stringent Regulatory Hurdles: Navigating the rigorous and lengthy approval processes for new plasma-derived products and maintaining compliance with evolving safety regulations can be challenging.
- Competition from Recombinant Therapies: For certain indications, recombinant alternatives are emerging, offering potential competition to plasma-derived products.
- Public Perception and Donor Recruitment: Maintaining a consistent and adequate supply of plasma requires effective donor recruitment strategies and positive public perception regarding plasma donation.
Emerging Opportunities in Plasma Therapy Industry
The plasma therapy sector is ripe with emerging opportunities driven by innovation and unmet medical needs:
- Expansion into New Therapeutic Areas: Ongoing research into the diverse properties of plasma proteins opens doors for novel applications in treating a wider range of diseases, including neurological disorders and inflammatory conditions.
- Development of Advanced Delivery Systems: Innovations in subcutaneous immunoglobulin (SCIG) and other patient-friendly delivery methods are improving treatment adherence and patient experience.
- Growth in Emerging Markets: Increasing healthcare expenditure and improving access to advanced medical treatments in developing economies present significant growth potential.
- Personalized Medicine Approaches: Tailoring plasma therapy based on individual patient profiles and disease characteristics offers opportunities for enhanced treatment efficacy.
- Technological Advancements in Plasma Collection: Next-generation plasma collection systems that enhance donor comfort and efficiency can boost plasma supply.
Leading Players in the Plasma Therapy Industry Market
- Arthrex Inc
- Octapharma USA Inc
- Baxter
- Bio Products Laboratory Ltd
- Takeda Pharmaceutical Company Limited
- CSL Limited
- ADMA Biologics Inc
- Taibang Biological Group Co Ltd
- Grifols S A
- Johnson and Johnson (DePuy Synthes)
- Biotest UK
- Kedrion S p A
Key Developments in Plasma Therapy Industry Industry
- October 2022: Grifols inaugurated its new state-of-the-art manufacturing plant in Ireland to meet the growing global demand for plasma medicines. Grifols' Dublin manufacturing facility triples the annual filling capacity of its innovative, flexible container, ALBUTEIN FlexBag, to meet the rising demand for albumin, the most abundant plasma protein.
- March 2022: Food and Drug Administration (FDA) cleared the new plasma collection system, Rika Plasma Donation System (Rika), developed by Terumo Blood and Cell Technologies (Terumo BCT), a medical technology company. Rika is a next-generation automated technology focused on the experience of plasma center employees and donors.
Future Outlook for Plasma Therapy Industry Market
The future outlook for the plasma therapy market remains exceptionally bright, driven by a sustained and growing demand for life-saving plasma-derived medicines. Innovations in product development, particularly in the immunoglobulin and albumin segments, will continue to expand therapeutic applications and improve patient outcomes. The market is expected to benefit from advancements in plasma collection technologies that enhance donor experience and increase plasma yields, addressing potential supply chain concerns. Strategic collaborations, mergers, and acquisitions will likely continue to shape the competitive landscape, consolidating market power and fostering further R&D investment. Emerging markets present significant untapped potential, with increasing healthcare infrastructure and patient access contributing to future growth. The ongoing evolution of regulatory frameworks will also play a crucial role in shaping market dynamics, ensuring product safety and facilitating innovation.
Plasma Therapy Industry Segmentation
-
1. Product
- 1.1. Immunoglobulin
- 1.2. Albumin
- 1.3. Plasma Derived Factor VIII
- 1.4. Other Products
-
2. Application
- 2.1. Hemophilia
- 2.2. Idiopathic Thrombocytopenic Purpura
- 2.3. Primary Immunodeficiencies
- 2.4. Other Applications
Plasma Therapy Industry Segmentation By Geography
-
1. North America
- 1.1. United States
- 1.2. Canada
- 1.3. Mexico
-
2. Europe
- 2.1. Germany
- 2.2. United Kingdom
- 2.3. France
- 2.4. Italy
- 2.5. Spain
- 2.6. Rest of Europe
-
3. Asia Pacific
- 3.1. China
- 3.2. Japan
- 3.3. India
- 3.4. Australia
- 3.5. South Korea
- 3.6. Rest of Asia Pacific
-
4. Middle East and Africa
- 4.1. GCC
- 4.2. South Africa
- 4.3. Rest of Middle East and Africa
-
5. South America
- 5.1. Brazil
- 5.2. Argentina
- 5.3. Rest of South America
Plasma Therapy Industry Regional Market Share
Geographic Coverage of Plasma Therapy Industry
Plasma Therapy Industry REPORT HIGHLIGHTS
| Aspects | Details |
|---|---|
| Study Period | 2020-2034 |
| Base Year | 2025 |
| Estimated Year | 2026 |
| Forecast Period | 2026-2034 |
| Historical Period | 2020-2025 |
| Growth Rate | CAGR of 14.2% from 2020-2034 |
| Segmentation |
|
Table of Contents
- 1. Introduction
- 1.1. Research Scope
- 1.2. Market Segmentation
- 1.3. Research Objective
- 1.4. Definitions and Assumptions
- 2. Executive Summary
- 2.1. Market Snapshot
- 3. Market Dynamics
- 3.1. Market Drivers
- 3.2. Market Restrains
- 3.3. Market Trends
- 3.4. Market Opportunities
- 4. Market Factor Analysis
- 4.1. Porters Five Forces
- 4.1.1. Bargaining Power of Suppliers
- 4.1.2. Bargaining Power of Buyers
- 4.1.3. Threat of New Entrants
- 4.1.4. Threat of Substitutes
- 4.1.5. Competitive Rivalry
- 4.2. PESTEL analysis
- 4.3. BCG Analysis
- 4.3.1. Stars (High Growth, High Market Share)
- 4.3.2. Cash Cows (Low Growth, High Market Share)
- 4.3.3. Question Mark (High Growth, Low Market Share)
- 4.3.4. Dogs (Low Growth, Low Market Share)
- 4.4. Ansoff Matrix Analysis
- 4.5. Supply Chain Analysis
- 4.6. Regulatory Landscape
- 4.7. Current Market Potential and Opportunity Assessment (TAM–SAM–SOM Framework)
- 4.8. PRI Analyst Note
- 4.1. Porters Five Forces
- 5. Market Analysis, Insights and Forecast 2021-2033
- 5.1. Market Analysis, Insights and Forecast - by Product
- 5.1.1. Immunoglobulin
- 5.1.2. Albumin
- 5.1.3. Plasma Derived Factor VIII
- 5.1.4. Other Products
- 5.2. Market Analysis, Insights and Forecast - by Application
- 5.2.1. Hemophilia
- 5.2.2. Idiopathic Thrombocytopenic Purpura
- 5.2.3. Primary Immunodeficiencies
- 5.2.4. Other Applications
- 5.3. Market Analysis, Insights and Forecast - by Region
- 5.3.1. North America
- 5.3.2. Europe
- 5.3.3. Asia Pacific
- 5.3.4. Middle East and Africa
- 5.3.5. South America
- 5.1. Market Analysis, Insights and Forecast - by Product
- 6. Global Plasma Therapy Industry Analysis, Insights and Forecast, 2021-2033
- 6.1. Market Analysis, Insights and Forecast - by Product
- 6.1.1. Immunoglobulin
- 6.1.2. Albumin
- 6.1.3. Plasma Derived Factor VIII
- 6.1.4. Other Products
- 6.2. Market Analysis, Insights and Forecast - by Application
- 6.2.1. Hemophilia
- 6.2.2. Idiopathic Thrombocytopenic Purpura
- 6.2.3. Primary Immunodeficiencies
- 6.2.4. Other Applications
- 6.1. Market Analysis, Insights and Forecast - by Product
- 7. North America Plasma Therapy Industry Analysis, Insights and Forecast, 2020-2032
- 7.1. Market Analysis, Insights and Forecast - by Product
- 7.1.1. Immunoglobulin
- 7.1.2. Albumin
- 7.1.3. Plasma Derived Factor VIII
- 7.1.4. Other Products
- 7.2. Market Analysis, Insights and Forecast - by Application
- 7.2.1. Hemophilia
- 7.2.2. Idiopathic Thrombocytopenic Purpura
- 7.2.3. Primary Immunodeficiencies
- 7.2.4. Other Applications
- 7.1. Market Analysis, Insights and Forecast - by Product
- 8. Europe Plasma Therapy Industry Analysis, Insights and Forecast, 2020-2032
- 8.1. Market Analysis, Insights and Forecast - by Product
- 8.1.1. Immunoglobulin
- 8.1.2. Albumin
- 8.1.3. Plasma Derived Factor VIII
- 8.1.4. Other Products
- 8.2. Market Analysis, Insights and Forecast - by Application
- 8.2.1. Hemophilia
- 8.2.2. Idiopathic Thrombocytopenic Purpura
- 8.2.3. Primary Immunodeficiencies
- 8.2.4. Other Applications
- 8.1. Market Analysis, Insights and Forecast - by Product
- 9. Asia Pacific Plasma Therapy Industry Analysis, Insights and Forecast, 2020-2032
- 9.1. Market Analysis, Insights and Forecast - by Product
- 9.1.1. Immunoglobulin
- 9.1.2. Albumin
- 9.1.3. Plasma Derived Factor VIII
- 9.1.4. Other Products
- 9.2. Market Analysis, Insights and Forecast - by Application
- 9.2.1. Hemophilia
- 9.2.2. Idiopathic Thrombocytopenic Purpura
- 9.2.3. Primary Immunodeficiencies
- 9.2.4. Other Applications
- 9.1. Market Analysis, Insights and Forecast - by Product
- 10. Middle East and Africa Plasma Therapy Industry Analysis, Insights and Forecast, 2020-2032
- 10.1. Market Analysis, Insights and Forecast - by Product
- 10.1.1. Immunoglobulin
- 10.1.2. Albumin
- 10.1.3. Plasma Derived Factor VIII
- 10.1.4. Other Products
- 10.2. Market Analysis, Insights and Forecast - by Application
- 10.2.1. Hemophilia
- 10.2.2. Idiopathic Thrombocytopenic Purpura
- 10.2.3. Primary Immunodeficiencies
- 10.2.4. Other Applications
- 10.1. Market Analysis, Insights and Forecast - by Product
- 11. South America Plasma Therapy Industry Analysis, Insights and Forecast, 2020-2032
- 11.1. Market Analysis, Insights and Forecast - by Product
- 11.1.1. Immunoglobulin
- 11.1.2. Albumin
- 11.1.3. Plasma Derived Factor VIII
- 11.1.4. Other Products
- 11.2. Market Analysis, Insights and Forecast - by Application
- 11.2.1. Hemophilia
- 11.2.2. Idiopathic Thrombocytopenic Purpura
- 11.2.3. Primary Immunodeficiencies
- 11.2.4. Other Applications
- 11.1. Market Analysis, Insights and Forecast - by Product
- 12. Competitive Analysis
- 12.1. Company Profiles
- 12.1.1 Arthrex Inc
- 12.1.1.1. Company Overview
- 12.1.1.2. Products
- 12.1.1.3. Company Financials
- 12.1.1.4. SWOT Analysis
- 12.1.2 Octapharma USA Inc
- 12.1.2.1. Company Overview
- 12.1.2.2. Products
- 12.1.2.3. Company Financials
- 12.1.2.4. SWOT Analysis
- 12.1.3 Baxter
- 12.1.3.1. Company Overview
- 12.1.3.2. Products
- 12.1.3.3. Company Financials
- 12.1.3.4. SWOT Analysis
- 12.1.4 Bio Products Laboratory Ltd
- 12.1.4.1. Company Overview
- 12.1.4.2. Products
- 12.1.4.3. Company Financials
- 12.1.4.4. SWOT Analysis
- 12.1.5 Takeda Pharmaceutical Company Limited
- 12.1.5.1. Company Overview
- 12.1.5.2. Products
- 12.1.5.3. Company Financials
- 12.1.5.4. SWOT Analysis
- 12.1.6 CSL Limited
- 12.1.6.1. Company Overview
- 12.1.6.2. Products
- 12.1.6.3. Company Financials
- 12.1.6.4. SWOT Analysis
- 12.1.7 ADMA Biologics Inc
- 12.1.7.1. Company Overview
- 12.1.7.2. Products
- 12.1.7.3. Company Financials
- 12.1.7.4. SWOT Analysis
- 12.1.8 Taibang Biological Group Co Ltd
- 12.1.8.1. Company Overview
- 12.1.8.2. Products
- 12.1.8.3. Company Financials
- 12.1.8.4. SWOT Analysis
- 12.1.9 Grifols S A
- 12.1.9.1. Company Overview
- 12.1.9.2. Products
- 12.1.9.3. Company Financials
- 12.1.9.4. SWOT Analysis
- 12.1.10 Johnson and Johnson (DePuy Synthes)
- 12.1.10.1. Company Overview
- 12.1.10.2. Products
- 12.1.10.3. Company Financials
- 12.1.10.4. SWOT Analysis
- 12.1.11 Biotest UK
- 12.1.11.1. Company Overview
- 12.1.11.2. Products
- 12.1.11.3. Company Financials
- 12.1.11.4. SWOT Analysis
- 12.1.12 Kedrion S p A
- 12.1.12.1. Company Overview
- 12.1.12.2. Products
- 12.1.12.3. Company Financials
- 12.1.12.4. SWOT Analysis
- 12.1.1 Arthrex Inc
- 12.2. Market Entropy
- 12.2.1 Company's Key Areas Served
- 12.2.2 Recent Developments
- 12.3. Company Market Share Analysis 2025
- 12.3.1 Top 5 Companies Market Share Analysis
- 12.3.2 Top 3 Companies Market Share Analysis
- 12.4. List of Potential Customers
- 13. Research Methodology
List of Figures
- Figure 1: Global Plasma Therapy Industry Revenue Breakdown (million, %) by Region 2025 & 2033
- Figure 2: Global Plasma Therapy Industry Volume Breakdown (K Unit, %) by Region 2025 & 2033
- Figure 3: North America Plasma Therapy Industry Revenue (million), by Product 2025 & 2033
- Figure 4: North America Plasma Therapy Industry Volume (K Unit), by Product 2025 & 2033
- Figure 5: North America Plasma Therapy Industry Revenue Share (%), by Product 2025 & 2033
- Figure 6: North America Plasma Therapy Industry Volume Share (%), by Product 2025 & 2033
- Figure 7: North America Plasma Therapy Industry Revenue (million), by Application 2025 & 2033
- Figure 8: North America Plasma Therapy Industry Volume (K Unit), by Application 2025 & 2033
- Figure 9: North America Plasma Therapy Industry Revenue Share (%), by Application 2025 & 2033
- Figure 10: North America Plasma Therapy Industry Volume Share (%), by Application 2025 & 2033
- Figure 11: North America Plasma Therapy Industry Revenue (million), by Country 2025 & 2033
- Figure 12: North America Plasma Therapy Industry Volume (K Unit), by Country 2025 & 2033
- Figure 13: North America Plasma Therapy Industry Revenue Share (%), by Country 2025 & 2033
- Figure 14: North America Plasma Therapy Industry Volume Share (%), by Country 2025 & 2033
- Figure 15: Europe Plasma Therapy Industry Revenue (million), by Product 2025 & 2033
- Figure 16: Europe Plasma Therapy Industry Volume (K Unit), by Product 2025 & 2033
- Figure 17: Europe Plasma Therapy Industry Revenue Share (%), by Product 2025 & 2033
- Figure 18: Europe Plasma Therapy Industry Volume Share (%), by Product 2025 & 2033
- Figure 19: Europe Plasma Therapy Industry Revenue (million), by Application 2025 & 2033
- Figure 20: Europe Plasma Therapy Industry Volume (K Unit), by Application 2025 & 2033
- Figure 21: Europe Plasma Therapy Industry Revenue Share (%), by Application 2025 & 2033
- Figure 22: Europe Plasma Therapy Industry Volume Share (%), by Application 2025 & 2033
- Figure 23: Europe Plasma Therapy Industry Revenue (million), by Country 2025 & 2033
- Figure 24: Europe Plasma Therapy Industry Volume (K Unit), by Country 2025 & 2033
- Figure 25: Europe Plasma Therapy Industry Revenue Share (%), by Country 2025 & 2033
- Figure 26: Europe Plasma Therapy Industry Volume Share (%), by Country 2025 & 2033
- Figure 27: Asia Pacific Plasma Therapy Industry Revenue (million), by Product 2025 & 2033
- Figure 28: Asia Pacific Plasma Therapy Industry Volume (K Unit), by Product 2025 & 2033
- Figure 29: Asia Pacific Plasma Therapy Industry Revenue Share (%), by Product 2025 & 2033
- Figure 30: Asia Pacific Plasma Therapy Industry Volume Share (%), by Product 2025 & 2033
- Figure 31: Asia Pacific Plasma Therapy Industry Revenue (million), by Application 2025 & 2033
- Figure 32: Asia Pacific Plasma Therapy Industry Volume (K Unit), by Application 2025 & 2033
- Figure 33: Asia Pacific Plasma Therapy Industry Revenue Share (%), by Application 2025 & 2033
- Figure 34: Asia Pacific Plasma Therapy Industry Volume Share (%), by Application 2025 & 2033
- Figure 35: Asia Pacific Plasma Therapy Industry Revenue (million), by Country 2025 & 2033
- Figure 36: Asia Pacific Plasma Therapy Industry Volume (K Unit), by Country 2025 & 2033
- Figure 37: Asia Pacific Plasma Therapy Industry Revenue Share (%), by Country 2025 & 2033
- Figure 38: Asia Pacific Plasma Therapy Industry Volume Share (%), by Country 2025 & 2033
- Figure 39: Middle East and Africa Plasma Therapy Industry Revenue (million), by Product 2025 & 2033
- Figure 40: Middle East and Africa Plasma Therapy Industry Volume (K Unit), by Product 2025 & 2033
- Figure 41: Middle East and Africa Plasma Therapy Industry Revenue Share (%), by Product 2025 & 2033
- Figure 42: Middle East and Africa Plasma Therapy Industry Volume Share (%), by Product 2025 & 2033
- Figure 43: Middle East and Africa Plasma Therapy Industry Revenue (million), by Application 2025 & 2033
- Figure 44: Middle East and Africa Plasma Therapy Industry Volume (K Unit), by Application 2025 & 2033
- Figure 45: Middle East and Africa Plasma Therapy Industry Revenue Share (%), by Application 2025 & 2033
- Figure 46: Middle East and Africa Plasma Therapy Industry Volume Share (%), by Application 2025 & 2033
- Figure 47: Middle East and Africa Plasma Therapy Industry Revenue (million), by Country 2025 & 2033
- Figure 48: Middle East and Africa Plasma Therapy Industry Volume (K Unit), by Country 2025 & 2033
- Figure 49: Middle East and Africa Plasma Therapy Industry Revenue Share (%), by Country 2025 & 2033
- Figure 50: Middle East and Africa Plasma Therapy Industry Volume Share (%), by Country 2025 & 2033
- Figure 51: South America Plasma Therapy Industry Revenue (million), by Product 2025 & 2033
- Figure 52: South America Plasma Therapy Industry Volume (K Unit), by Product 2025 & 2033
- Figure 53: South America Plasma Therapy Industry Revenue Share (%), by Product 2025 & 2033
- Figure 54: South America Plasma Therapy Industry Volume Share (%), by Product 2025 & 2033
- Figure 55: South America Plasma Therapy Industry Revenue (million), by Application 2025 & 2033
- Figure 56: South America Plasma Therapy Industry Volume (K Unit), by Application 2025 & 2033
- Figure 57: South America Plasma Therapy Industry Revenue Share (%), by Application 2025 & 2033
- Figure 58: South America Plasma Therapy Industry Volume Share (%), by Application 2025 & 2033
- Figure 59: South America Plasma Therapy Industry Revenue (million), by Country 2025 & 2033
- Figure 60: South America Plasma Therapy Industry Volume (K Unit), by Country 2025 & 2033
- Figure 61: South America Plasma Therapy Industry Revenue Share (%), by Country 2025 & 2033
- Figure 62: South America Plasma Therapy Industry Volume Share (%), by Country 2025 & 2033
List of Tables
- Table 1: Global Plasma Therapy Industry Revenue million Forecast, by Product 2020 & 2033
- Table 2: Global Plasma Therapy Industry Volume K Unit Forecast, by Product 2020 & 2033
- Table 3: Global Plasma Therapy Industry Revenue million Forecast, by Application 2020 & 2033
- Table 4: Global Plasma Therapy Industry Volume K Unit Forecast, by Application 2020 & 2033
- Table 5: Global Plasma Therapy Industry Revenue million Forecast, by Region 2020 & 2033
- Table 6: Global Plasma Therapy Industry Volume K Unit Forecast, by Region 2020 & 2033
- Table 7: Global Plasma Therapy Industry Revenue million Forecast, by Product 2020 & 2033
- Table 8: Global Plasma Therapy Industry Volume K Unit Forecast, by Product 2020 & 2033
- Table 9: Global Plasma Therapy Industry Revenue million Forecast, by Application 2020 & 2033
- Table 10: Global Plasma Therapy Industry Volume K Unit Forecast, by Application 2020 & 2033
- Table 11: Global Plasma Therapy Industry Revenue million Forecast, by Country 2020 & 2033
- Table 12: Global Plasma Therapy Industry Volume K Unit Forecast, by Country 2020 & 2033
- Table 13: United States Plasma Therapy Industry Revenue (million) Forecast, by Application 2020 & 2033
- Table 14: United States Plasma Therapy Industry Volume (K Unit) Forecast, by Application 2020 & 2033
- Table 15: Canada Plasma Therapy Industry Revenue (million) Forecast, by Application 2020 & 2033
- Table 16: Canada Plasma Therapy Industry Volume (K Unit) Forecast, by Application 2020 & 2033
- Table 17: Mexico Plasma Therapy Industry Revenue (million) Forecast, by Application 2020 & 2033
- Table 18: Mexico Plasma Therapy Industry Volume (K Unit) Forecast, by Application 2020 & 2033
- Table 19: Global Plasma Therapy Industry Revenue million Forecast, by Product 2020 & 2033
- Table 20: Global Plasma Therapy Industry Volume K Unit Forecast, by Product 2020 & 2033
- Table 21: Global Plasma Therapy Industry Revenue million Forecast, by Application 2020 & 2033
- Table 22: Global Plasma Therapy Industry Volume K Unit Forecast, by Application 2020 & 2033
- Table 23: Global Plasma Therapy Industry Revenue million Forecast, by Country 2020 & 2033
- Table 24: Global Plasma Therapy Industry Volume K Unit Forecast, by Country 2020 & 2033
- Table 25: Germany Plasma Therapy Industry Revenue (million) Forecast, by Application 2020 & 2033
- Table 26: Germany Plasma Therapy Industry Volume (K Unit) Forecast, by Application 2020 & 2033
- Table 27: United Kingdom Plasma Therapy Industry Revenue (million) Forecast, by Application 2020 & 2033
- Table 28: United Kingdom Plasma Therapy Industry Volume (K Unit) Forecast, by Application 2020 & 2033
- Table 29: France Plasma Therapy Industry Revenue (million) Forecast, by Application 2020 & 2033
- Table 30: France Plasma Therapy Industry Volume (K Unit) Forecast, by Application 2020 & 2033
- Table 31: Italy Plasma Therapy Industry Revenue (million) Forecast, by Application 2020 & 2033
- Table 32: Italy Plasma Therapy Industry Volume (K Unit) Forecast, by Application 2020 & 2033
- Table 33: Spain Plasma Therapy Industry Revenue (million) Forecast, by Application 2020 & 2033
- Table 34: Spain Plasma Therapy Industry Volume (K Unit) Forecast, by Application 2020 & 2033
- Table 35: Rest of Europe Plasma Therapy Industry Revenue (million) Forecast, by Application 2020 & 2033
- Table 36: Rest of Europe Plasma Therapy Industry Volume (K Unit) Forecast, by Application 2020 & 2033
- Table 37: Global Plasma Therapy Industry Revenue million Forecast, by Product 2020 & 2033
- Table 38: Global Plasma Therapy Industry Volume K Unit Forecast, by Product 2020 & 2033
- Table 39: Global Plasma Therapy Industry Revenue million Forecast, by Application 2020 & 2033
- Table 40: Global Plasma Therapy Industry Volume K Unit Forecast, by Application 2020 & 2033
- Table 41: Global Plasma Therapy Industry Revenue million Forecast, by Country 2020 & 2033
- Table 42: Global Plasma Therapy Industry Volume K Unit Forecast, by Country 2020 & 2033
- Table 43: China Plasma Therapy Industry Revenue (million) Forecast, by Application 2020 & 2033
- Table 44: China Plasma Therapy Industry Volume (K Unit) Forecast, by Application 2020 & 2033
- Table 45: Japan Plasma Therapy Industry Revenue (million) Forecast, by Application 2020 & 2033
- Table 46: Japan Plasma Therapy Industry Volume (K Unit) Forecast, by Application 2020 & 2033
- Table 47: India Plasma Therapy Industry Revenue (million) Forecast, by Application 2020 & 2033
- Table 48: India Plasma Therapy Industry Volume (K Unit) Forecast, by Application 2020 & 2033
- Table 49: Australia Plasma Therapy Industry Revenue (million) Forecast, by Application 2020 & 2033
- Table 50: Australia Plasma Therapy Industry Volume (K Unit) Forecast, by Application 2020 & 2033
- Table 51: South Korea Plasma Therapy Industry Revenue (million) Forecast, by Application 2020 & 2033
- Table 52: South Korea Plasma Therapy Industry Volume (K Unit) Forecast, by Application 2020 & 2033
- Table 53: Rest of Asia Pacific Plasma Therapy Industry Revenue (million) Forecast, by Application 2020 & 2033
- Table 54: Rest of Asia Pacific Plasma Therapy Industry Volume (K Unit) Forecast, by Application 2020 & 2033
- Table 55: Global Plasma Therapy Industry Revenue million Forecast, by Product 2020 & 2033
- Table 56: Global Plasma Therapy Industry Volume K Unit Forecast, by Product 2020 & 2033
- Table 57: Global Plasma Therapy Industry Revenue million Forecast, by Application 2020 & 2033
- Table 58: Global Plasma Therapy Industry Volume K Unit Forecast, by Application 2020 & 2033
- Table 59: Global Plasma Therapy Industry Revenue million Forecast, by Country 2020 & 2033
- Table 60: Global Plasma Therapy Industry Volume K Unit Forecast, by Country 2020 & 2033
- Table 61: GCC Plasma Therapy Industry Revenue (million) Forecast, by Application 2020 & 2033
- Table 62: GCC Plasma Therapy Industry Volume (K Unit) Forecast, by Application 2020 & 2033
- Table 63: South Africa Plasma Therapy Industry Revenue (million) Forecast, by Application 2020 & 2033
- Table 64: South Africa Plasma Therapy Industry Volume (K Unit) Forecast, by Application 2020 & 2033
- Table 65: Rest of Middle East and Africa Plasma Therapy Industry Revenue (million) Forecast, by Application 2020 & 2033
- Table 66: Rest of Middle East and Africa Plasma Therapy Industry Volume (K Unit) Forecast, by Application 2020 & 2033
- Table 67: Global Plasma Therapy Industry Revenue million Forecast, by Product 2020 & 2033
- Table 68: Global Plasma Therapy Industry Volume K Unit Forecast, by Product 2020 & 2033
- Table 69: Global Plasma Therapy Industry Revenue million Forecast, by Application 2020 & 2033
- Table 70: Global Plasma Therapy Industry Volume K Unit Forecast, by Application 2020 & 2033
- Table 71: Global Plasma Therapy Industry Revenue million Forecast, by Country 2020 & 2033
- Table 72: Global Plasma Therapy Industry Volume K Unit Forecast, by Country 2020 & 2033
- Table 73: Brazil Plasma Therapy Industry Revenue (million) Forecast, by Application 2020 & 2033
- Table 74: Brazil Plasma Therapy Industry Volume (K Unit) Forecast, by Application 2020 & 2033
- Table 75: Argentina Plasma Therapy Industry Revenue (million) Forecast, by Application 2020 & 2033
- Table 76: Argentina Plasma Therapy Industry Volume (K Unit) Forecast, by Application 2020 & 2033
- Table 77: Rest of South America Plasma Therapy Industry Revenue (million) Forecast, by Application 2020 & 2033
- Table 78: Rest of South America Plasma Therapy Industry Volume (K Unit) Forecast, by Application 2020 & 2033
Frequently Asked Questions
1. What is the projected Compound Annual Growth Rate (CAGR) of the Plasma Therapy Industry?
The projected CAGR is approximately 14.2%.
2. Which companies are prominent players in the Plasma Therapy Industry?
Key companies in the market include Arthrex Inc, Octapharma USA Inc, Baxter, Bio Products Laboratory Ltd, Takeda Pharmaceutical Company Limited, CSL Limited, ADMA Biologics Inc, Taibang Biological Group Co Ltd, Grifols S A, Johnson and Johnson (DePuy Synthes), Biotest UK, Kedrion S p A.
3. What are the main segments of the Plasma Therapy Industry?
The market segments include Product, Application.
4. Can you provide details about the market size?
The market size is estimated to be USD 436.2 million as of 2022.
5. What are some drivers contributing to market growth?
Increasing Incidence of Autoimmune and Neurological Diseases; Rise in Research & Development in Plasma Protein.
6. What are the notable trends driving market growth?
Hemophilia Segment is Expected to Witness a Growth in the Plasma Protein Therapeutics Market Over the Forecast Period.
7. Are there any restraints impacting market growth?
Strict Regulations for the Handling of Plasma Protein Products.
8. Can you provide examples of recent developments in the market?
October 2022- Grifols inaugurated its new state-of-the-art manufacturing plant in Ireland to meet the growing global demand for plasma medicines. Grifols' Dublin manufacturing facility triples the annual filling capacity of its innovative, flexible container, ALBUTEIN FlexBag, to meet the rising demand for albumin, the most abundant plasma protein.
9. What pricing options are available for accessing the report?
Pricing options include single-user, multi-user, and enterprise licenses priced at USD 4750, USD 5250, and USD 8750 respectively.
10. Is the market size provided in terms of value or volume?
The market size is provided in terms of value, measured in million and volume, measured in K Unit.
11. Are there any specific market keywords associated with the report?
Yes, the market keyword associated with the report is "Plasma Therapy Industry," which aids in identifying and referencing the specific market segment covered.
12. How do I determine which pricing option suits my needs best?
The pricing options vary based on user requirements and access needs. Individual users may opt for single-user licenses, while businesses requiring broader access may choose multi-user or enterprise licenses for cost-effective access to the report.
13. Are there any additional resources or data provided in the Plasma Therapy Industry report?
While the report offers comprehensive insights, it's advisable to review the specific contents or supplementary materials provided to ascertain if additional resources or data are available.
14. How can I stay updated on further developments or reports in the Plasma Therapy Industry?
To stay informed about further developments, trends, and reports in the Plasma Therapy Industry, consider subscribing to industry newsletters, following relevant companies and organizations, or regularly checking reputable industry news sources and publications.
Methodology
Step 1 - Identification of Relevant Samples Size from Population Database


Step 2 - Approaches for Defining Global Market Size (Value, Volume* & Price*)

Note*: In applicable scenarios
Step 3 - Data Sources
Primary Research
- Web Analytics
- Survey Reports
- Research Institute
- Latest Research Reports
- Opinion Leaders
Secondary Research
- Annual Reports
- White Paper
- Latest Press Release
- Industry Association
- Paid Database
- Investor Presentations

Step 4 - Data Triangulation
Involves using different sources of information in order to increase the validity of a study
These sources are likely to be stakeholders in a program - participants, other researchers, program staff, other community members, and so on.
Then we put all data in single framework & apply various statistical tools to find out the dynamic on the market.
During the analysis stage, feedback from the stakeholder groups would be compared to determine areas of agreement as well as areas of divergence