
Key Insights
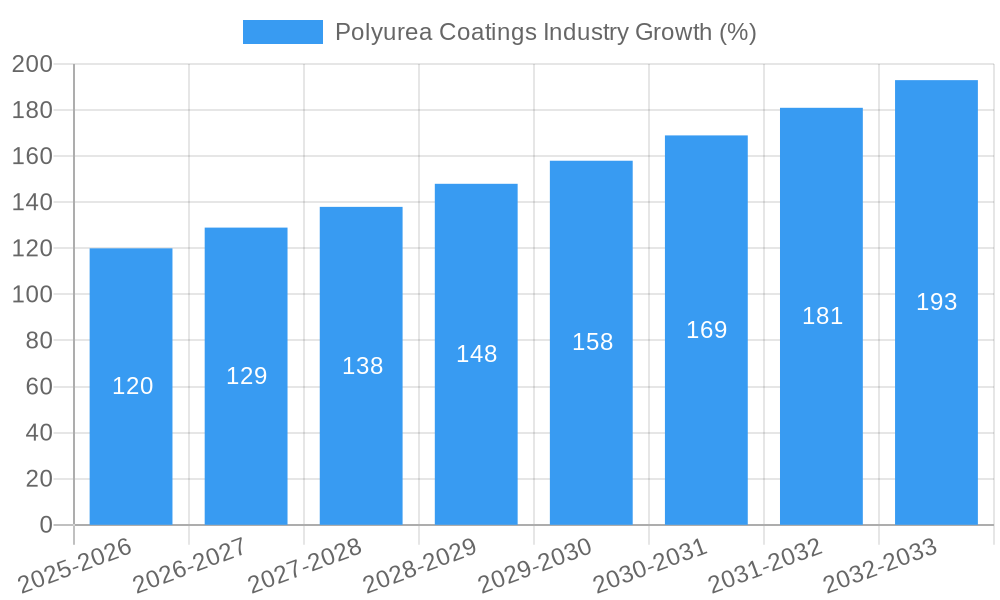
The polyurea coatings market is experiencing robust growth, driven by its superior properties compared to traditional coatings. Its exceptional durability, rapid curing time, and excellent resistance to abrasion, chemicals, and corrosion make it ideal for diverse applications across building and construction, industrial, and transportation sectors. The market's expansion is further fueled by increasing infrastructure development globally, particularly in emerging economies, and a growing demand for protective coatings in harsh environments. Technological advancements, such as the development of spray-applied and pour-in-place systems, are enhancing application versatility and efficiency, contributing to market expansion. While the pure polyurea segment currently dominates, hybrid varieties are gaining traction due to their cost-effectiveness and tailored properties. The spraying application method holds the largest market share due to its efficiency in covering large areas, although hand mixing and pouring methods retain importance for niche applications. North America currently holds a significant market share, driven by substantial construction activity and a well-established industrial base. However, Asia-Pacific is projected to witness the fastest growth rate due to rapid industrialization and infrastructure investments in countries like China and India. Challenges include the relatively high initial cost of polyurea coatings and potential environmental concerns related to certain manufacturing processes. However, ongoing research and development efforts focused on sustainable alternatives and cost-optimization strategies are mitigating these restraints. The market is expected to maintain a healthy growth trajectory throughout the forecast period (2025-2033), driven by these factors.
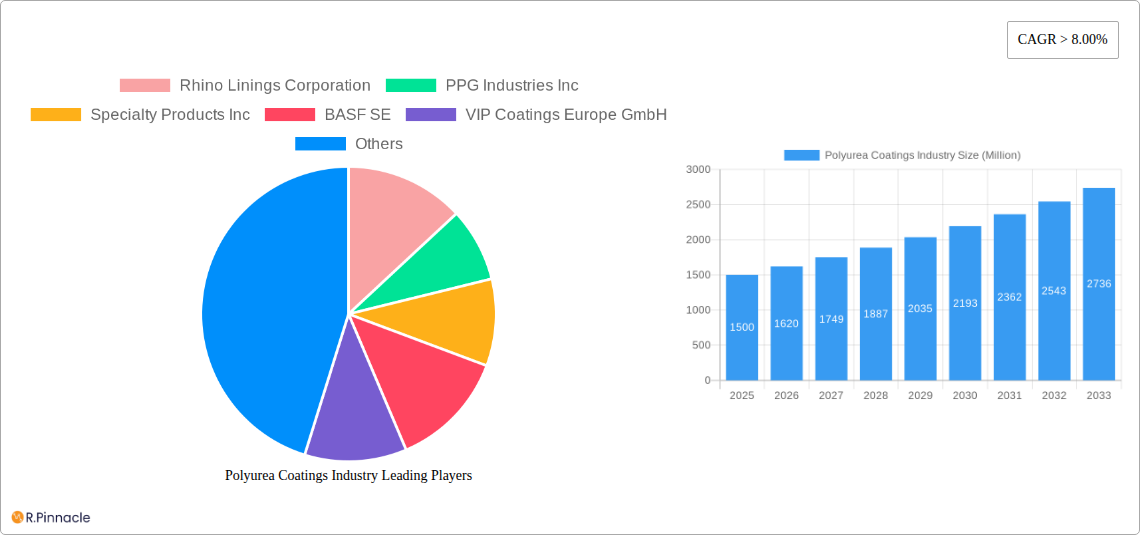
The competitive landscape is marked by both large multinational corporations and specialized coating companies. Key players are actively engaged in strategic initiatives such as product innovation, capacity expansion, and mergers & acquisitions to enhance their market position. The focus is shifting towards eco-friendly and high-performance polyurea formulations to cater to growing environmental consciousness and stringent regulatory compliance. Regional variations in demand and regulatory frameworks necessitate tailored product offerings and distribution strategies. The overall market outlook remains positive, with a projected Compound Annual Growth Rate (CAGR) exceeding 8% during the forecast period. This growth is expected to be driven by continued technological innovation, increasing demand across various end-use industries, and expanding geographical reach. The market will likely witness further consolidation as companies strive for greater market share and global reach.
Polyurea Coatings Industry Market Report: 2019-2033
This comprehensive report provides an in-depth analysis of the global polyurea coatings industry, offering actionable insights for industry professionals, investors, and strategic decision-makers. Covering the period from 2019 to 2033, with a focus on 2025, this report examines market dynamics, leading players, and future growth opportunities within a $XX Million market.
Polyurea Coatings Industry Market Structure & Innovation Trends
The global polyurea coatings market is moderately concentrated, with key players like Rhino Linings Corporation, PPG Industries Inc, and BASF SE holding significant market share. However, the presence of several regional and specialized companies indicates a competitive landscape. Innovation is driven by the need for enhanced durability, faster curing times, and environmentally friendly formulations. Regulatory frameworks concerning VOC emissions and safety standards significantly influence product development and market access. Product substitutes, such as polyurethane and epoxy coatings, pose competitive challenges, particularly in price-sensitive segments. M&A activity, such as PPG's acquisition of VersaFlex in 2021, demonstrates the industry's consolidation trend and the pursuit of technological capabilities and market expansion. Deal values for such acquisitions are typically not publicly disclosed, but they can reach hundreds of millions of dollars.
- Market Concentration: Moderately concentrated, with top players holding approximately xx% market share.
- Innovation Drivers: Enhanced durability, faster curing, eco-friendly formulations, and regulatory compliance.
- Regulatory Frameworks: Stringent VOC emission standards and safety regulations impact product formulations.
- M&A Activity: Strategic acquisitions are driving market consolidation and technological advancements. Example: PPG's acquisition of VersaFlex in 2021 (financial terms undisclosed).
- Product Substitutes: Polyurethane and epoxy coatings offer competitive alternatives in certain applications.
Polyurea Coatings Industry Market Dynamics & Trends
The global polyurea coatings market is experiencing robust growth, driven by increasing demand from various end-use sectors. The Compound Annual Growth Rate (CAGR) during the forecast period (2025-2033) is estimated at xx%. Technological advancements, such as improved spray application techniques and the development of high-performance formulations, are fueling market expansion. Consumer preferences are shifting towards environmentally friendly and sustainable coating solutions, driving the development of low-VOC and bio-based polyurea coatings. Competitive dynamics are intense, with companies focusing on product differentiation, innovation, and strategic partnerships to gain market share. Market penetration is highest in developed regions but is growing rapidly in emerging economies.
Dominant Regions & Segments in Polyurea Coatings Industry
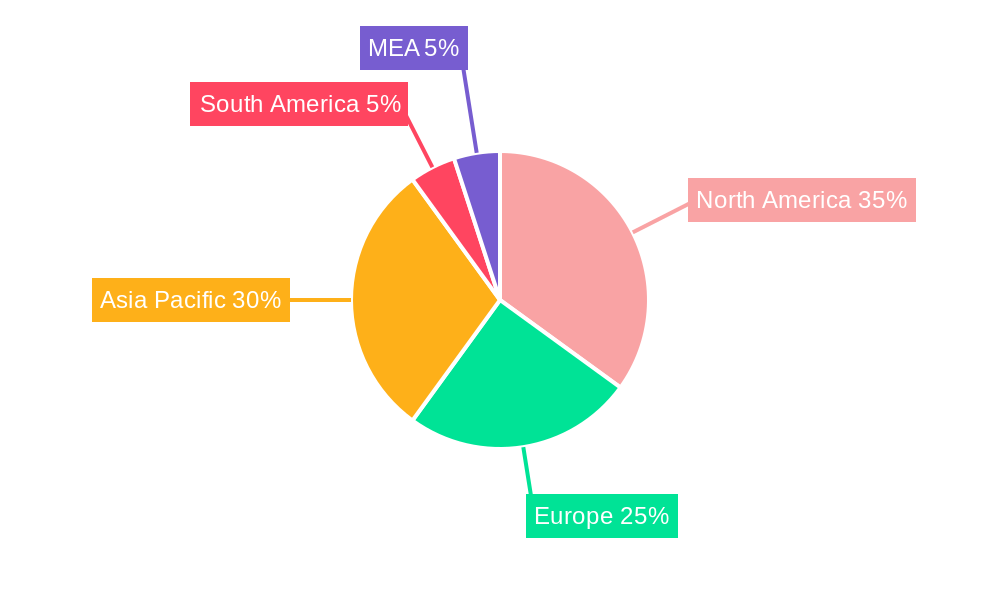
The North American region currently dominates the polyurea coatings market, driven by strong demand from the building and construction sector and robust infrastructure development. However, Asia-Pacific is projected to witness the fastest growth during the forecast period, fueled by rapid industrialization and urbanization.
- Leading Region: North America (currently)
- Fastest Growing Region: Asia-Pacific (projected)
- Dominant Application Segment: Building & Construction (currently) Due to high demand for protective coatings, waterproofing and corrosion prevention.
- Dominant Type Segment: Hybrid (currently) due to cost-effectiveness and balance of properties.
- Dominant Technology Segment: Spraying (currently) due to its speed and efficiency in large-scale applications.
Key Drivers for North America: Strong construction activity, robust infrastructure investments, and stringent regulatory compliance. Key Drivers for Asia-Pacific: Rapid industrialization, urbanization, and increasing infrastructure spending.
Polyurea Coatings Industry Product Innovations
Recent innovations in polyurea coatings focus on enhanced durability, improved flexibility, and faster curing times. New formulations offer superior resistance to abrasion, chemicals, and UV degradation, expanding applications in demanding environments. The development of low-VOC and bio-based polyurea coatings addresses growing environmental concerns and aligns with sustainability goals. These innovations are enhancing the market fit of polyurea coatings by providing cost-effective and high-performance solutions.
Report Scope & Segmentation Analysis
This report segments the polyurea coatings market based on type (Pure, Hybrid), technology (Spraying, Pouring, Hand Mixing), and application (Building and Construction, Industrial, Transportation, Other Applications). Each segment's growth projections, market size, and competitive dynamics are analyzed in detail. Growth projections vary across segments, with the building and construction segment anticipated to maintain substantial growth throughout the forecast period. Competitive intensity also varies among segments based on the specific application requirements and the presence of substitute materials.
Key Drivers of Polyurea Coatings Industry Growth
Several factors are driving the growth of the polyurea coatings industry. Technological advancements leading to superior performance and efficiency are a major factor. The increasing demand for durable and protective coatings across various end-use industries, fueled by infrastructure development and industrial expansion, is another key driver. Favorable economic conditions in key markets, including government support for infrastructure projects, contribute to market expansion. Furthermore, stringent environmental regulations are promoting the adoption of eco-friendly polyurea coating solutions.
Challenges in the Polyurea Coatings Industry Sector
The polyurea coatings industry faces challenges such as the volatile prices of raw materials, which can impact profitability and pricing strategies. Competition from substitute materials, especially in price-sensitive segments, poses a threat to market share. Stringent environmental regulations require continuous investment in research and development to comply with evolving standards. Supply chain disruptions can impact production and delivery times, requiring robust supply chain management strategies. These factors can limit market expansion or increase costs.
Emerging Opportunities in Polyurea Coatings Industry
Emerging opportunities exist in the development and application of polyurea coatings in specialized areas such as offshore platforms, renewable energy infrastructure, and advanced automotive applications. Growing demand for sustainable and eco-friendly solutions opens up possibilities for bio-based polyurea formulations. Furthermore, the use of polyurea coatings in innovative construction techniques, such as 3D printing, presents significant potential for market expansion. The expansion into new emerging markets also offers significant growth prospects.
Leading Players in the Polyurea Coatings Industry Market
- Rhino Linings Corporation
- PPG Industries Inc
- Specialty Products Inc
- BASF SE
- VIP Coatings Europe GmbH
- Huntsman International LLC
- Teknos Group
- Nukote Coating Systems
- KUKDO Chemical (Kunshan) Co Ltd
- Armorthane
Key Developments in Polyurea Coatings Industry Industry
- January 2021: PPG Industries Inc. acquired VersaFlex, expanding its presence in polyurea coatings for various infrastructure and industrial applications.
Future Outlook for Polyurea Coatings Industry Market
The polyurea coatings market is poised for continued growth, driven by technological advancements, increasing demand from diverse end-use sectors, and favorable economic conditions in key regions. Strategic partnerships, product diversification, and expansion into emerging markets will be crucial for success. The focus on sustainability and eco-friendly solutions will shape future product development and market trends. The overall market is predicted to experience substantial growth over the next decade.
Polyurea Coatings Industry Segmentation
-
1. Type
- 1.1. Pure
- 1.2. Hybrid
-
2. Technology
- 2.1. Spraying
- 2.2. Pouring
- 2.3. Hand Mixing
-
3. Application
- 3.1. Building and Construction
- 3.2. Industrial
- 3.3. Transportation
- 3.4. Other Applications
Polyurea Coatings Industry Segmentation By Geography
-
1. Asia Pacific
- 1.1. China
- 1.2. India
- 1.3. Japan
- 1.4. South Korea
- 1.5. Rest of Asia Pacific
-
2. North America
- 2.1. United States
- 2.2. Canada
- 2.3. Mexico
-
3. Europe
- 3.1. Germany
- 3.2. United Kingdom
- 3.3. France
- 3.4. Italy
- 3.5. Rest of Europe
-
4. South America
- 4.1. Brazil
- 4.2. Argentina
- 4.3. Rest of South America
-
5. Middle East and Africa
- 5.1. Saudi Arabia
- 5.2. South Africa
- 5.3. Rest of Middle East and Africa
Polyurea Coatings Industry REPORT HIGHLIGHTS
| Aspects | Details |
|---|---|
| Study Period | 2019-2033 |
| Base Year | 2024 |
| Estimated Year | 2025 |
| Forecast Period | 2025-2033 |
| Historical Period | 2019-2024 |
| Growth Rate | CAGR of > 8.00% from 2019-2033 |
| Segmentation |
|
Table of Contents
- 1. Introduction
- 1.1. Research Scope
- 1.2. Market Segmentation
- 1.3. Research Methodology
- 1.4. Definitions and Assumptions
- 2. Executive Summary
- 2.1. Introduction
- 3. Market Dynamics
- 3.1. Introduction
- 3.2. Market Drivers
- 3.2.1. Growing Demand from the Construction Industry; Adoption of Regulations on VOC Emissions; Technological Advancements of Processes and Techniques Involved in Manufacturing
- 3.3. Market Restrains
- 3.3.1. Poor Color Stability on Exposure to UV Light; Unfavorable Conditions Arising Due to the COVID-19 Outbreak
- 3.4. Market Trends
- 3.4.1. Building and Construction Industry to Dominate the Market
- 4. Market Factor Analysis
- 4.1. Porters Five Forces
- 4.2. Supply/Value Chain
- 4.3. PESTEL analysis
- 4.4. Market Entropy
- 4.5. Patent/Trademark Analysis
- 5. Global Polyurea Coatings Industry Analysis, Insights and Forecast, 2019-2031
- 5.1. Market Analysis, Insights and Forecast - by Type
- 5.1.1. Pure
- 5.1.2. Hybrid
- 5.2. Market Analysis, Insights and Forecast - by Technology
- 5.2.1. Spraying
- 5.2.2. Pouring
- 5.2.3. Hand Mixing
- 5.3. Market Analysis, Insights and Forecast - by Application
- 5.3.1. Building and Construction
- 5.3.2. Industrial
- 5.3.3. Transportation
- 5.3.4. Other Applications
- 5.4. Market Analysis, Insights and Forecast - by Region
- 5.4.1. Asia Pacific
- 5.4.2. North America
- 5.4.3. Europe
- 5.4.4. South America
- 5.4.5. Middle East and Africa
- 5.1. Market Analysis, Insights and Forecast - by Type
- 6. Asia Pacific Polyurea Coatings Industry Analysis, Insights and Forecast, 2019-2031
- 6.1. Market Analysis, Insights and Forecast - by Type
- 6.1.1. Pure
- 6.1.2. Hybrid
- 6.2. Market Analysis, Insights and Forecast - by Technology
- 6.2.1. Spraying
- 6.2.2. Pouring
- 6.2.3. Hand Mixing
- 6.3. Market Analysis, Insights and Forecast - by Application
- 6.3.1. Building and Construction
- 6.3.2. Industrial
- 6.3.3. Transportation
- 6.3.4. Other Applications
- 6.1. Market Analysis, Insights and Forecast - by Type
- 7. North America Polyurea Coatings Industry Analysis, Insights and Forecast, 2019-2031
- 7.1. Market Analysis, Insights and Forecast - by Type
- 7.1.1. Pure
- 7.1.2. Hybrid
- 7.2. Market Analysis, Insights and Forecast - by Technology
- 7.2.1. Spraying
- 7.2.2. Pouring
- 7.2.3. Hand Mixing
- 7.3. Market Analysis, Insights and Forecast - by Application
- 7.3.1. Building and Construction
- 7.3.2. Industrial
- 7.3.3. Transportation
- 7.3.4. Other Applications
- 7.1. Market Analysis, Insights and Forecast - by Type
- 8. Europe Polyurea Coatings Industry Analysis, Insights and Forecast, 2019-2031
- 8.1. Market Analysis, Insights and Forecast - by Type
- 8.1.1. Pure
- 8.1.2. Hybrid
- 8.2. Market Analysis, Insights and Forecast - by Technology
- 8.2.1. Spraying
- 8.2.2. Pouring
- 8.2.3. Hand Mixing
- 8.3. Market Analysis, Insights and Forecast - by Application
- 8.3.1. Building and Construction
- 8.3.2. Industrial
- 8.3.3. Transportation
- 8.3.4. Other Applications
- 8.1. Market Analysis, Insights and Forecast - by Type
- 9. South America Polyurea Coatings Industry Analysis, Insights and Forecast, 2019-2031
- 9.1. Market Analysis, Insights and Forecast - by Type
- 9.1.1. Pure
- 9.1.2. Hybrid
- 9.2. Market Analysis, Insights and Forecast - by Technology
- 9.2.1. Spraying
- 9.2.2. Pouring
- 9.2.3. Hand Mixing
- 9.3. Market Analysis, Insights and Forecast - by Application
- 9.3.1. Building and Construction
- 9.3.2. Industrial
- 9.3.3. Transportation
- 9.3.4. Other Applications
- 9.1. Market Analysis, Insights and Forecast - by Type
- 10. Middle East and Africa Polyurea Coatings Industry Analysis, Insights and Forecast, 2019-2031
- 10.1. Market Analysis, Insights and Forecast - by Type
- 10.1.1. Pure
- 10.1.2. Hybrid
- 10.2. Market Analysis, Insights and Forecast - by Technology
- 10.2.1. Spraying
- 10.2.2. Pouring
- 10.2.3. Hand Mixing
- 10.3. Market Analysis, Insights and Forecast - by Application
- 10.3.1. Building and Construction
- 10.3.2. Industrial
- 10.3.3. Transportation
- 10.3.4. Other Applications
- 10.1. Market Analysis, Insights and Forecast - by Type
- 11. North America Polyurea Coatings Industry Analysis, Insights and Forecast, 2019-2031
- 11.1. Market Analysis, Insights and Forecast - By Country/Sub-region
- 11.1.1 United States
- 11.1.2 Canada
- 11.1.3 Mexico
- 12. Europe Polyurea Coatings Industry Analysis, Insights and Forecast, 2019-2031
- 12.1. Market Analysis, Insights and Forecast - By Country/Sub-region
- 12.1.1 Germany
- 12.1.2 France
- 12.1.3 Italy
- 12.1.4 United Kingdom
- 12.1.5 Netherlands
- 12.1.6 Rest of Europe
- 13. Asia Pacific Polyurea Coatings Industry Analysis, Insights and Forecast, 2019-2031
- 13.1. Market Analysis, Insights and Forecast - By Country/Sub-region
- 13.1.1 China
- 13.1.2 Japan
- 13.1.3 India
- 13.1.4 South Korea
- 13.1.5 Taiwan
- 13.1.6 Australia
- 13.1.7 Rest of Asia-Pacific
- 14. South America Polyurea Coatings Industry Analysis, Insights and Forecast, 2019-2031
- 14.1. Market Analysis, Insights and Forecast - By Country/Sub-region
- 14.1.1 Brazil
- 14.1.2 Argentina
- 14.1.3 Rest of South America
- 15. MEA Polyurea Coatings Industry Analysis, Insights and Forecast, 2019-2031
- 15.1. Market Analysis, Insights and Forecast - By Country/Sub-region
- 15.1.1 Middle East
- 15.1.2 Africa
- 16. Competitive Analysis
- 16.1. Global Market Share Analysis 2024
- 16.2. Company Profiles
- 16.2.1 Rhino Linings Corporation
- 16.2.1.1. Overview
- 16.2.1.2. Products
- 16.2.1.3. SWOT Analysis
- 16.2.1.4. Recent Developments
- 16.2.1.5. Financials (Based on Availability)
- 16.2.2 PPG Industries Inc
- 16.2.2.1. Overview
- 16.2.2.2. Products
- 16.2.2.3. SWOT Analysis
- 16.2.2.4. Recent Developments
- 16.2.2.5. Financials (Based on Availability)
- 16.2.3 Specialty Products Inc
- 16.2.3.1. Overview
- 16.2.3.2. Products
- 16.2.3.3. SWOT Analysis
- 16.2.3.4. Recent Developments
- 16.2.3.5. Financials (Based on Availability)
- 16.2.4 BASF SE
- 16.2.4.1. Overview
- 16.2.4.2. Products
- 16.2.4.3. SWOT Analysis
- 16.2.4.4. Recent Developments
- 16.2.4.5. Financials (Based on Availability)
- 16.2.5 VIP Coatings Europe GmbH
- 16.2.5.1. Overview
- 16.2.5.2. Products
- 16.2.5.3. SWOT Analysis
- 16.2.5.4. Recent Developments
- 16.2.5.5. Financials (Based on Availability)
- 16.2.6 Huntsman International LLC
- 16.2.6.1. Overview
- 16.2.6.2. Products
- 16.2.6.3. SWOT Analysis
- 16.2.6.4. Recent Developments
- 16.2.6.5. Financials (Based on Availability)
- 16.2.7 Teknos Group
- 16.2.7.1. Overview
- 16.2.7.2. Products
- 16.2.7.3. SWOT Analysis
- 16.2.7.4. Recent Developments
- 16.2.7.5. Financials (Based on Availability)
- 16.2.8 Nukote Coating Systems
- 16.2.8.1. Overview
- 16.2.8.2. Products
- 16.2.8.3. SWOT Analysis
- 16.2.8.4. Recent Developments
- 16.2.8.5. Financials (Based on Availability)
- 16.2.9 KUKDO Chemical (Kunshan) Co Ltd
- 16.2.9.1. Overview
- 16.2.9.2. Products
- 16.2.9.3. SWOT Analysis
- 16.2.9.4. Recent Developments
- 16.2.9.5. Financials (Based on Availability)
- 16.2.10 Armorthane
- 16.2.10.1. Overview
- 16.2.10.2. Products
- 16.2.10.3. SWOT Analysis
- 16.2.10.4. Recent Developments
- 16.2.10.5. Financials (Based on Availability)
- 16.2.1 Rhino Linings Corporation
List of Figures
- Figure 1: Global Polyurea Coatings Industry Revenue Breakdown (Million, %) by Region 2024 & 2032
- Figure 2: Global Polyurea Coatings Industry Volume Breakdown (K Tons, %) by Region 2024 & 2032
- Figure 3: North America Polyurea Coatings Industry Revenue (Million), by Country 2024 & 2032
- Figure 4: North America Polyurea Coatings Industry Volume (K Tons), by Country 2024 & 2032
- Figure 5: North America Polyurea Coatings Industry Revenue Share (%), by Country 2024 & 2032
- Figure 6: North America Polyurea Coatings Industry Volume Share (%), by Country 2024 & 2032
- Figure 7: Europe Polyurea Coatings Industry Revenue (Million), by Country 2024 & 2032
- Figure 8: Europe Polyurea Coatings Industry Volume (K Tons), by Country 2024 & 2032
- Figure 9: Europe Polyurea Coatings Industry Revenue Share (%), by Country 2024 & 2032
- Figure 10: Europe Polyurea Coatings Industry Volume Share (%), by Country 2024 & 2032
- Figure 11: Asia Pacific Polyurea Coatings Industry Revenue (Million), by Country 2024 & 2032
- Figure 12: Asia Pacific Polyurea Coatings Industry Volume (K Tons), by Country 2024 & 2032
- Figure 13: Asia Pacific Polyurea Coatings Industry Revenue Share (%), by Country 2024 & 2032
- Figure 14: Asia Pacific Polyurea Coatings Industry Volume Share (%), by Country 2024 & 2032
- Figure 15: South America Polyurea Coatings Industry Revenue (Million), by Country 2024 & 2032
- Figure 16: South America Polyurea Coatings Industry Volume (K Tons), by Country 2024 & 2032
- Figure 17: South America Polyurea Coatings Industry Revenue Share (%), by Country 2024 & 2032
- Figure 18: South America Polyurea Coatings Industry Volume Share (%), by Country 2024 & 2032
- Figure 19: MEA Polyurea Coatings Industry Revenue (Million), by Country 2024 & 2032
- Figure 20: MEA Polyurea Coatings Industry Volume (K Tons), by Country 2024 & 2032
- Figure 21: MEA Polyurea Coatings Industry Revenue Share (%), by Country 2024 & 2032
- Figure 22: MEA Polyurea Coatings Industry Volume Share (%), by Country 2024 & 2032
- Figure 23: Asia Pacific Polyurea Coatings Industry Revenue (Million), by Type 2024 & 2032
- Figure 24: Asia Pacific Polyurea Coatings Industry Volume (K Tons), by Type 2024 & 2032
- Figure 25: Asia Pacific Polyurea Coatings Industry Revenue Share (%), by Type 2024 & 2032
- Figure 26: Asia Pacific Polyurea Coatings Industry Volume Share (%), by Type 2024 & 2032
- Figure 27: Asia Pacific Polyurea Coatings Industry Revenue (Million), by Technology 2024 & 2032
- Figure 28: Asia Pacific Polyurea Coatings Industry Volume (K Tons), by Technology 2024 & 2032
- Figure 29: Asia Pacific Polyurea Coatings Industry Revenue Share (%), by Technology 2024 & 2032
- Figure 30: Asia Pacific Polyurea Coatings Industry Volume Share (%), by Technology 2024 & 2032
- Figure 31: Asia Pacific Polyurea Coatings Industry Revenue (Million), by Application 2024 & 2032
- Figure 32: Asia Pacific Polyurea Coatings Industry Volume (K Tons), by Application 2024 & 2032
- Figure 33: Asia Pacific Polyurea Coatings Industry Revenue Share (%), by Application 2024 & 2032
- Figure 34: Asia Pacific Polyurea Coatings Industry Volume Share (%), by Application 2024 & 2032
- Figure 35: Asia Pacific Polyurea Coatings Industry Revenue (Million), by Country 2024 & 2032
- Figure 36: Asia Pacific Polyurea Coatings Industry Volume (K Tons), by Country 2024 & 2032
- Figure 37: Asia Pacific Polyurea Coatings Industry Revenue Share (%), by Country 2024 & 2032
- Figure 38: Asia Pacific Polyurea Coatings Industry Volume Share (%), by Country 2024 & 2032
- Figure 39: North America Polyurea Coatings Industry Revenue (Million), by Type 2024 & 2032
- Figure 40: North America Polyurea Coatings Industry Volume (K Tons), by Type 2024 & 2032
- Figure 41: North America Polyurea Coatings Industry Revenue Share (%), by Type 2024 & 2032
- Figure 42: North America Polyurea Coatings Industry Volume Share (%), by Type 2024 & 2032
- Figure 43: North America Polyurea Coatings Industry Revenue (Million), by Technology 2024 & 2032
- Figure 44: North America Polyurea Coatings Industry Volume (K Tons), by Technology 2024 & 2032
- Figure 45: North America Polyurea Coatings Industry Revenue Share (%), by Technology 2024 & 2032
- Figure 46: North America Polyurea Coatings Industry Volume Share (%), by Technology 2024 & 2032
- Figure 47: North America Polyurea Coatings Industry Revenue (Million), by Application 2024 & 2032
- Figure 48: North America Polyurea Coatings Industry Volume (K Tons), by Application 2024 & 2032
- Figure 49: North America Polyurea Coatings Industry Revenue Share (%), by Application 2024 & 2032
- Figure 50: North America Polyurea Coatings Industry Volume Share (%), by Application 2024 & 2032
- Figure 51: North America Polyurea Coatings Industry Revenue (Million), by Country 2024 & 2032
- Figure 52: North America Polyurea Coatings Industry Volume (K Tons), by Country 2024 & 2032
- Figure 53: North America Polyurea Coatings Industry Revenue Share (%), by Country 2024 & 2032
- Figure 54: North America Polyurea Coatings Industry Volume Share (%), by Country 2024 & 2032
- Figure 55: Europe Polyurea Coatings Industry Revenue (Million), by Type 2024 & 2032
- Figure 56: Europe Polyurea Coatings Industry Volume (K Tons), by Type 2024 & 2032
- Figure 57: Europe Polyurea Coatings Industry Revenue Share (%), by Type 2024 & 2032
- Figure 58: Europe Polyurea Coatings Industry Volume Share (%), by Type 2024 & 2032
- Figure 59: Europe Polyurea Coatings Industry Revenue (Million), by Technology 2024 & 2032
- Figure 60: Europe Polyurea Coatings Industry Volume (K Tons), by Technology 2024 & 2032
- Figure 61: Europe Polyurea Coatings Industry Revenue Share (%), by Technology 2024 & 2032
- Figure 62: Europe Polyurea Coatings Industry Volume Share (%), by Technology 2024 & 2032
- Figure 63: Europe Polyurea Coatings Industry Revenue (Million), by Application 2024 & 2032
- Figure 64: Europe Polyurea Coatings Industry Volume (K Tons), by Application 2024 & 2032
- Figure 65: Europe Polyurea Coatings Industry Revenue Share (%), by Application 2024 & 2032
- Figure 66: Europe Polyurea Coatings Industry Volume Share (%), by Application 2024 & 2032
- Figure 67: Europe Polyurea Coatings Industry Revenue (Million), by Country 2024 & 2032
- Figure 68: Europe Polyurea Coatings Industry Volume (K Tons), by Country 2024 & 2032
- Figure 69: Europe Polyurea Coatings Industry Revenue Share (%), by Country 2024 & 2032
- Figure 70: Europe Polyurea Coatings Industry Volume Share (%), by Country 2024 & 2032
- Figure 71: South America Polyurea Coatings Industry Revenue (Million), by Type 2024 & 2032
- Figure 72: South America Polyurea Coatings Industry Volume (K Tons), by Type 2024 & 2032
- Figure 73: South America Polyurea Coatings Industry Revenue Share (%), by Type 2024 & 2032
- Figure 74: South America Polyurea Coatings Industry Volume Share (%), by Type 2024 & 2032
- Figure 75: South America Polyurea Coatings Industry Revenue (Million), by Technology 2024 & 2032
- Figure 76: South America Polyurea Coatings Industry Volume (K Tons), by Technology 2024 & 2032
- Figure 77: South America Polyurea Coatings Industry Revenue Share (%), by Technology 2024 & 2032
- Figure 78: South America Polyurea Coatings Industry Volume Share (%), by Technology 2024 & 2032
- Figure 79: South America Polyurea Coatings Industry Revenue (Million), by Application 2024 & 2032
- Figure 80: South America Polyurea Coatings Industry Volume (K Tons), by Application 2024 & 2032
- Figure 81: South America Polyurea Coatings Industry Revenue Share (%), by Application 2024 & 2032
- Figure 82: South America Polyurea Coatings Industry Volume Share (%), by Application 2024 & 2032
- Figure 83: South America Polyurea Coatings Industry Revenue (Million), by Country 2024 & 2032
- Figure 84: South America Polyurea Coatings Industry Volume (K Tons), by Country 2024 & 2032
- Figure 85: South America Polyurea Coatings Industry Revenue Share (%), by Country 2024 & 2032
- Figure 86: South America Polyurea Coatings Industry Volume Share (%), by Country 2024 & 2032
- Figure 87: Middle East and Africa Polyurea Coatings Industry Revenue (Million), by Type 2024 & 2032
- Figure 88: Middle East and Africa Polyurea Coatings Industry Volume (K Tons), by Type 2024 & 2032
- Figure 89: Middle East and Africa Polyurea Coatings Industry Revenue Share (%), by Type 2024 & 2032
- Figure 90: Middle East and Africa Polyurea Coatings Industry Volume Share (%), by Type 2024 & 2032
- Figure 91: Middle East and Africa Polyurea Coatings Industry Revenue (Million), by Technology 2024 & 2032
- Figure 92: Middle East and Africa Polyurea Coatings Industry Volume (K Tons), by Technology 2024 & 2032
- Figure 93: Middle East and Africa Polyurea Coatings Industry Revenue Share (%), by Technology 2024 & 2032
- Figure 94: Middle East and Africa Polyurea Coatings Industry Volume Share (%), by Technology 2024 & 2032
- Figure 95: Middle East and Africa Polyurea Coatings Industry Revenue (Million), by Application 2024 & 2032
- Figure 96: Middle East and Africa Polyurea Coatings Industry Volume (K Tons), by Application 2024 & 2032
- Figure 97: Middle East and Africa Polyurea Coatings Industry Revenue Share (%), by Application 2024 & 2032
- Figure 98: Middle East and Africa Polyurea Coatings Industry Volume Share (%), by Application 2024 & 2032
- Figure 99: Middle East and Africa Polyurea Coatings Industry Revenue (Million), by Country 2024 & 2032
- Figure 100: Middle East and Africa Polyurea Coatings Industry Volume (K Tons), by Country 2024 & 2032
- Figure 101: Middle East and Africa Polyurea Coatings Industry Revenue Share (%), by Country 2024 & 2032
- Figure 102: Middle East and Africa Polyurea Coatings Industry Volume Share (%), by Country 2024 & 2032
List of Tables
- Table 1: Global Polyurea Coatings Industry Revenue Million Forecast, by Region 2019 & 2032
- Table 2: Global Polyurea Coatings Industry Volume K Tons Forecast, by Region 2019 & 2032
- Table 3: Global Polyurea Coatings Industry Revenue Million Forecast, by Type 2019 & 2032
- Table 4: Global Polyurea Coatings Industry Volume K Tons Forecast, by Type 2019 & 2032
- Table 5: Global Polyurea Coatings Industry Revenue Million Forecast, by Technology 2019 & 2032
- Table 6: Global Polyurea Coatings Industry Volume K Tons Forecast, by Technology 2019 & 2032
- Table 7: Global Polyurea Coatings Industry Revenue Million Forecast, by Application 2019 & 2032
- Table 8: Global Polyurea Coatings Industry Volume K Tons Forecast, by Application 2019 & 2032
- Table 9: Global Polyurea Coatings Industry Revenue Million Forecast, by Region 2019 & 2032
- Table 10: Global Polyurea Coatings Industry Volume K Tons Forecast, by Region 2019 & 2032
- Table 11: Global Polyurea Coatings Industry Revenue Million Forecast, by Country 2019 & 2032
- Table 12: Global Polyurea Coatings Industry Volume K Tons Forecast, by Country 2019 & 2032
- Table 13: United States Polyurea Coatings Industry Revenue (Million) Forecast, by Application 2019 & 2032
- Table 14: United States Polyurea Coatings Industry Volume (K Tons) Forecast, by Application 2019 & 2032
- Table 15: Canada Polyurea Coatings Industry Revenue (Million) Forecast, by Application 2019 & 2032
- Table 16: Canada Polyurea Coatings Industry Volume (K Tons) Forecast, by Application 2019 & 2032
- Table 17: Mexico Polyurea Coatings Industry Revenue (Million) Forecast, by Application 2019 & 2032
- Table 18: Mexico Polyurea Coatings Industry Volume (K Tons) Forecast, by Application 2019 & 2032
- Table 19: Global Polyurea Coatings Industry Revenue Million Forecast, by Country 2019 & 2032
- Table 20: Global Polyurea Coatings Industry Volume K Tons Forecast, by Country 2019 & 2032
- Table 21: Germany Polyurea Coatings Industry Revenue (Million) Forecast, by Application 2019 & 2032
- Table 22: Germany Polyurea Coatings Industry Volume (K Tons) Forecast, by Application 2019 & 2032
- Table 23: France Polyurea Coatings Industry Revenue (Million) Forecast, by Application 2019 & 2032
- Table 24: France Polyurea Coatings Industry Volume (K Tons) Forecast, by Application 2019 & 2032
- Table 25: Italy Polyurea Coatings Industry Revenue (Million) Forecast, by Application 2019 & 2032
- Table 26: Italy Polyurea Coatings Industry Volume (K Tons) Forecast, by Application 2019 & 2032
- Table 27: United Kingdom Polyurea Coatings Industry Revenue (Million) Forecast, by Application 2019 & 2032
- Table 28: United Kingdom Polyurea Coatings Industry Volume (K Tons) Forecast, by Application 2019 & 2032
- Table 29: Netherlands Polyurea Coatings Industry Revenue (Million) Forecast, by Application 2019 & 2032
- Table 30: Netherlands Polyurea Coatings Industry Volume (K Tons) Forecast, by Application 2019 & 2032
- Table 31: Rest of Europe Polyurea Coatings Industry Revenue (Million) Forecast, by Application 2019 & 2032
- Table 32: Rest of Europe Polyurea Coatings Industry Volume (K Tons) Forecast, by Application 2019 & 2032
- Table 33: Global Polyurea Coatings Industry Revenue Million Forecast, by Country 2019 & 2032
- Table 34: Global Polyurea Coatings Industry Volume K Tons Forecast, by Country 2019 & 2032
- Table 35: China Polyurea Coatings Industry Revenue (Million) Forecast, by Application 2019 & 2032
- Table 36: China Polyurea Coatings Industry Volume (K Tons) Forecast, by Application 2019 & 2032
- Table 37: Japan Polyurea Coatings Industry Revenue (Million) Forecast, by Application 2019 & 2032
- Table 38: Japan Polyurea Coatings Industry Volume (K Tons) Forecast, by Application 2019 & 2032
- Table 39: India Polyurea Coatings Industry Revenue (Million) Forecast, by Application 2019 & 2032
- Table 40: India Polyurea Coatings Industry Volume (K Tons) Forecast, by Application 2019 & 2032
- Table 41: South Korea Polyurea Coatings Industry Revenue (Million) Forecast, by Application 2019 & 2032
- Table 42: South Korea Polyurea Coatings Industry Volume (K Tons) Forecast, by Application 2019 & 2032
- Table 43: Taiwan Polyurea Coatings Industry Revenue (Million) Forecast, by Application 2019 & 2032
- Table 44: Taiwan Polyurea Coatings Industry Volume (K Tons) Forecast, by Application 2019 & 2032
- Table 45: Australia Polyurea Coatings Industry Revenue (Million) Forecast, by Application 2019 & 2032
- Table 46: Australia Polyurea Coatings Industry Volume (K Tons) Forecast, by Application 2019 & 2032
- Table 47: Rest of Asia-Pacific Polyurea Coatings Industry Revenue (Million) Forecast, by Application 2019 & 2032
- Table 48: Rest of Asia-Pacific Polyurea Coatings Industry Volume (K Tons) Forecast, by Application 2019 & 2032
- Table 49: Global Polyurea Coatings Industry Revenue Million Forecast, by Country 2019 & 2032
- Table 50: Global Polyurea Coatings Industry Volume K Tons Forecast, by Country 2019 & 2032
- Table 51: Brazil Polyurea Coatings Industry Revenue (Million) Forecast, by Application 2019 & 2032
- Table 52: Brazil Polyurea Coatings Industry Volume (K Tons) Forecast, by Application 2019 & 2032
- Table 53: Argentina Polyurea Coatings Industry Revenue (Million) Forecast, by Application 2019 & 2032
- Table 54: Argentina Polyurea Coatings Industry Volume (K Tons) Forecast, by Application 2019 & 2032
- Table 55: Rest of South America Polyurea Coatings Industry Revenue (Million) Forecast, by Application 2019 & 2032
- Table 56: Rest of South America Polyurea Coatings Industry Volume (K Tons) Forecast, by Application 2019 & 2032
- Table 57: Global Polyurea Coatings Industry Revenue Million Forecast, by Country 2019 & 2032
- Table 58: Global Polyurea Coatings Industry Volume K Tons Forecast, by Country 2019 & 2032
- Table 59: Middle East Polyurea Coatings Industry Revenue (Million) Forecast, by Application 2019 & 2032
- Table 60: Middle East Polyurea Coatings Industry Volume (K Tons) Forecast, by Application 2019 & 2032
- Table 61: Africa Polyurea Coatings Industry Revenue (Million) Forecast, by Application 2019 & 2032
- Table 62: Africa Polyurea Coatings Industry Volume (K Tons) Forecast, by Application 2019 & 2032
- Table 63: Global Polyurea Coatings Industry Revenue Million Forecast, by Type 2019 & 2032
- Table 64: Global Polyurea Coatings Industry Volume K Tons Forecast, by Type 2019 & 2032
- Table 65: Global Polyurea Coatings Industry Revenue Million Forecast, by Technology 2019 & 2032
- Table 66: Global Polyurea Coatings Industry Volume K Tons Forecast, by Technology 2019 & 2032
- Table 67: Global Polyurea Coatings Industry Revenue Million Forecast, by Application 2019 & 2032
- Table 68: Global Polyurea Coatings Industry Volume K Tons Forecast, by Application 2019 & 2032
- Table 69: Global Polyurea Coatings Industry Revenue Million Forecast, by Country 2019 & 2032
- Table 70: Global Polyurea Coatings Industry Volume K Tons Forecast, by Country 2019 & 2032
- Table 71: China Polyurea Coatings Industry Revenue (Million) Forecast, by Application 2019 & 2032
- Table 72: China Polyurea Coatings Industry Volume (K Tons) Forecast, by Application 2019 & 2032
- Table 73: India Polyurea Coatings Industry Revenue (Million) Forecast, by Application 2019 & 2032
- Table 74: India Polyurea Coatings Industry Volume (K Tons) Forecast, by Application 2019 & 2032
- Table 75: Japan Polyurea Coatings Industry Revenue (Million) Forecast, by Application 2019 & 2032
- Table 76: Japan Polyurea Coatings Industry Volume (K Tons) Forecast, by Application 2019 & 2032
- Table 77: South Korea Polyurea Coatings Industry Revenue (Million) Forecast, by Application 2019 & 2032
- Table 78: South Korea Polyurea Coatings Industry Volume (K Tons) Forecast, by Application 2019 & 2032
- Table 79: Rest of Asia Pacific Polyurea Coatings Industry Revenue (Million) Forecast, by Application 2019 & 2032
- Table 80: Rest of Asia Pacific Polyurea Coatings Industry Volume (K Tons) Forecast, by Application 2019 & 2032
- Table 81: Global Polyurea Coatings Industry Revenue Million Forecast, by Type 2019 & 2032
- Table 82: Global Polyurea Coatings Industry Volume K Tons Forecast, by Type 2019 & 2032
- Table 83: Global Polyurea Coatings Industry Revenue Million Forecast, by Technology 2019 & 2032
- Table 84: Global Polyurea Coatings Industry Volume K Tons Forecast, by Technology 2019 & 2032
- Table 85: Global Polyurea Coatings Industry Revenue Million Forecast, by Application 2019 & 2032
- Table 86: Global Polyurea Coatings Industry Volume K Tons Forecast, by Application 2019 & 2032
- Table 87: Global Polyurea Coatings Industry Revenue Million Forecast, by Country 2019 & 2032
- Table 88: Global Polyurea Coatings Industry Volume K Tons Forecast, by Country 2019 & 2032
- Table 89: United States Polyurea Coatings Industry Revenue (Million) Forecast, by Application 2019 & 2032
- Table 90: United States Polyurea Coatings Industry Volume (K Tons) Forecast, by Application 2019 & 2032
- Table 91: Canada Polyurea Coatings Industry Revenue (Million) Forecast, by Application 2019 & 2032
- Table 92: Canada Polyurea Coatings Industry Volume (K Tons) Forecast, by Application 2019 & 2032
- Table 93: Mexico Polyurea Coatings Industry Revenue (Million) Forecast, by Application 2019 & 2032
- Table 94: Mexico Polyurea Coatings Industry Volume (K Tons) Forecast, by Application 2019 & 2032
- Table 95: Global Polyurea Coatings Industry Revenue Million Forecast, by Type 2019 & 2032
- Table 96: Global Polyurea Coatings Industry Volume K Tons Forecast, by Type 2019 & 2032
- Table 97: Global Polyurea Coatings Industry Revenue Million Forecast, by Technology 2019 & 2032
- Table 98: Global Polyurea Coatings Industry Volume K Tons Forecast, by Technology 2019 & 2032
- Table 99: Global Polyurea Coatings Industry Revenue Million Forecast, by Application 2019 & 2032
- Table 100: Global Polyurea Coatings Industry Volume K Tons Forecast, by Application 2019 & 2032
- Table 101: Global Polyurea Coatings Industry Revenue Million Forecast, by Country 2019 & 2032
- Table 102: Global Polyurea Coatings Industry Volume K Tons Forecast, by Country 2019 & 2032
- Table 103: Germany Polyurea Coatings Industry Revenue (Million) Forecast, by Application 2019 & 2032
- Table 104: Germany Polyurea Coatings Industry Volume (K Tons) Forecast, by Application 2019 & 2032
- Table 105: United Kingdom Polyurea Coatings Industry Revenue (Million) Forecast, by Application 2019 & 2032
- Table 106: United Kingdom Polyurea Coatings Industry Volume (K Tons) Forecast, by Application 2019 & 2032
- Table 107: France Polyurea Coatings Industry Revenue (Million) Forecast, by Application 2019 & 2032
- Table 108: France Polyurea Coatings Industry Volume (K Tons) Forecast, by Application 2019 & 2032
- Table 109: Italy Polyurea Coatings Industry Revenue (Million) Forecast, by Application 2019 & 2032
- Table 110: Italy Polyurea Coatings Industry Volume (K Tons) Forecast, by Application 2019 & 2032
- Table 111: Rest of Europe Polyurea Coatings Industry Revenue (Million) Forecast, by Application 2019 & 2032
- Table 112: Rest of Europe Polyurea Coatings Industry Volume (K Tons) Forecast, by Application 2019 & 2032
- Table 113: Global Polyurea Coatings Industry Revenue Million Forecast, by Type 2019 & 2032
- Table 114: Global Polyurea Coatings Industry Volume K Tons Forecast, by Type 2019 & 2032
- Table 115: Global Polyurea Coatings Industry Revenue Million Forecast, by Technology 2019 & 2032
- Table 116: Global Polyurea Coatings Industry Volume K Tons Forecast, by Technology 2019 & 2032
- Table 117: Global Polyurea Coatings Industry Revenue Million Forecast, by Application 2019 & 2032
- Table 118: Global Polyurea Coatings Industry Volume K Tons Forecast, by Application 2019 & 2032
- Table 119: Global Polyurea Coatings Industry Revenue Million Forecast, by Country 2019 & 2032
- Table 120: Global Polyurea Coatings Industry Volume K Tons Forecast, by Country 2019 & 2032
- Table 121: Brazil Polyurea Coatings Industry Revenue (Million) Forecast, by Application 2019 & 2032
- Table 122: Brazil Polyurea Coatings Industry Volume (K Tons) Forecast, by Application 2019 & 2032
- Table 123: Argentina Polyurea Coatings Industry Revenue (Million) Forecast, by Application 2019 & 2032
- Table 124: Argentina Polyurea Coatings Industry Volume (K Tons) Forecast, by Application 2019 & 2032
- Table 125: Rest of South America Polyurea Coatings Industry Revenue (Million) Forecast, by Application 2019 & 2032
- Table 126: Rest of South America Polyurea Coatings Industry Volume (K Tons) Forecast, by Application 2019 & 2032
- Table 127: Global Polyurea Coatings Industry Revenue Million Forecast, by Type 2019 & 2032
- Table 128: Global Polyurea Coatings Industry Volume K Tons Forecast, by Type 2019 & 2032
- Table 129: Global Polyurea Coatings Industry Revenue Million Forecast, by Technology 2019 & 2032
- Table 130: Global Polyurea Coatings Industry Volume K Tons Forecast, by Technology 2019 & 2032
- Table 131: Global Polyurea Coatings Industry Revenue Million Forecast, by Application 2019 & 2032
- Table 132: Global Polyurea Coatings Industry Volume K Tons Forecast, by Application 2019 & 2032
- Table 133: Global Polyurea Coatings Industry Revenue Million Forecast, by Country 2019 & 2032
- Table 134: Global Polyurea Coatings Industry Volume K Tons Forecast, by Country 2019 & 2032
- Table 135: Saudi Arabia Polyurea Coatings Industry Revenue (Million) Forecast, by Application 2019 & 2032
- Table 136: Saudi Arabia Polyurea Coatings Industry Volume (K Tons) Forecast, by Application 2019 & 2032
- Table 137: South Africa Polyurea Coatings Industry Revenue (Million) Forecast, by Application 2019 & 2032
- Table 138: South Africa Polyurea Coatings Industry Volume (K Tons) Forecast, by Application 2019 & 2032
- Table 139: Rest of Middle East and Africa Polyurea Coatings Industry Revenue (Million) Forecast, by Application 2019 & 2032
- Table 140: Rest of Middle East and Africa Polyurea Coatings Industry Volume (K Tons) Forecast, by Application 2019 & 2032
Frequently Asked Questions
1. What is the projected Compound Annual Growth Rate (CAGR) of the Polyurea Coatings Industry?
The projected CAGR is approximately > 8.00%.
2. Which companies are prominent players in the Polyurea Coatings Industry?
Key companies in the market include Rhino Linings Corporation, PPG Industries Inc, Specialty Products Inc, BASF SE, VIP Coatings Europe GmbH, Huntsman International LLC, Teknos Group, Nukote Coating Systems, KUKDO Chemical (Kunshan) Co Ltd, Armorthane.
3. What are the main segments of the Polyurea Coatings Industry?
The market segments include Type, Technology, Application.
4. Can you provide details about the market size?
The market size is estimated to be USD XX Million as of 2022.
5. What are some drivers contributing to market growth?
Growing Demand from the Construction Industry; Adoption of Regulations on VOC Emissions; Technological Advancements of Processes and Techniques Involved in Manufacturing.
6. What are the notable trends driving market growth?
Building and Construction Industry to Dominate the Market.
7. Are there any restraints impacting market growth?
Poor Color Stability on Exposure to UV Light; Unfavorable Conditions Arising Due to the COVID-19 Outbreak.
8. Can you provide examples of recent developments in the market?
In January 2021, PPG announced that it had reached a definitive agreement to acquire VersaFlex, a manufacturer specializing in polyurea, epoxy, and polyurethane coatings for water and wastewater infrastructure, flooring, transportation infrastructure, and industrial applications. VersaFlex is a portfolio company of DalFort Capital Partners. The transaction is expected to close in the first quarter of 2021, subject to customary closing conditions. Financial terms were not disclosed.
9. What pricing options are available for accessing the report?
Pricing options include single-user, multi-user, and enterprise licenses priced at USD 4750, USD 5250, and USD 8750 respectively.
10. Is the market size provided in terms of value or volume?
The market size is provided in terms of value, measured in Million and volume, measured in K Tons.
11. Are there any specific market keywords associated with the report?
Yes, the market keyword associated with the report is "Polyurea Coatings Industry," which aids in identifying and referencing the specific market segment covered.
12. How do I determine which pricing option suits my needs best?
The pricing options vary based on user requirements and access needs. Individual users may opt for single-user licenses, while businesses requiring broader access may choose multi-user or enterprise licenses for cost-effective access to the report.
13. Are there any additional resources or data provided in the Polyurea Coatings Industry report?
While the report offers comprehensive insights, it's advisable to review the specific contents or supplementary materials provided to ascertain if additional resources or data are available.
14. How can I stay updated on further developments or reports in the Polyurea Coatings Industry?
To stay informed about further developments, trends, and reports in the Polyurea Coatings Industry, consider subscribing to industry newsletters, following relevant companies and organizations, or regularly checking reputable industry news sources and publications.
Methodology
Step 1 - Identification of Relevant Samples Size from Population Database


Step 2 - Approaches for Defining Global Market Size (Value, Volume* & Price*)

Note*: In applicable scenarios
Step 3 - Data Sources
Primary Research
- Web Analytics
- Survey Reports
- Research Institute
- Latest Research Reports
- Opinion Leaders
Secondary Research
- Annual Reports
- White Paper
- Latest Press Release
- Industry Association
- Paid Database
- Investor Presentations

Step 4 - Data Triangulation
Involves using different sources of information in order to increase the validity of a study
These sources are likely to be stakeholders in a program - participants, other researchers, program staff, other community members, and so on.
Then we put all data in single framework & apply various statistical tools to find out the dynamic on the market.
During the analysis stage, feedback from the stakeholder groups would be compared to determine areas of agreement as well as areas of divergence


