Key Insights
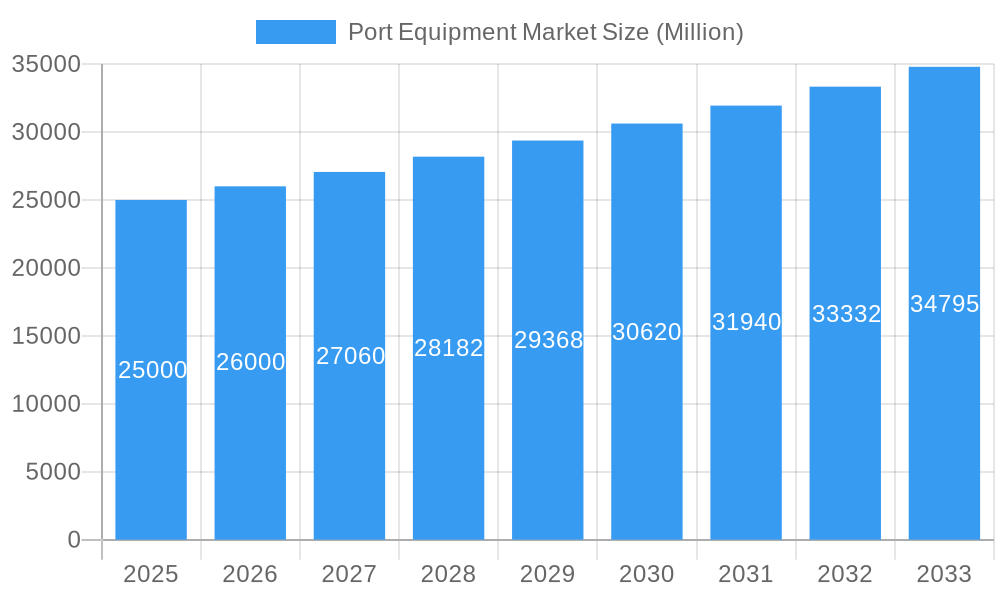
The global port equipment market is projected for substantial expansion, fueled by escalating international trade, advancements in port infrastructure, and the increasing integration of automation and electrification. This market, estimated at $20.4 billion in 2025, is expected to grow at a Compound Annual Growth Rate (CAGR) of 5.7% between 2025 and 2033. Key growth catalysts include the imperative for enhanced cargo handling efficiency to meet rising demand, the deployment of sophisticated port management systems, and significant investments in port modernization initiatives worldwide. A heightened emphasis on sustainable port operations is driving demand for electric and hybrid equipment, while the ongoing adoption of autonomous technologies is reshaping the industry.
Port Equipment Market Market Size (In Billion)
The container handling equipment segment, encompassing cranes and reach stackers, currently leads the market, driven by the robust growth in containerized cargo. Geographically, the Asia-Pacific region, particularly China and India, is anticipated to be a major growth hub due to substantial investments in port development and expansion. However, the market faces challenges, including the significant upfront investment required for automated equipment and the demand for specialized technical expertise.
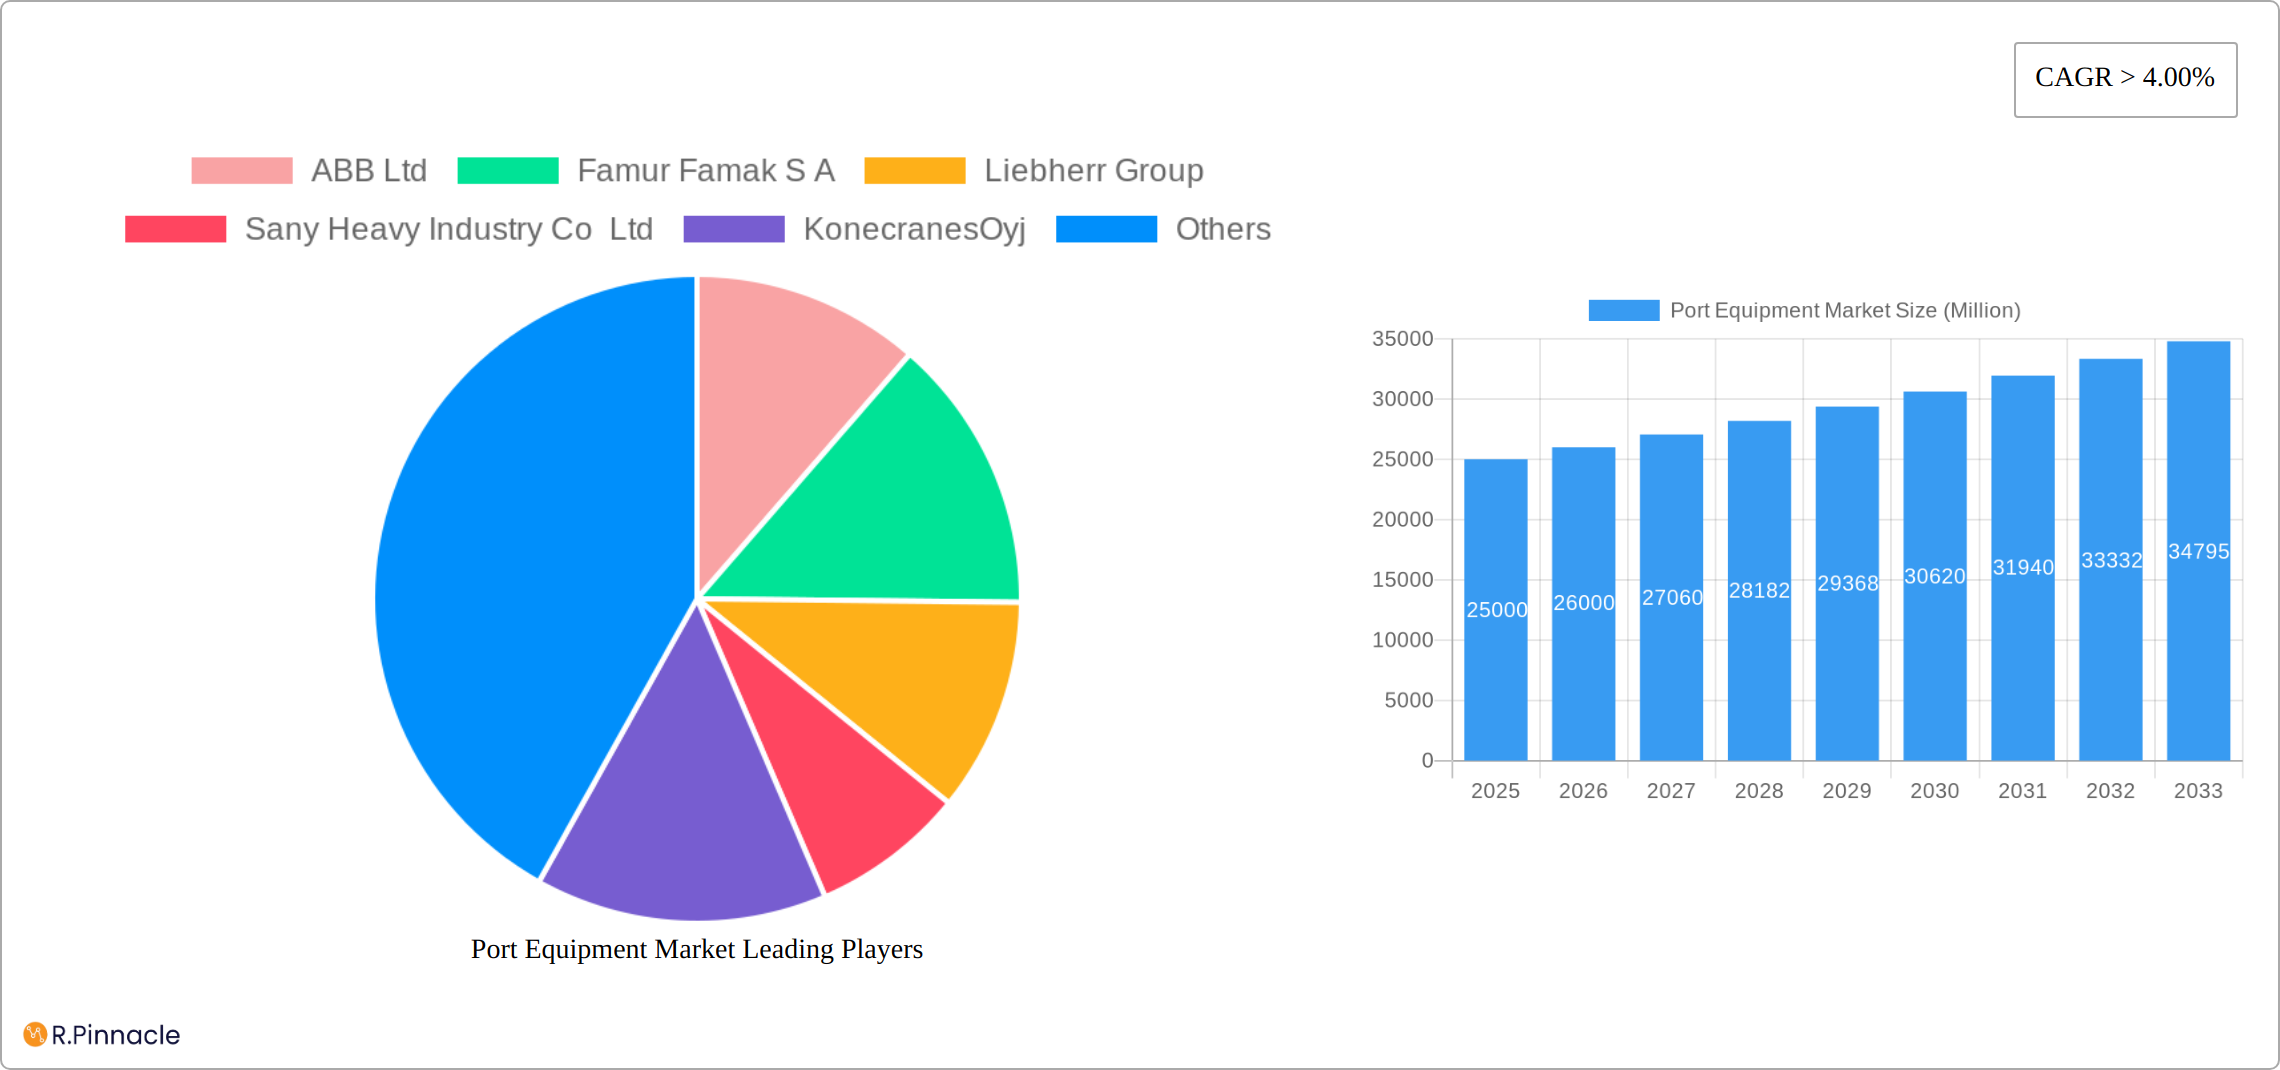
Port Equipment Market Company Market Share
Despite growth forecasts, market expansion faces constraints such as the high initial capital expenditure for advanced port equipment, which can be a barrier for smaller operators. Volatility in global trade and economic conditions also influences market demand. Moreover, the increasing complexity of port operations necessitates a highly skilled workforce for effective management and maintenance, posing a potential bottleneck. Nevertheless, supportive government policies promoting sustainable port development and automation, coupled with continuous technological advancements, are expected to overcome these challenges and ensure sustained market growth.
Intense competition among leading vendors such as ABB Ltd, Liebherr Group, and Konecranes Oyj is fostering innovation and driving the development of advanced port handling solutions, thereby boosting efficiency and productivity in global port operations.
Port Equipment Market: A Comprehensive Report (2019-2033)
This in-depth report provides a comprehensive analysis of the global Port Equipment market, offering invaluable insights for industry professionals, investors, and strategic decision-makers. Covering the period from 2019 to 2033, with a focus on 2025, this report meticulously examines market dynamics, segmentation, key players, and future growth potential. The report leverages extensive primary and secondary research to deliver actionable intelligence and accurate market forecasts.
Port Equipment Market Market Structure & Innovation Trends
The Port Equipment market is characterized by a moderately concentrated structure with several major players holding significant market share. ABB Ltd, Liebherr Group, and KonecranesOyj, among others, are key players influencing market dynamics. Market concentration is estimated at xx% in 2025, with the top 5 players controlling approximately xx% of the market. Innovation is primarily driven by the need for enhanced efficiency, automation, and environmental sustainability within port operations. Stringent regulatory frameworks concerning emissions and safety standards are further shaping innovation in the sector. Product substitution is gradually occurring with the adoption of electric and hybrid equipment, driven by environmental concerns and government incentives. The market also witnesses significant M&A activities, with deal values exceeding xx Million in the past five years. These acquisitions aim to expand product portfolios, enhance geographical reach, and consolidate market presence.
- Market Concentration: xx% in 2025
- Top 5 Players Market Share: xx%
- M&A Deal Value (Last 5 years): > xx Million
Port Equipment Market Market Dynamics & Trends
The Port Equipment market is experiencing robust growth, driven by the expanding global trade volume and the increasing demand for efficient port infrastructure. The market is expected to register a CAGR of xx% during the forecast period (2025-2033), reaching a market size of xx Million by 2033. Technological disruptions, particularly the adoption of automation and digitalization, are significantly impacting market dynamics. Consumer preferences are shifting towards eco-friendly solutions, resulting in increased demand for electric and hybrid port equipment. Competitive dynamics are intense, with key players focusing on product differentiation, technological advancements, and strategic partnerships to gain a competitive edge. Market penetration of electric and hybrid equipment is projected to reach xx% by 2033.
Dominant Regions & Segments in Port Equipment Market
The Port Equipment market is currently spearheaded by the Asia-Pacific region, a dominance fueled by its robust economic expansion, substantial investments in infrastructure development, and an ongoing surge in port capacity enhancements. Key contributors to this regional leadership include rapidly developing economies like China and India. Within the diverse array of port equipment, Cranes command the largest market share, underscoring their critical role in cargo handling. They are closely followed by the strong performance of Reach Stackers and Forklifts, essential for various logistical operations within port environments. The application segment is overwhelmingly led by Container Handling, a direct reflection of the significant and sustained growth observed in global containerized shipping volumes. While Diesel-powered equipment continues to be the prevalent fuel type, there is a discernible and accelerating shift towards the adoption of Electric and Hybrid alternatives, signaling a move towards more sustainable port operations.
- Key Drivers in Asia-Pacific: Rapid economic growth, massive infrastructure projects, increased port investments and modernization initiatives.
- Equipment Type Dominance: Cranes (projected market size of approximately $XX Million in 2025, further details in full report), Reach Stackers, and Forklifts remain critical for efficient port operations.
- Application Dominance: Container Handling continues to be the primary application driving demand for port equipment due to global trade patterns.
- Fuel Type Dominance: Diesel remains the leading fuel type, however, the adoption of Electric and Hybrid technologies is rapidly increasing driven by sustainability goals.
Port Equipment Market Product Innovations
Recent product innovations in the Port Equipment market are heavily concentrated on enhancing automation, enabling sophisticated remote control capabilities, and significantly improving fuel efficiency. Manufacturers are aggressively integrating cutting-edge technologies, including the deployment of IoT sensors for real-time data collection and AI-powered analytics to optimize port workflows, predict maintenance needs, and minimize operational downtime. A significant area of focus is the development of electric and hybrid port equipment, which directly addresses growing environmental concerns and caters to the escalating global demand for sustainable and eco-friendly solutions. These advancements are not merely incremental; they offer substantial competitive advantages by boosting operational efficiency, reducing emissions, and ensuring compliance with increasingly stringent environmental regulations, thereby driving higher market adoption rates.
Report Scope & Segmentation Analysis
This report segments the Port Equipment market across various parameters:
Equipment Type: Cranes, Trucks, Reach Stackers, Forklifts, Others (Each segment includes projected growth rates, market sizes for 2025, and competitive analysis).
Application: Container Handling, Ship Handling (Each segment includes projected growth rates, market sizes for 2025, and competitive analysis).
Fuel Type: Diesel, Electric, Hybrid (Each segment includes projected growth rates, market sizes for 2025, and competitive analysis).
Key Drivers of Port Equipment Market Growth
The growth of the Port Equipment market is fueled by several key factors: increasing global trade volume, rising demand for efficient port operations, the need for automation and digitalization, and the adoption of sustainable technologies. Government regulations promoting cleaner technologies and investments in port infrastructure further boost market growth. The expansion of e-commerce and related logistics activities also significantly contributes to market expansion.
Challenges in the Port Equipment Market Sector
The Port Equipment market is navigating a landscape marked by several significant challenges. The high initial investment costs associated with acquiring state-of-the-art, automated equipment can be a substantial barrier for some operators. Furthermore, the market is susceptible to potential supply chain disruptions, which can impact the availability and timely delivery of critical components. Intense competition among both established global players and emerging manufacturers further intensifies market dynamics. Stringent environmental regulations and their rigorous enforcement pose compliance challenges for manufacturers and operators alike. Additionally, unpredictable fluctuations in raw material prices and the broader volatility of global economic conditions can exert considerable pressure on market growth and overall profitability.
Emerging Opportunities in Port Equipment Market
The Port Equipment market is ripe with emerging opportunities, particularly in the expansion into developing economies seeking to modernize their port infrastructure. The increasing adoption of autonomous and remotely operated equipment is set to revolutionize port operations, enhancing safety and efficiency. A significant growth area lies in the escalating demand for electric and hydrogen fuel-cell powered equipment, aligning with global decarbonization efforts. The development and integration of comprehensive port management systems also present substantial opportunities for creating more efficient and interconnected port ecosystems. Moreover, the growing adoption of digital twin technologies for advanced predictive maintenance offers a promising avenue for optimizing equipment lifespan and operational reliability.
Leading Players in the Port Equipment Market Market
- ABB Ltd
- Famur Famak S A
- Liebherr Group
- Sany Heavy Industry Co Ltd
- KonecranesOyj
- Cavote
- TTS Group
- Kalmar
- CVS Ferrari
- Hyster-Yale Group
Key Developments in Port Equipment Market Industry
- 2023-Q2: ABB Ltd launched a new generation of advanced electric cranes designed for enhanced sustainability and operational efficiency.
- 2022-Q4: Liebherr Group strategically expanded its portfolio by acquiring a specialized smaller port equipment manufacturer, strengthening its market position in niche segments.
- 2021-Q3: Konecranes Oyj announced a pivotal strategic partnership aimed at accelerating the development and deployment of fully autonomous port solutions.
- (A comprehensive analysis of further significant developments will be detailed in the complete market report.)
Future Outlook for Port Equipment Market Market
The Port Equipment market is poised for continued growth, driven by long-term trends in global trade, port modernization, and the adoption of sustainable technologies. Strategic partnerships, technological advancements, and expanding market penetration in developing economies will shape future market dynamics. The focus on automation, digitalization, and sustainability will offer significant opportunities for market players in the coming years.
Port Equipment Market Segmentation
-
1. Equipment Type
- 1.1. Cranes
- 1.2. Trucks
- 1.3. Reach Stackers
- 1.4. Forklifts
- 1.5. Others
-
2. Application
- 2.1. Container Handling
- 2.2. Ship Handling
-
3. Fuel Type
- 3.1. Diesel
- 3.2. Electric
- 3.3. Hybrid
Port Equipment Market Segmentation By Geography
-
1. North America
- 1.1. United States
- 1.2. Canada
- 1.3. Rest of North America
-
2. Europe
- 2.1. Germany
- 2.2. United Kingdom
- 2.3. France
- 2.4. Rest of Europe
-
3. Asia Pacific
- 3.1. India
- 3.2. China
- 3.3. Japan
- 3.4. South Korea
- 3.5. Rest of Asia Pacific
-
4. Rest of the World
- 4.1. Brazil
- 4.2. Mexico
- 4.3. United Arab Emirates
- 4.4. Other Countries
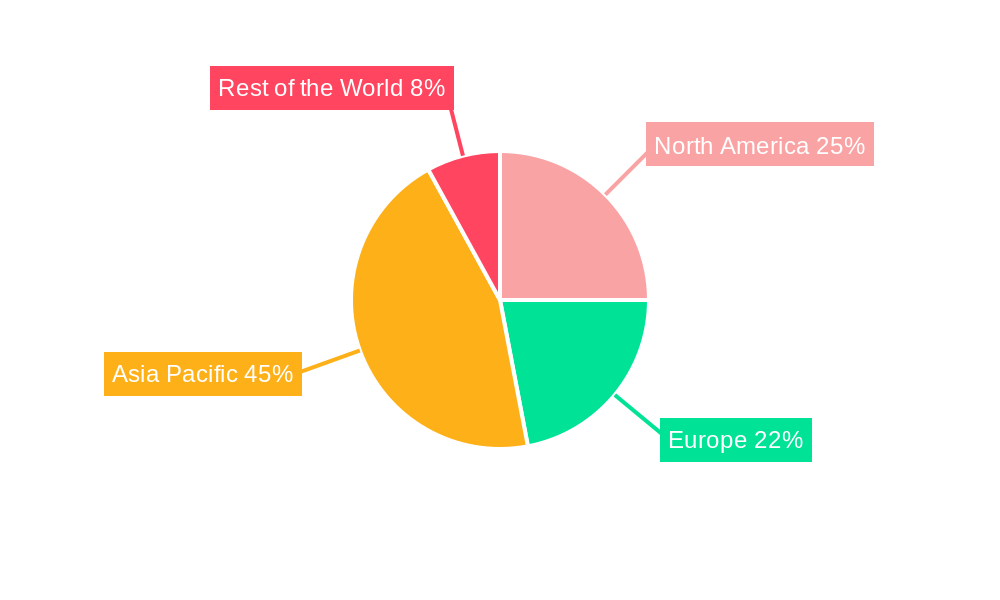
Port Equipment Market Regional Market Share
Geographic Coverage of Port Equipment Market
Port Equipment Market REPORT HIGHLIGHTS
| Aspects | Details |
|---|---|
| Study Period | 2020-2034 |
| Base Year | 2025 |
| Estimated Year | 2026 |
| Forecast Period | 2026-2034 |
| Historical Period | 2020-2025 |
| Growth Rate | CAGR of 5.7% from 2020-2034 |
| Segmentation |
|
Table of Contents
- 1. Introduction
- 1.1. Research Scope
- 1.2. Market Segmentation
- 1.3. Research Objective
- 1.4. Definitions and Assumptions
- 2. Executive Summary
- 2.1. Market Snapshot
- 3. Market Dynamics
- 3.1. Market Drivers
- 3.2. Market Restrains
- 3.3. Market Trends
- 3.4. Market Opportunities
- 4. Market Factor Analysis
- 4.1. Porters Five Forces
- 4.1.1. Bargaining Power of Suppliers
- 4.1.2. Bargaining Power of Buyers
- 4.1.3. Threat of New Entrants
- 4.1.4. Threat of Substitutes
- 4.1.5. Competitive Rivalry
- 4.2. PESTEL analysis
- 4.3. BCG Analysis
- 4.3.1. Stars (High Growth, High Market Share)
- 4.3.2. Cash Cows (Low Growth, High Market Share)
- 4.3.3. Question Mark (High Growth, Low Market Share)
- 4.3.4. Dogs (Low Growth, Low Market Share)
- 4.4. Ansoff Matrix Analysis
- 4.5. Supply Chain Analysis
- 4.6. Regulatory Landscape
- 4.7. Current Market Potential and Opportunity Assessment (TAM–SAM–SOM Framework)
- 4.8. PRI Analyst Note
- 4.1. Porters Five Forces
- 5. Market Analysis, Insights and Forecast 2021-2033
- 5.1. Market Analysis, Insights and Forecast - by Equipment Type
- 5.1.1. Cranes
- 5.1.2. Trucks
- 5.1.3. Reach Stackers
- 5.1.4. Forklifts
- 5.1.5. Others
- 5.2. Market Analysis, Insights and Forecast - by Application
- 5.2.1. Container Handling
- 5.2.2. Ship Handling
- 5.3. Market Analysis, Insights and Forecast - by Fuel Type
- 5.3.1. Diesel
- 5.3.2. Electric
- 5.3.3. Hybrid
- 5.4. Market Analysis, Insights and Forecast - by Region
- 5.4.1. North America
- 5.4.2. Europe
- 5.4.3. Asia Pacific
- 5.4.4. Rest of the World
- 5.1. Market Analysis, Insights and Forecast - by Equipment Type
- 6. Global Port Equipment Market Analysis, Insights and Forecast, 2021-2033
- 6.1. Market Analysis, Insights and Forecast - by Equipment Type
- 6.1.1. Cranes
- 6.1.2. Trucks
- 6.1.3. Reach Stackers
- 6.1.4. Forklifts
- 6.1.5. Others
- 6.2. Market Analysis, Insights and Forecast - by Application
- 6.2.1. Container Handling
- 6.2.2. Ship Handling
- 6.3. Market Analysis, Insights and Forecast - by Fuel Type
- 6.3.1. Diesel
- 6.3.2. Electric
- 6.3.3. Hybrid
- 6.1. Market Analysis, Insights and Forecast - by Equipment Type
- 7. North America Port Equipment Market Analysis, Insights and Forecast, 2020-2032
- 7.1. Market Analysis, Insights and Forecast - by Equipment Type
- 7.1.1. Cranes
- 7.1.2. Trucks
- 7.1.3. Reach Stackers
- 7.1.4. Forklifts
- 7.1.5. Others
- 7.2. Market Analysis, Insights and Forecast - by Application
- 7.2.1. Container Handling
- 7.2.2. Ship Handling
- 7.3. Market Analysis, Insights and Forecast - by Fuel Type
- 7.3.1. Diesel
- 7.3.2. Electric
- 7.3.3. Hybrid
- 7.1. Market Analysis, Insights and Forecast - by Equipment Type
- 8. Europe Port Equipment Market Analysis, Insights and Forecast, 2020-2032
- 8.1. Market Analysis, Insights and Forecast - by Equipment Type
- 8.1.1. Cranes
- 8.1.2. Trucks
- 8.1.3. Reach Stackers
- 8.1.4. Forklifts
- 8.1.5. Others
- 8.2. Market Analysis, Insights and Forecast - by Application
- 8.2.1. Container Handling
- 8.2.2. Ship Handling
- 8.3. Market Analysis, Insights and Forecast - by Fuel Type
- 8.3.1. Diesel
- 8.3.2. Electric
- 8.3.3. Hybrid
- 8.1. Market Analysis, Insights and Forecast - by Equipment Type
- 9. Asia Pacific Port Equipment Market Analysis, Insights and Forecast, 2020-2032
- 9.1. Market Analysis, Insights and Forecast - by Equipment Type
- 9.1.1. Cranes
- 9.1.2. Trucks
- 9.1.3. Reach Stackers
- 9.1.4. Forklifts
- 9.1.5. Others
- 9.2. Market Analysis, Insights and Forecast - by Application
- 9.2.1. Container Handling
- 9.2.2. Ship Handling
- 9.3. Market Analysis, Insights and Forecast - by Fuel Type
- 9.3.1. Diesel
- 9.3.2. Electric
- 9.3.3. Hybrid
- 9.1. Market Analysis, Insights and Forecast - by Equipment Type
- 10. Rest of the World Port Equipment Market Analysis, Insights and Forecast, 2020-2032
- 10.1. Market Analysis, Insights and Forecast - by Equipment Type
- 10.1.1. Cranes
- 10.1.2. Trucks
- 10.1.3. Reach Stackers
- 10.1.4. Forklifts
- 10.1.5. Others
- 10.2. Market Analysis, Insights and Forecast - by Application
- 10.2.1. Container Handling
- 10.2.2. Ship Handling
- 10.3. Market Analysis, Insights and Forecast - by Fuel Type
- 10.3.1. Diesel
- 10.3.2. Electric
- 10.3.3. Hybrid
- 10.1. Market Analysis, Insights and Forecast - by Equipment Type
- 11. Competitive Analysis
- 11.1. Company Profiles
- 11.1.1 ABB Ltd
- 11.1.1.1. Company Overview
- 11.1.1.2. Products
- 11.1.1.3. Company Financials
- 11.1.1.4. SWOT Analysis
- 11.1.2 Famur Famak S A
- 11.1.2.1. Company Overview
- 11.1.2.2. Products
- 11.1.2.3. Company Financials
- 11.1.2.4. SWOT Analysis
- 11.1.3 Liebherr Group
- 11.1.3.1. Company Overview
- 11.1.3.2. Products
- 11.1.3.3. Company Financials
- 11.1.3.4. SWOT Analysis
- 11.1.4 Sany Heavy Industry Co Ltd
- 11.1.4.1. Company Overview
- 11.1.4.2. Products
- 11.1.4.3. Company Financials
- 11.1.4.4. SWOT Analysis
- 11.1.5 KonecranesOyj
- 11.1.5.1. Company Overview
- 11.1.5.2. Products
- 11.1.5.3. Company Financials
- 11.1.5.4. SWOT Analysis
- 11.1.6 Cavote
- 11.1.6.1. Company Overview
- 11.1.6.2. Products
- 11.1.6.3. Company Financials
- 11.1.6.4. SWOT Analysis
- 11.1.7 TTS Group
- 11.1.7.1. Company Overview
- 11.1.7.2. Products
- 11.1.7.3. Company Financials
- 11.1.7.4. SWOT Analysis
- 11.1.8 Kalmar
- 11.1.8.1. Company Overview
- 11.1.8.2. Products
- 11.1.8.3. Company Financials
- 11.1.8.4. SWOT Analysis
- 11.1.9 CVS Ferrari
- 11.1.9.1. Company Overview
- 11.1.9.2. Products
- 11.1.9.3. Company Financials
- 11.1.9.4. SWOT Analysis
- 11.1.10 Hyster-Yale Group
- 11.1.10.1. Company Overview
- 11.1.10.2. Products
- 11.1.10.3. Company Financials
- 11.1.10.4. SWOT Analysis
- 11.1.1 ABB Ltd
- 11.2. Market Entropy
- 11.2.1 Company's Key Areas Served
- 11.2.2 Recent Developments
- 11.3. Company Market Share Analysis 2025
- 11.3.1 Top 5 Companies Market Share Analysis
- 11.3.2 Top 3 Companies Market Share Analysis
- 11.4. List of Potential Customers
- 12. Research Methodology
List of Figures
- Figure 1: Global Port Equipment Market Revenue Breakdown (billion, %) by Region 2025 & 2033
- Figure 2: North America Port Equipment Market Revenue (billion), by Equipment Type 2025 & 2033
- Figure 3: North America Port Equipment Market Revenue Share (%), by Equipment Type 2025 & 2033
- Figure 4: North America Port Equipment Market Revenue (billion), by Application 2025 & 2033
- Figure 5: North America Port Equipment Market Revenue Share (%), by Application 2025 & 2033
- Figure 6: North America Port Equipment Market Revenue (billion), by Fuel Type 2025 & 2033
- Figure 7: North America Port Equipment Market Revenue Share (%), by Fuel Type 2025 & 2033
- Figure 8: North America Port Equipment Market Revenue (billion), by Country 2025 & 2033
- Figure 9: North America Port Equipment Market Revenue Share (%), by Country 2025 & 2033
- Figure 10: Europe Port Equipment Market Revenue (billion), by Equipment Type 2025 & 2033
- Figure 11: Europe Port Equipment Market Revenue Share (%), by Equipment Type 2025 & 2033
- Figure 12: Europe Port Equipment Market Revenue (billion), by Application 2025 & 2033
- Figure 13: Europe Port Equipment Market Revenue Share (%), by Application 2025 & 2033
- Figure 14: Europe Port Equipment Market Revenue (billion), by Fuel Type 2025 & 2033
- Figure 15: Europe Port Equipment Market Revenue Share (%), by Fuel Type 2025 & 2033
- Figure 16: Europe Port Equipment Market Revenue (billion), by Country 2025 & 2033
- Figure 17: Europe Port Equipment Market Revenue Share (%), by Country 2025 & 2033
- Figure 18: Asia Pacific Port Equipment Market Revenue (billion), by Equipment Type 2025 & 2033
- Figure 19: Asia Pacific Port Equipment Market Revenue Share (%), by Equipment Type 2025 & 2033
- Figure 20: Asia Pacific Port Equipment Market Revenue (billion), by Application 2025 & 2033
- Figure 21: Asia Pacific Port Equipment Market Revenue Share (%), by Application 2025 & 2033
- Figure 22: Asia Pacific Port Equipment Market Revenue (billion), by Fuel Type 2025 & 2033
- Figure 23: Asia Pacific Port Equipment Market Revenue Share (%), by Fuel Type 2025 & 2033
- Figure 24: Asia Pacific Port Equipment Market Revenue (billion), by Country 2025 & 2033
- Figure 25: Asia Pacific Port Equipment Market Revenue Share (%), by Country 2025 & 2033
- Figure 26: Rest of the World Port Equipment Market Revenue (billion), by Equipment Type 2025 & 2033
- Figure 27: Rest of the World Port Equipment Market Revenue Share (%), by Equipment Type 2025 & 2033
- Figure 28: Rest of the World Port Equipment Market Revenue (billion), by Application 2025 & 2033
- Figure 29: Rest of the World Port Equipment Market Revenue Share (%), by Application 2025 & 2033
- Figure 30: Rest of the World Port Equipment Market Revenue (billion), by Fuel Type 2025 & 2033
- Figure 31: Rest of the World Port Equipment Market Revenue Share (%), by Fuel Type 2025 & 2033
- Figure 32: Rest of the World Port Equipment Market Revenue (billion), by Country 2025 & 2033
- Figure 33: Rest of the World Port Equipment Market Revenue Share (%), by Country 2025 & 2033
List of Tables
- Table 1: Global Port Equipment Market Revenue billion Forecast, by Equipment Type 2020 & 2033
- Table 2: Global Port Equipment Market Revenue billion Forecast, by Application 2020 & 2033
- Table 3: Global Port Equipment Market Revenue billion Forecast, by Fuel Type 2020 & 2033
- Table 4: Global Port Equipment Market Revenue billion Forecast, by Region 2020 & 2033
- Table 5: Global Port Equipment Market Revenue billion Forecast, by Equipment Type 2020 & 2033
- Table 6: Global Port Equipment Market Revenue billion Forecast, by Application 2020 & 2033
- Table 7: Global Port Equipment Market Revenue billion Forecast, by Fuel Type 2020 & 2033
- Table 8: Global Port Equipment Market Revenue billion Forecast, by Country 2020 & 2033
- Table 9: United States Port Equipment Market Revenue (billion) Forecast, by Application 2020 & 2033
- Table 10: Canada Port Equipment Market Revenue (billion) Forecast, by Application 2020 & 2033
- Table 11: Rest of North America Port Equipment Market Revenue (billion) Forecast, by Application 2020 & 2033
- Table 12: Global Port Equipment Market Revenue billion Forecast, by Equipment Type 2020 & 2033
- Table 13: Global Port Equipment Market Revenue billion Forecast, by Application 2020 & 2033
- Table 14: Global Port Equipment Market Revenue billion Forecast, by Fuel Type 2020 & 2033
- Table 15: Global Port Equipment Market Revenue billion Forecast, by Country 2020 & 2033
- Table 16: Germany Port Equipment Market Revenue (billion) Forecast, by Application 2020 & 2033
- Table 17: United Kingdom Port Equipment Market Revenue (billion) Forecast, by Application 2020 & 2033
- Table 18: France Port Equipment Market Revenue (billion) Forecast, by Application 2020 & 2033
- Table 19: Rest of Europe Port Equipment Market Revenue (billion) Forecast, by Application 2020 & 2033
- Table 20: Global Port Equipment Market Revenue billion Forecast, by Equipment Type 2020 & 2033
- Table 21: Global Port Equipment Market Revenue billion Forecast, by Application 2020 & 2033
- Table 22: Global Port Equipment Market Revenue billion Forecast, by Fuel Type 2020 & 2033
- Table 23: Global Port Equipment Market Revenue billion Forecast, by Country 2020 & 2033
- Table 24: India Port Equipment Market Revenue (billion) Forecast, by Application 2020 & 2033
- Table 25: China Port Equipment Market Revenue (billion) Forecast, by Application 2020 & 2033
- Table 26: Japan Port Equipment Market Revenue (billion) Forecast, by Application 2020 & 2033
- Table 27: South Korea Port Equipment Market Revenue (billion) Forecast, by Application 2020 & 2033
- Table 28: Rest of Asia Pacific Port Equipment Market Revenue (billion) Forecast, by Application 2020 & 2033
- Table 29: Global Port Equipment Market Revenue billion Forecast, by Equipment Type 2020 & 2033
- Table 30: Global Port Equipment Market Revenue billion Forecast, by Application 2020 & 2033
- Table 31: Global Port Equipment Market Revenue billion Forecast, by Fuel Type 2020 & 2033
- Table 32: Global Port Equipment Market Revenue billion Forecast, by Country 2020 & 2033
- Table 33: Brazil Port Equipment Market Revenue (billion) Forecast, by Application 2020 & 2033
- Table 34: Mexico Port Equipment Market Revenue (billion) Forecast, by Application 2020 & 2033
- Table 35: United Arab Emirates Port Equipment Market Revenue (billion) Forecast, by Application 2020 & 2033
- Table 36: Other Countries Port Equipment Market Revenue (billion) Forecast, by Application 2020 & 2033
Frequently Asked Questions
1. What is the projected Compound Annual Growth Rate (CAGR) of the Port Equipment Market?
The projected CAGR is approximately 5.7%.
2. Which companies are prominent players in the Port Equipment Market?
Key companies in the market include ABB Ltd, Famur Famak S A, Liebherr Group, Sany Heavy Industry Co Ltd, KonecranesOyj, Cavote, TTS Group, Kalmar, CVS Ferrari, Hyster-Yale Group.
3. What are the main segments of the Port Equipment Market?
The market segments include Equipment Type, Application, Fuel Type.
4. Can you provide details about the market size?
The market size is estimated to be USD 20.4 billion as of 2022.
5. What are some drivers contributing to market growth?
Increasing disposable income and Low-interest rates from lenders increase the market demand.
6. What are the notable trends driving market growth?
Government Initiatives for Development of Ports are Driving the Market.
7. Are there any restraints impacting market growth?
High initial costs may obstruct the growth.
8. Can you provide examples of recent developments in the market?
N/A
9. What pricing options are available for accessing the report?
Pricing options include single-user, multi-user, and enterprise licenses priced at USD 4750, USD 5250, and USD 8750 respectively.
10. Is the market size provided in terms of value or volume?
The market size is provided in terms of value, measured in billion.
11. Are there any specific market keywords associated with the report?
Yes, the market keyword associated with the report is "Port Equipment Market," which aids in identifying and referencing the specific market segment covered.
12. How do I determine which pricing option suits my needs best?
The pricing options vary based on user requirements and access needs. Individual users may opt for single-user licenses, while businesses requiring broader access may choose multi-user or enterprise licenses for cost-effective access to the report.
13. Are there any additional resources or data provided in the Port Equipment Market report?
While the report offers comprehensive insights, it's advisable to review the specific contents or supplementary materials provided to ascertain if additional resources or data are available.
14. How can I stay updated on further developments or reports in the Port Equipment Market?
To stay informed about further developments, trends, and reports in the Port Equipment Market, consider subscribing to industry newsletters, following relevant companies and organizations, or regularly checking reputable industry news sources and publications.
Methodology
Step 1 - Identification of Relevant Samples Size from Population Database


Step 2 - Approaches for Defining Global Market Size (Value, Volume* & Price*)

Note*: In applicable scenarios
Step 3 - Data Sources
Primary Research
- Web Analytics
- Survey Reports
- Research Institute
- Latest Research Reports
- Opinion Leaders
Secondary Research
- Annual Reports
- White Paper
- Latest Press Release
- Industry Association
- Paid Database
- Investor Presentations

Step 4 - Data Triangulation
Involves using different sources of information in order to increase the validity of a study
These sources are likely to be stakeholders in a program - participants, other researchers, program staff, other community members, and so on.
Then we put all data in single framework & apply various statistical tools to find out the dynamic on the market.
During the analysis stage, feedback from the stakeholder groups would be compared to determine areas of agreement as well as areas of divergence

