
Key Insights
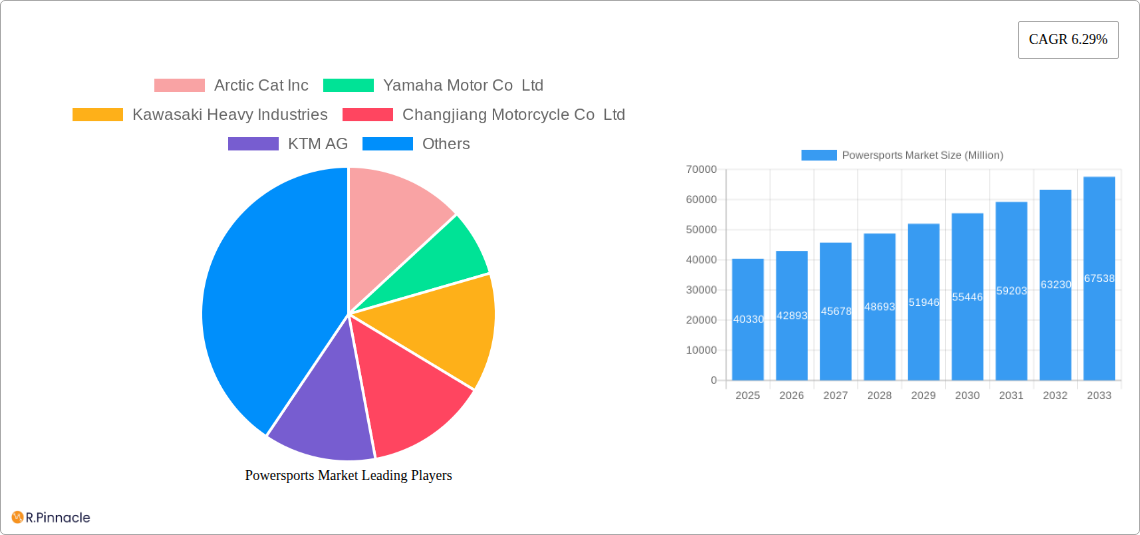
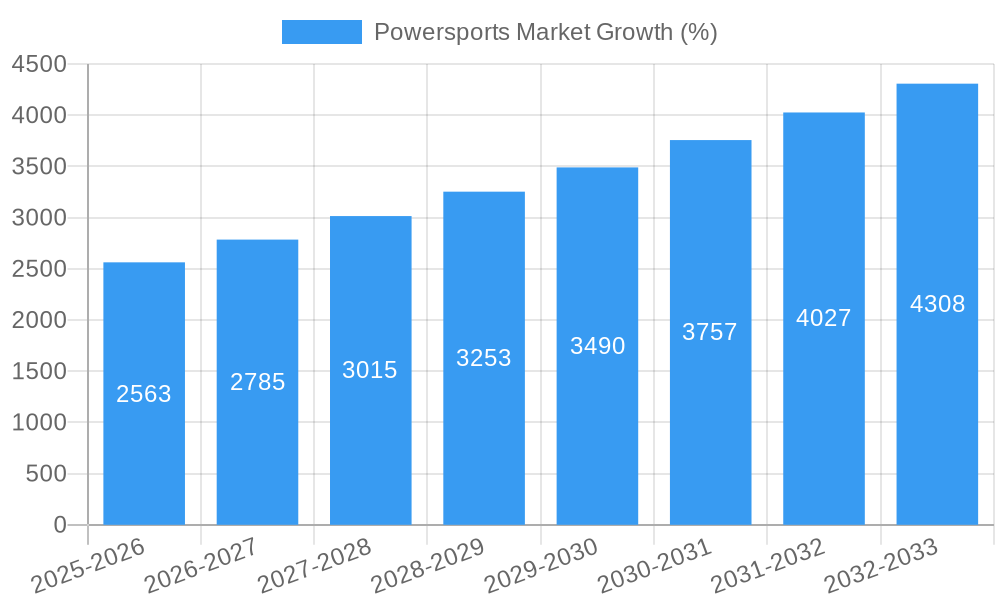
The powersports market, valued at $40.33 billion in 2025, is projected to experience robust growth, driven by a Compound Annual Growth Rate (CAGR) of 6.29% from 2025 to 2033. This expansion is fueled by several key factors. Firstly, increasing disposable incomes in developing economies, coupled with a growing preference for outdoor recreational activities, are significantly boosting demand for powersports vehicles. The rising popularity of adventure tourism and off-roading further contributes to this trend. Secondly, technological advancements in engine technology, particularly the integration of electric propulsion systems, are attracting environmentally conscious consumers and expanding the market's appeal. Furthermore, manufacturers are continuously innovating to improve vehicle performance, safety features, and overall riding experience, leading to enhanced consumer satisfaction and repeat purchases. The market is segmented by vehicle type (personal watercrafts, ATVs, heavyweight motorcycles, side-by-side vehicles, snowmobiles), propulsion (diesel, gasoline, electric), and application (on-road, off-road), offering diverse options to cater to a wide range of consumer preferences.
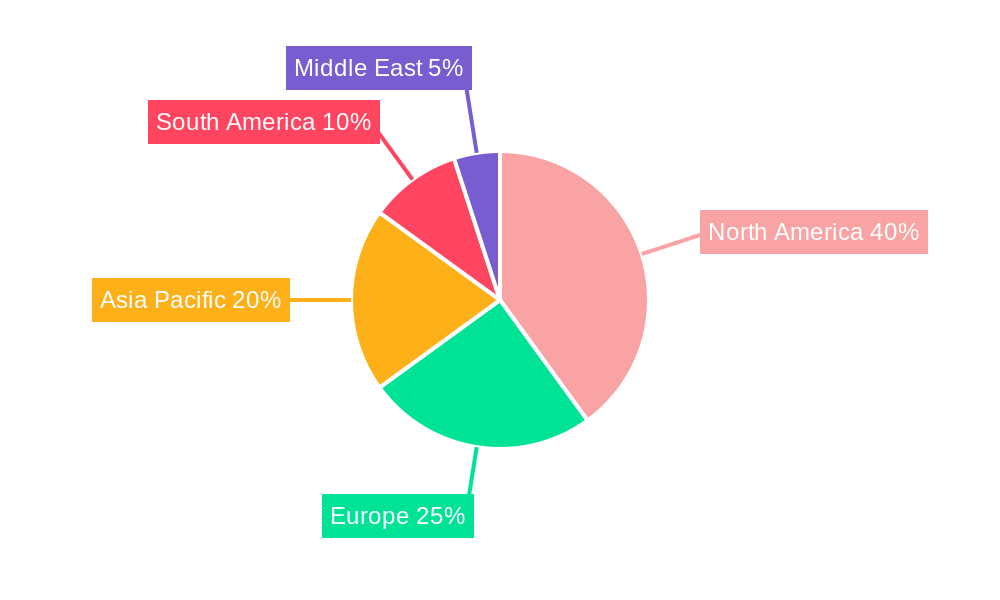
However, the market also faces certain challenges. Stringent emission regulations in several regions are impacting the adoption of gasoline-powered vehicles, pushing manufacturers towards electric and hybrid options. Fluctuations in raw material prices and the overall economic climate can influence production costs and consumer spending, potentially affecting market growth. Furthermore, safety concerns related to powersports vehicles, especially among younger riders, necessitate increased awareness campaigns and safety feature advancements to mitigate potential risks and maintain positive market perception. Despite these restraints, the overall outlook remains positive, with the market poised for sustained growth driven by evolving consumer preferences and technological progress. Key players like Arctic Cat, Yamaha, Kawasaki, and Polaris are strategically positioning themselves to capitalize on emerging opportunities within this dynamic market landscape. Regional variations in market penetration exist, with North America currently holding a significant market share, followed by the Asia-Pacific region experiencing rapid growth potential.
Powersports Market Report: 2019-2033 Forecast
This comprehensive report provides an in-depth analysis of the global Powersports market, offering valuable insights for industry professionals, investors, and stakeholders. Covering the period from 2019 to 2033, with a focus on 2025, this report meticulously examines market dynamics, segment performance, key players, and future growth prospects. The study period (2019-2024) forms the historical baseline, informing the forecast period (2025-2033) and the estimated year (2025).
Powersports Market Structure & Innovation Trends
This section analyzes the competitive landscape of the Powersports market, encompassing market concentration, innovation drivers, regulatory frameworks, and significant M&A activities. The market is characterized by a mix of established players and emerging companies, leading to a dynamic competitive environment.
Market Concentration: The market exhibits a moderately concentrated structure, with key players like Polaris Inc, Yamaha Motor Co Ltd, and Honda Motor Co Ltd holding significant market share. However, smaller players and niche brands contribute significantly to overall market diversity. Precise market share figures for each company will vary, depending on the segment and year.
Innovation Drivers: Key drivers include advancements in engine technology (e.g., electric propulsion systems), enhanced safety features, connectivity integrations (e.g., smartphone apps), and the development of specialized vehicles for various terrains and applications.
Regulatory Frameworks: Government regulations concerning emissions standards, safety requirements, and off-road access impact market dynamics. Variations in these regulations across different regions are expected to shape product development and market penetration.
Product Substitutes: Competition from other leisure activities and alternative modes of transportation (e.g., e-bikes) presents indirect competitive pressure.
End-User Demographics: The market is driven by a diverse range of users, including recreational enthusiasts, professional riders, and commercial users. Detailed demographic segmentation is available within the full report.
M&A Activities: The Powersports industry has witnessed significant M&A activity in recent years, exemplified by Patrick Industries' acquisitions of suppliers and Sportech LLC, enhancing their market presence and product portfolio. The total value of these deals exceeded xx Million, underscoring the consolidation trend.
Powersports Market Dynamics & Trends
This section delves into the factors influencing Powersports market growth, including technological advancements, consumer preferences, and competitive dynamics. The market is projected to experience a CAGR of xx% during the forecast period (2025-2033), driven by factors such as increasing disposable incomes, rising demand for outdoor recreational activities, and technological innovation.
The increasing penetration of electric and hybrid powertrains is disrupting traditional gasoline-powered models, and a substantial increase in market penetration is predicted within the next decade.
The popularity of off-road vehicles, personal watercrafts, and snowmobiles continues to fuel the market, while the emerging preference for more sustainable and technologically advanced vehicles will significantly change the dynamics.
Competitive rivalry among major players is intense, with companies focusing on product innovation, strategic partnerships, and geographical expansion to maintain their market share.
Dominant Regions & Segments in Powersports Market
This section analyzes the leading regions and segments within the Powersports market. North America currently dominates the market, owing to a robust economy, well-established infrastructure, and high demand for recreational vehicles. However, the Asia-Pacific region is projected to experience the highest growth rate over the forecast period.
Key Drivers for North America: High disposable incomes, strong consumer preference for outdoor recreation, and a well-developed dealer network.
Key Drivers for Asia-Pacific: Rapid economic growth, rising middle class, and increasing adoption of powersports activities.
Dominant Vehicle Types: All-terrain vehicles (ATVs) and side-by-side vehicles (SxS) represent the largest segments, followed by motorcycles, personal watercrafts, and snowmobiles. The report provides a detailed breakdown of market size and growth projections for each vehicle type.
Dominant Propulsion Types: Gasoline-powered vehicles currently dominate the market, but the electric segment is expected to gain significant traction.
Dominant Applications: The off-road segment holds a significant market share, reflecting the preference for adventure and recreational uses. However, the on-road segment also exhibits substantial growth.
Powersports Market Product Innovations
Recent years have seen significant product developments in the Powersports industry, focusing on enhanced performance, improved safety, and increased connectivity. Manufacturers are incorporating advanced technologies such as electric propulsion systems, advanced driver-assistance systems (ADAS), and integrated infotainment systems. This leads to a wider range of vehicles catering to diverse consumer needs and preferences, improving market fit.
Report Scope & Segmentation Analysis
This report segments the Powersports market based on vehicle type (personal watercrafts, ATVs, heavyweight motorcycles, side-by-side vehicles, snowmobiles), propulsion type (diesel, gasoline, electric), and application (on-road, off-road). Each segment is analyzed individually, providing detailed insights into market size, growth projections, and competitive dynamics. For example, the electric propulsion segment is expected to experience rapid growth, driven by environmental concerns and technological advancements.
Key Drivers of Powersports Market Growth
The Powersports market is experiencing growth due to several factors. Increasing disposable incomes, particularly in developing economies, allow consumers to engage in recreational activities like powersports. The rising popularity of adventure tourism and outdoor recreation further fuels demand. Technological advancements, such as electric and hybrid powertrains, attract environmentally-conscious consumers. Favorable government policies promoting tourism and recreational activities also provide a positive boost.
Challenges in the Powersports Market Sector
The Powersports market faces several challenges. Stricter environmental regulations concerning emissions and noise pollution require manufacturers to invest in cleaner technologies, increasing production costs. The global supply chain disruptions caused by geopolitical instability and pandemics have impacted the availability of components, increasing production costs and delivery times. Intense competition among major players creates pressure on profit margins.
Emerging Opportunities in Powersports Market
The Powersports market presents several lucrative opportunities. The growing demand for electric and autonomous vehicles opens new avenues for innovation and market expansion. Developing markets, particularly in Asia and Latin America, represent substantial growth potential. Focusing on customized vehicles and offering specialized services can enhance customer engagement and brand loyalty.
Leading Players in the Powersports Market
- Arctic Cat Inc
- Yamaha Motor Co Ltd
- Kawasaki Heavy Industries
- Changjiang Motorcycle Co Ltd
- KTM AG
- Harley-Davidson Inc
- BRP Inc
- Honda Motor Co Ltd
- Polaris Inc
- Suzuki Motor Corporation
Key Developments in Powersports Market Industry
- January 2024: Patrick Industries acquired a supplier for Powersports OEMs, expanding its presence and offerings.
- January 2024: Patrick Industries Inc. acquired Sportech LLC, further strengthening its market position.
- March 2023: Polaris launched Polaris Xchange, an OEM-supported marketplace for pre-owned Powersports vehicles.
- October 2023: Cardo Systems partnered with 509 to integrate communication technology into 509's helmets.
Future Outlook for Powersports Market
The Powersports market is poised for continued growth, driven by increasing consumer demand, technological advancements, and expanding market penetration in developing economies. Strategic partnerships, product diversification, and a focus on sustainable practices will be crucial for success in this dynamic market. The integration of new technologies and the development of niche markets will open up new avenues for expansion and revenue generation.
Powersports Market Segmentation
-
1. Vehicle type
- 1.1. Personal watercrafts
- 1.2. All-terrain vehicles
- 1.3. Heavy weight motorcycles
- 1.4. Side by side vehicles
- 1.5. Snow mobiles
-
2. Propulsion
- 2.1. Diesel
- 2.2. Gasoline
- 2.3. Electric
-
3. Application
- 3.1. On-Road
- 3.2. Off-Road
Powersports Market Segmentation By Geography
-
1. North America
- 1.1. US
- 1.2. Canada
- 1.3. Mexico
- 1.4. Rest of North America
-
2. Europe
- 2.1. Germany
- 2.2. UK
- 2.3. France
- 2.4. Russia
- 2.5. Spain
- 2.6. Rest of Europe
-
3. Asia Pacific
- 3.1. India
- 3.2. China
- 3.3. Japan
- 3.4. Rest of Asia Pacific
-
4. South America
- 4.1. Brazil
- 4.2. Argentina
-
5. Middle East
- 5.1. UAE
- 5.2. Saudi Arabia
- 5.3. Rest of Middle East
Powersports Market REPORT HIGHLIGHTS
| Aspects | Details |
|---|---|
| Study Period | 2019-2033 |
| Base Year | 2024 |
| Estimated Year | 2025 |
| Forecast Period | 2025-2033 |
| Historical Period | 2019-2024 |
| Growth Rate | CAGR of 6.29% from 2019-2033 |
| Segmentation |
|
Table of Contents
- 1. Introduction
- 1.1. Research Scope
- 1.2. Market Segmentation
- 1.3. Research Methodology
- 1.4. Definitions and Assumptions
- 2. Executive Summary
- 2.1. Introduction
- 3. Market Dynamics
- 3.1. Introduction
- 3.2. Market Drivers
- 3.2.1. Increasing disposable income and consumer preferences for adventure sports propel the market growth
- 3.3. Market Restrains
- 3.3.1. High initial investment and maintenance costs obstruct the market growth
- 3.4. Market Trends
- 3.4.1. Changing Consumer Preferences due to technological Advancements Drives the Demand in the Market
- 4. Market Factor Analysis
- 4.1. Porters Five Forces
- 4.2. Supply/Value Chain
- 4.3. PESTEL analysis
- 4.4. Market Entropy
- 4.5. Patent/Trademark Analysis
- 5. Global Powersports Market Analysis, Insights and Forecast, 2019-2031
- 5.1. Market Analysis, Insights and Forecast - by Vehicle type
- 5.1.1. Personal watercrafts
- 5.1.2. All-terrain vehicles
- 5.1.3. Heavy weight motorcycles
- 5.1.4. Side by side vehicles
- 5.1.5. Snow mobiles
- 5.2. Market Analysis, Insights and Forecast - by Propulsion
- 5.2.1. Diesel
- 5.2.2. Gasoline
- 5.2.3. Electric
- 5.3. Market Analysis, Insights and Forecast - by Application
- 5.3.1. On-Road
- 5.3.2. Off-Road
- 5.4. Market Analysis, Insights and Forecast - by Region
- 5.4.1. North America
- 5.4.2. Europe
- 5.4.3. Asia Pacific
- 5.4.4. South America
- 5.4.5. Middle East
- 5.1. Market Analysis, Insights and Forecast - by Vehicle type
- 6. North America Powersports Market Analysis, Insights and Forecast, 2019-2031
- 6.1. Market Analysis, Insights and Forecast - by Vehicle type
- 6.1.1. Personal watercrafts
- 6.1.2. All-terrain vehicles
- 6.1.3. Heavy weight motorcycles
- 6.1.4. Side by side vehicles
- 6.1.5. Snow mobiles
- 6.2. Market Analysis, Insights and Forecast - by Propulsion
- 6.2.1. Diesel
- 6.2.2. Gasoline
- 6.2.3. Electric
- 6.3. Market Analysis, Insights and Forecast - by Application
- 6.3.1. On-Road
- 6.3.2. Off-Road
- 6.1. Market Analysis, Insights and Forecast - by Vehicle type
- 7. Europe Powersports Market Analysis, Insights and Forecast, 2019-2031
- 7.1. Market Analysis, Insights and Forecast - by Vehicle type
- 7.1.1. Personal watercrafts
- 7.1.2. All-terrain vehicles
- 7.1.3. Heavy weight motorcycles
- 7.1.4. Side by side vehicles
- 7.1.5. Snow mobiles
- 7.2. Market Analysis, Insights and Forecast - by Propulsion
- 7.2.1. Diesel
- 7.2.2. Gasoline
- 7.2.3. Electric
- 7.3. Market Analysis, Insights and Forecast - by Application
- 7.3.1. On-Road
- 7.3.2. Off-Road
- 7.1. Market Analysis, Insights and Forecast - by Vehicle type
- 8. Asia Pacific Powersports Market Analysis, Insights and Forecast, 2019-2031
- 8.1. Market Analysis, Insights and Forecast - by Vehicle type
- 8.1.1. Personal watercrafts
- 8.1.2. All-terrain vehicles
- 8.1.3. Heavy weight motorcycles
- 8.1.4. Side by side vehicles
- 8.1.5. Snow mobiles
- 8.2. Market Analysis, Insights and Forecast - by Propulsion
- 8.2.1. Diesel
- 8.2.2. Gasoline
- 8.2.3. Electric
- 8.3. Market Analysis, Insights and Forecast - by Application
- 8.3.1. On-Road
- 8.3.2. Off-Road
- 8.1. Market Analysis, Insights and Forecast - by Vehicle type
- 9. South America Powersports Market Analysis, Insights and Forecast, 2019-2031
- 9.1. Market Analysis, Insights and Forecast - by Vehicle type
- 9.1.1. Personal watercrafts
- 9.1.2. All-terrain vehicles
- 9.1.3. Heavy weight motorcycles
- 9.1.4. Side by side vehicles
- 9.1.5. Snow mobiles
- 9.2. Market Analysis, Insights and Forecast - by Propulsion
- 9.2.1. Diesel
- 9.2.2. Gasoline
- 9.2.3. Electric
- 9.3. Market Analysis, Insights and Forecast - by Application
- 9.3.1. On-Road
- 9.3.2. Off-Road
- 9.1. Market Analysis, Insights and Forecast - by Vehicle type
- 10. Middle East Powersports Market Analysis, Insights and Forecast, 2019-2031
- 10.1. Market Analysis, Insights and Forecast - by Vehicle type
- 10.1.1. Personal watercrafts
- 10.1.2. All-terrain vehicles
- 10.1.3. Heavy weight motorcycles
- 10.1.4. Side by side vehicles
- 10.1.5. Snow mobiles
- 10.2. Market Analysis, Insights and Forecast - by Propulsion
- 10.2.1. Diesel
- 10.2.2. Gasoline
- 10.2.3. Electric
- 10.3. Market Analysis, Insights and Forecast - by Application
- 10.3.1. On-Road
- 10.3.2. Off-Road
- 10.1. Market Analysis, Insights and Forecast - by Vehicle type
- 11. North America Powersports Market Analysis, Insights and Forecast, 2019-2031
- 11.1. Market Analysis, Insights and Forecast - By Country/Sub-region
- 11.1.1 US
- 11.1.2 Canada
- 11.1.3 Mexico
- 11.1.4 Rest of North America
- 12. Europe Powersports Market Analysis, Insights and Forecast, 2019-2031
- 12.1. Market Analysis, Insights and Forecast - By Country/Sub-region
- 12.1.1 Germany
- 12.1.2 UK
- 12.1.3 France
- 12.1.4 Russia
- 12.1.5 Spain
- 12.1.6 Rest of Europe
- 13. Asia Pacific Powersports Market Analysis, Insights and Forecast, 2019-2031
- 13.1. Market Analysis, Insights and Forecast - By Country/Sub-region
- 13.1.1 India
- 13.1.2 China
- 13.1.3 Japan
- 13.1.4 Rest of Asia Pacific
- 14. South America Powersports Market Analysis, Insights and Forecast, 2019-2031
- 14.1. Market Analysis, Insights and Forecast - By Country/Sub-region
- 14.1.1 Brazil
- 14.1.2 Argentina
- 15. Middle East Powersports Market Analysis, Insights and Forecast, 2019-2031
- 15.1. Market Analysis, Insights and Forecast - By Country/Sub-region
- 15.1.1 UAE
- 15.1.2 Saudi Arabia
- 15.1.3 Rest of Middle East
- 16. Competitive Analysis
- 16.1. Global Market Share Analysis 2024
- 16.2. Company Profiles
- 16.2.1 Arctic Cat Inc
- 16.2.1.1. Overview
- 16.2.1.2. Products
- 16.2.1.3. SWOT Analysis
- 16.2.1.4. Recent Developments
- 16.2.1.5. Financials (Based on Availability)
- 16.2.2 Yamaha Motor Co Ltd
- 16.2.2.1. Overview
- 16.2.2.2. Products
- 16.2.2.3. SWOT Analysis
- 16.2.2.4. Recent Developments
- 16.2.2.5. Financials (Based on Availability)
- 16.2.3 Kawasaki Heavy Industries
- 16.2.3.1. Overview
- 16.2.3.2. Products
- 16.2.3.3. SWOT Analysis
- 16.2.3.4. Recent Developments
- 16.2.3.5. Financials (Based on Availability)
- 16.2.4 Changjiang Motorcycle Co Ltd
- 16.2.4.1. Overview
- 16.2.4.2. Products
- 16.2.4.3. SWOT Analysis
- 16.2.4.4. Recent Developments
- 16.2.4.5. Financials (Based on Availability)
- 16.2.5 KTM AG
- 16.2.5.1. Overview
- 16.2.5.2. Products
- 16.2.5.3. SWOT Analysis
- 16.2.5.4. Recent Developments
- 16.2.5.5. Financials (Based on Availability)
- 16.2.6 Harley-Davidson Inc *List Not Exhaustive
- 16.2.6.1. Overview
- 16.2.6.2. Products
- 16.2.6.3. SWOT Analysis
- 16.2.6.4. Recent Developments
- 16.2.6.5. Financials (Based on Availability)
- 16.2.7 BRP Inc
- 16.2.7.1. Overview
- 16.2.7.2. Products
- 16.2.7.3. SWOT Analysis
- 16.2.7.4. Recent Developments
- 16.2.7.5. Financials (Based on Availability)
- 16.2.8 Honda Motor Co Ltd
- 16.2.8.1. Overview
- 16.2.8.2. Products
- 16.2.8.3. SWOT Analysis
- 16.2.8.4. Recent Developments
- 16.2.8.5. Financials (Based on Availability)
- 16.2.9 Polaris Inc
- 16.2.9.1. Overview
- 16.2.9.2. Products
- 16.2.9.3. SWOT Analysis
- 16.2.9.4. Recent Developments
- 16.2.9.5. Financials (Based on Availability)
- 16.2.10 Suzuki Motor Corporation
- 16.2.10.1. Overview
- 16.2.10.2. Products
- 16.2.10.3. SWOT Analysis
- 16.2.10.4. Recent Developments
- 16.2.10.5. Financials (Based on Availability)
- 16.2.1 Arctic Cat Inc
List of Figures
- Figure 1: Global Powersports Market Revenue Breakdown (Million, %) by Region 2024 & 2032
- Figure 2: North America Powersports Market Revenue (Million), by Country 2024 & 2032
- Figure 3: North America Powersports Market Revenue Share (%), by Country 2024 & 2032
- Figure 4: Europe Powersports Market Revenue (Million), by Country 2024 & 2032
- Figure 5: Europe Powersports Market Revenue Share (%), by Country 2024 & 2032
- Figure 6: Asia Pacific Powersports Market Revenue (Million), by Country 2024 & 2032
- Figure 7: Asia Pacific Powersports Market Revenue Share (%), by Country 2024 & 2032
- Figure 8: South America Powersports Market Revenue (Million), by Country 2024 & 2032
- Figure 9: South America Powersports Market Revenue Share (%), by Country 2024 & 2032
- Figure 10: Middle East Powersports Market Revenue (Million), by Country 2024 & 2032
- Figure 11: Middle East Powersports Market Revenue Share (%), by Country 2024 & 2032
- Figure 12: North America Powersports Market Revenue (Million), by Vehicle type 2024 & 2032
- Figure 13: North America Powersports Market Revenue Share (%), by Vehicle type 2024 & 2032
- Figure 14: North America Powersports Market Revenue (Million), by Propulsion 2024 & 2032
- Figure 15: North America Powersports Market Revenue Share (%), by Propulsion 2024 & 2032
- Figure 16: North America Powersports Market Revenue (Million), by Application 2024 & 2032
- Figure 17: North America Powersports Market Revenue Share (%), by Application 2024 & 2032
- Figure 18: North America Powersports Market Revenue (Million), by Country 2024 & 2032
- Figure 19: North America Powersports Market Revenue Share (%), by Country 2024 & 2032
- Figure 20: Europe Powersports Market Revenue (Million), by Vehicle type 2024 & 2032
- Figure 21: Europe Powersports Market Revenue Share (%), by Vehicle type 2024 & 2032
- Figure 22: Europe Powersports Market Revenue (Million), by Propulsion 2024 & 2032
- Figure 23: Europe Powersports Market Revenue Share (%), by Propulsion 2024 & 2032
- Figure 24: Europe Powersports Market Revenue (Million), by Application 2024 & 2032
- Figure 25: Europe Powersports Market Revenue Share (%), by Application 2024 & 2032
- Figure 26: Europe Powersports Market Revenue (Million), by Country 2024 & 2032
- Figure 27: Europe Powersports Market Revenue Share (%), by Country 2024 & 2032
- Figure 28: Asia Pacific Powersports Market Revenue (Million), by Vehicle type 2024 & 2032
- Figure 29: Asia Pacific Powersports Market Revenue Share (%), by Vehicle type 2024 & 2032
- Figure 30: Asia Pacific Powersports Market Revenue (Million), by Propulsion 2024 & 2032
- Figure 31: Asia Pacific Powersports Market Revenue Share (%), by Propulsion 2024 & 2032
- Figure 32: Asia Pacific Powersports Market Revenue (Million), by Application 2024 & 2032
- Figure 33: Asia Pacific Powersports Market Revenue Share (%), by Application 2024 & 2032
- Figure 34: Asia Pacific Powersports Market Revenue (Million), by Country 2024 & 2032
- Figure 35: Asia Pacific Powersports Market Revenue Share (%), by Country 2024 & 2032
- Figure 36: South America Powersports Market Revenue (Million), by Vehicle type 2024 & 2032
- Figure 37: South America Powersports Market Revenue Share (%), by Vehicle type 2024 & 2032
- Figure 38: South America Powersports Market Revenue (Million), by Propulsion 2024 & 2032
- Figure 39: South America Powersports Market Revenue Share (%), by Propulsion 2024 & 2032
- Figure 40: South America Powersports Market Revenue (Million), by Application 2024 & 2032
- Figure 41: South America Powersports Market Revenue Share (%), by Application 2024 & 2032
- Figure 42: South America Powersports Market Revenue (Million), by Country 2024 & 2032
- Figure 43: South America Powersports Market Revenue Share (%), by Country 2024 & 2032
- Figure 44: Middle East Powersports Market Revenue (Million), by Vehicle type 2024 & 2032
- Figure 45: Middle East Powersports Market Revenue Share (%), by Vehicle type 2024 & 2032
- Figure 46: Middle East Powersports Market Revenue (Million), by Propulsion 2024 & 2032
- Figure 47: Middle East Powersports Market Revenue Share (%), by Propulsion 2024 & 2032
- Figure 48: Middle East Powersports Market Revenue (Million), by Application 2024 & 2032
- Figure 49: Middle East Powersports Market Revenue Share (%), by Application 2024 & 2032
- Figure 50: Middle East Powersports Market Revenue (Million), by Country 2024 & 2032
- Figure 51: Middle East Powersports Market Revenue Share (%), by Country 2024 & 2032
List of Tables
- Table 1: Global Powersports Market Revenue Million Forecast, by Region 2019 & 2032
- Table 2: Global Powersports Market Revenue Million Forecast, by Vehicle type 2019 & 2032
- Table 3: Global Powersports Market Revenue Million Forecast, by Propulsion 2019 & 2032
- Table 4: Global Powersports Market Revenue Million Forecast, by Application 2019 & 2032
- Table 5: Global Powersports Market Revenue Million Forecast, by Region 2019 & 2032
- Table 6: Global Powersports Market Revenue Million Forecast, by Country 2019 & 2032
- Table 7: US Powersports Market Revenue (Million) Forecast, by Application 2019 & 2032
- Table 8: Canada Powersports Market Revenue (Million) Forecast, by Application 2019 & 2032
- Table 9: Mexico Powersports Market Revenue (Million) Forecast, by Application 2019 & 2032
- Table 10: Rest of North America Powersports Market Revenue (Million) Forecast, by Application 2019 & 2032
- Table 11: Global Powersports Market Revenue Million Forecast, by Country 2019 & 2032
- Table 12: Germany Powersports Market Revenue (Million) Forecast, by Application 2019 & 2032
- Table 13: UK Powersports Market Revenue (Million) Forecast, by Application 2019 & 2032
- Table 14: France Powersports Market Revenue (Million) Forecast, by Application 2019 & 2032
- Table 15: Russia Powersports Market Revenue (Million) Forecast, by Application 2019 & 2032
- Table 16: Spain Powersports Market Revenue (Million) Forecast, by Application 2019 & 2032
- Table 17: Rest of Europe Powersports Market Revenue (Million) Forecast, by Application 2019 & 2032
- Table 18: Global Powersports Market Revenue Million Forecast, by Country 2019 & 2032
- Table 19: India Powersports Market Revenue (Million) Forecast, by Application 2019 & 2032
- Table 20: China Powersports Market Revenue (Million) Forecast, by Application 2019 & 2032
- Table 21: Japan Powersports Market Revenue (Million) Forecast, by Application 2019 & 2032
- Table 22: Rest of Asia Pacific Powersports Market Revenue (Million) Forecast, by Application 2019 & 2032
- Table 23: Global Powersports Market Revenue Million Forecast, by Country 2019 & 2032
- Table 24: Brazil Powersports Market Revenue (Million) Forecast, by Application 2019 & 2032
- Table 25: Argentina Powersports Market Revenue (Million) Forecast, by Application 2019 & 2032
- Table 26: Global Powersports Market Revenue Million Forecast, by Country 2019 & 2032
- Table 27: UAE Powersports Market Revenue (Million) Forecast, by Application 2019 & 2032
- Table 28: Saudi Arabia Powersports Market Revenue (Million) Forecast, by Application 2019 & 2032
- Table 29: Rest of Middle East Powersports Market Revenue (Million) Forecast, by Application 2019 & 2032
- Table 30: Global Powersports Market Revenue Million Forecast, by Vehicle type 2019 & 2032
- Table 31: Global Powersports Market Revenue Million Forecast, by Propulsion 2019 & 2032
- Table 32: Global Powersports Market Revenue Million Forecast, by Application 2019 & 2032
- Table 33: Global Powersports Market Revenue Million Forecast, by Country 2019 & 2032
- Table 34: US Powersports Market Revenue (Million) Forecast, by Application 2019 & 2032
- Table 35: Canada Powersports Market Revenue (Million) Forecast, by Application 2019 & 2032
- Table 36: Mexico Powersports Market Revenue (Million) Forecast, by Application 2019 & 2032
- Table 37: Rest of North America Powersports Market Revenue (Million) Forecast, by Application 2019 & 2032
- Table 38: Global Powersports Market Revenue Million Forecast, by Vehicle type 2019 & 2032
- Table 39: Global Powersports Market Revenue Million Forecast, by Propulsion 2019 & 2032
- Table 40: Global Powersports Market Revenue Million Forecast, by Application 2019 & 2032
- Table 41: Global Powersports Market Revenue Million Forecast, by Country 2019 & 2032
- Table 42: Germany Powersports Market Revenue (Million) Forecast, by Application 2019 & 2032
- Table 43: UK Powersports Market Revenue (Million) Forecast, by Application 2019 & 2032
- Table 44: France Powersports Market Revenue (Million) Forecast, by Application 2019 & 2032
- Table 45: Russia Powersports Market Revenue (Million) Forecast, by Application 2019 & 2032
- Table 46: Spain Powersports Market Revenue (Million) Forecast, by Application 2019 & 2032
- Table 47: Rest of Europe Powersports Market Revenue (Million) Forecast, by Application 2019 & 2032
- Table 48: Global Powersports Market Revenue Million Forecast, by Vehicle type 2019 & 2032
- Table 49: Global Powersports Market Revenue Million Forecast, by Propulsion 2019 & 2032
- Table 50: Global Powersports Market Revenue Million Forecast, by Application 2019 & 2032
- Table 51: Global Powersports Market Revenue Million Forecast, by Country 2019 & 2032
- Table 52: India Powersports Market Revenue (Million) Forecast, by Application 2019 & 2032
- Table 53: China Powersports Market Revenue (Million) Forecast, by Application 2019 & 2032
- Table 54: Japan Powersports Market Revenue (Million) Forecast, by Application 2019 & 2032
- Table 55: Rest of Asia Pacific Powersports Market Revenue (Million) Forecast, by Application 2019 & 2032
- Table 56: Global Powersports Market Revenue Million Forecast, by Vehicle type 2019 & 2032
- Table 57: Global Powersports Market Revenue Million Forecast, by Propulsion 2019 & 2032
- Table 58: Global Powersports Market Revenue Million Forecast, by Application 2019 & 2032
- Table 59: Global Powersports Market Revenue Million Forecast, by Country 2019 & 2032
- Table 60: Brazil Powersports Market Revenue (Million) Forecast, by Application 2019 & 2032
- Table 61: Argentina Powersports Market Revenue (Million) Forecast, by Application 2019 & 2032
- Table 62: Global Powersports Market Revenue Million Forecast, by Vehicle type 2019 & 2032
- Table 63: Global Powersports Market Revenue Million Forecast, by Propulsion 2019 & 2032
- Table 64: Global Powersports Market Revenue Million Forecast, by Application 2019 & 2032
- Table 65: Global Powersports Market Revenue Million Forecast, by Country 2019 & 2032
- Table 66: UAE Powersports Market Revenue (Million) Forecast, by Application 2019 & 2032
- Table 67: Saudi Arabia Powersports Market Revenue (Million) Forecast, by Application 2019 & 2032
- Table 68: Rest of Middle East Powersports Market Revenue (Million) Forecast, by Application 2019 & 2032
Frequently Asked Questions
1. What is the projected Compound Annual Growth Rate (CAGR) of the Powersports Market?
The projected CAGR is approximately 6.29%.
2. Which companies are prominent players in the Powersports Market?
Key companies in the market include Arctic Cat Inc, Yamaha Motor Co Ltd, Kawasaki Heavy Industries, Changjiang Motorcycle Co Ltd, KTM AG, Harley-Davidson Inc *List Not Exhaustive, BRP Inc, Honda Motor Co Ltd, Polaris Inc, Suzuki Motor Corporation.
3. What are the main segments of the Powersports Market?
The market segments include Vehicle type, Propulsion, Application.
4. Can you provide details about the market size?
The market size is estimated to be USD 40.33 Million as of 2022.
5. What are some drivers contributing to market growth?
Increasing disposable income and consumer preferences for adventure sports propel the market growth.
6. What are the notable trends driving market growth?
Changing Consumer Preferences due to technological Advancements Drives the Demand in the Market.
7. Are there any restraints impacting market growth?
High initial investment and maintenance costs obstruct the market growth.
8. Can you provide examples of recent developments in the market?
• January 2024: Patrick Industries agreed to acquire a supplier for Powersports Original Equipment Manufacturers (OEMs). The acquisition will expand Patrick Industries' presence in the Powersports market, offering innovative solutions to OEMs and enhancing their product offerings.
9. What pricing options are available for accessing the report?
Pricing options include single-user, multi-user, and enterprise licenses priced at USD 4750, USD 5250, and USD 8750 respectively.
10. Is the market size provided in terms of value or volume?
The market size is provided in terms of value, measured in Million.
11. Are there any specific market keywords associated with the report?
Yes, the market keyword associated with the report is "Powersports Market," which aids in identifying and referencing the specific market segment covered.
12. How do I determine which pricing option suits my needs best?
The pricing options vary based on user requirements and access needs. Individual users may opt for single-user licenses, while businesses requiring broader access may choose multi-user or enterprise licenses for cost-effective access to the report.
13. Are there any additional resources or data provided in the Powersports Market report?
While the report offers comprehensive insights, it's advisable to review the specific contents or supplementary materials provided to ascertain if additional resources or data are available.
14. How can I stay updated on further developments or reports in the Powersports Market?
To stay informed about further developments, trends, and reports in the Powersports Market, consider subscribing to industry newsletters, following relevant companies and organizations, or regularly checking reputable industry news sources and publications.
Methodology
Step 1 - Identification of Relevant Samples Size from Population Database


Step 2 - Approaches for Defining Global Market Size (Value, Volume* & Price*)

Note*: In applicable scenarios
Step 3 - Data Sources
Primary Research
- Web Analytics
- Survey Reports
- Research Institute
- Latest Research Reports
- Opinion Leaders
Secondary Research
- Annual Reports
- White Paper
- Latest Press Release
- Industry Association
- Paid Database
- Investor Presentations

Step 4 - Data Triangulation
Involves using different sources of information in order to increase the validity of a study
These sources are likely to be stakeholders in a program - participants, other researchers, program staff, other community members, and so on.
Then we put all data in single framework & apply various statistical tools to find out the dynamic on the market.
During the analysis stage, feedback from the stakeholder groups would be compared to determine areas of agreement as well as areas of divergence


