

Key Insights
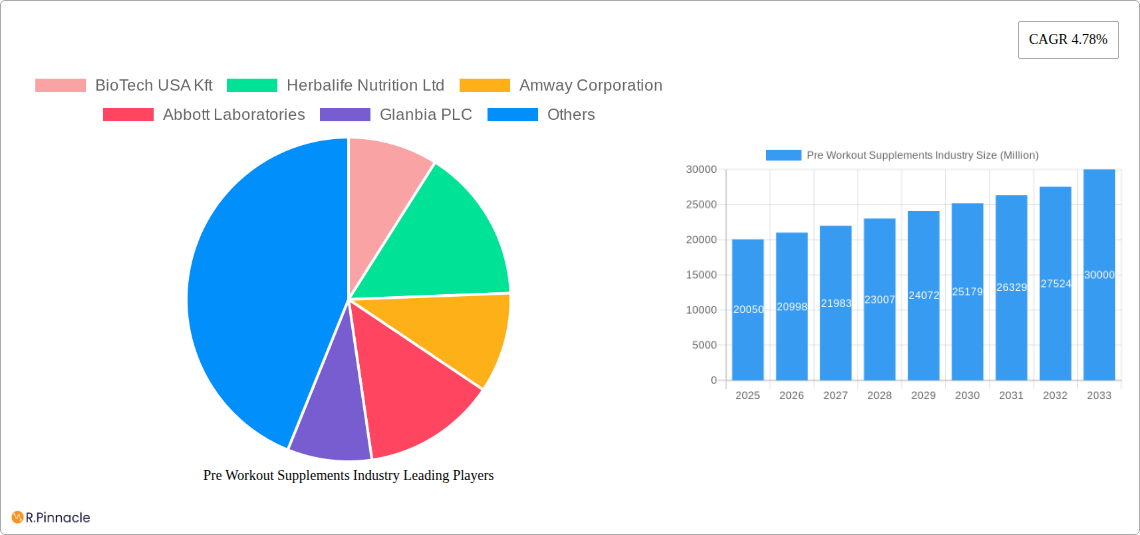
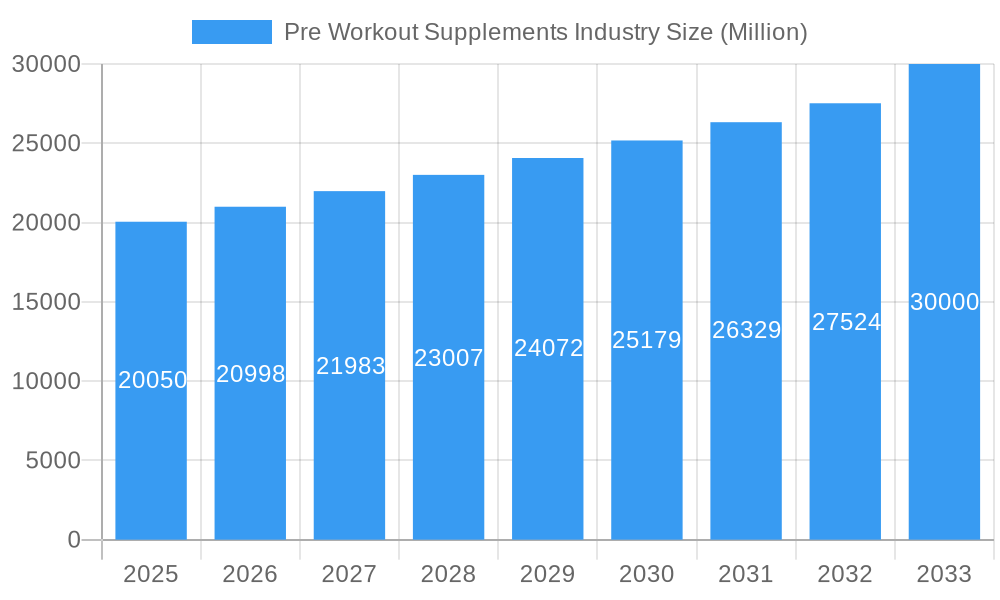
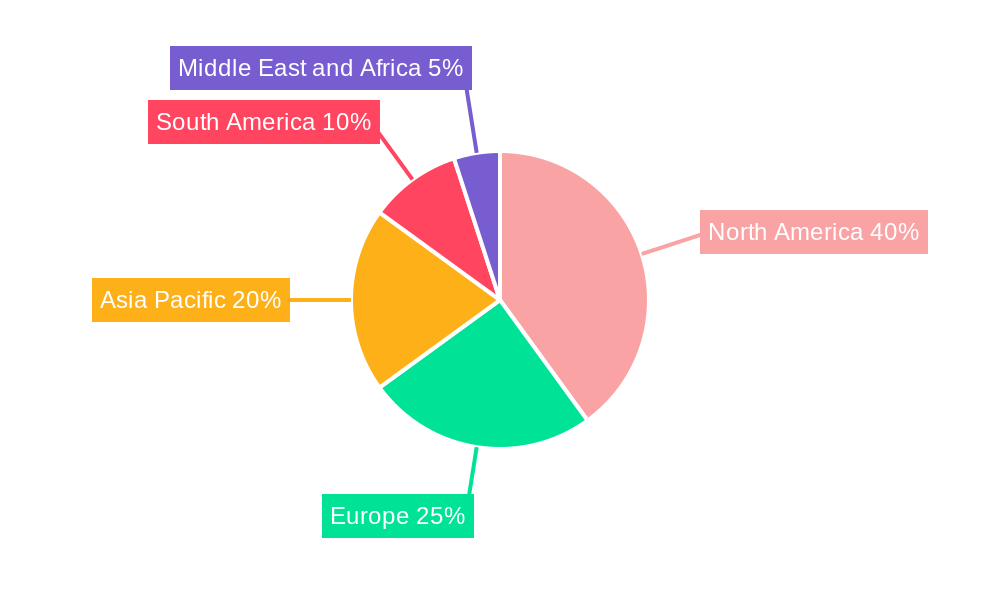
The pre-workout supplement market, valued at $20.05 billion in 2025, is projected to experience robust growth, driven by the increasing popularity of fitness and athletic activities globally. A compound annual growth rate (CAGR) of 4.78% from 2025 to 2033 indicates a significant expansion, reaching an estimated $30 billion by 2033. This growth is fueled by several key factors: the rising awareness of the benefits of pre-workout supplements in enhancing athletic performance, improved formulations incorporating scientifically-backed ingredients like creatine and caffeine, and the expanding reach of online retail channels. Consumer preference is shifting towards convenient formats such as ready-to-drink supplements and capsules/tablets, while powder formulations remain dominant. The North American market currently holds a significant share, driven by high fitness participation rates and strong consumer spending on health and wellness products. However, the Asia-Pacific region is poised for substantial growth due to the increasing adoption of fitness routines and rising disposable incomes. Challenges include stringent regulatory environments and concerns about ingredient safety, requiring manufacturers to prioritize quality control and transparency to maintain consumer trust.
Pre Workout Supplements Industry Market Size (In Billion)
Despite these challenges, the market's future trajectory remains positive. Strategic partnerships between supplement brands and fitness influencers, coupled with innovative product development focusing on personalized nutrition and targeted benefits, will continue to propel market expansion. The increasing availability of pre-workout supplements through various distribution channels, including hypermarkets, specialty stores, and e-commerce platforms, further enhances market accessibility and fuels overall growth. Competition among established players and new entrants is likely to intensify, leading to increased product innovation, competitive pricing strategies, and a broader range of options for consumers. This market demonstrates a dynamic interplay of consumer demand, technological advancements, and evolving regulatory landscapes.
Pre Workout Supplements Industry Company Market Share
Pre Workout Supplements Industry Report: 2019-2033
This comprehensive report provides an in-depth analysis of the global pre workout supplements market, offering invaluable insights for industry professionals, investors, and strategic decision-makers. The study period covers 2019-2033, with 2025 as the base and estimated year, and a forecast period of 2025-2033. The report leverages extensive market research to deliver actionable intelligence and growth projections, surpassing xx Million by 2033.
Pre Workout Supplements Industry Market Structure & Innovation Trends
The pre workout supplements market is characterized by a moderately concentrated structure, with key players like BioTech USA Kft, Herbalife Nutrition Ltd, Amway Corporation, Abbott Laboratories, Glanbia PLC, Nutrex Research Inc, MusclePharm Corporation, QNT SA, Bulk, and Nutrabolt holding significant market share. However, the market also features numerous smaller players and emerging brands, leading to competitive dynamics.
- Market Concentration: The top 5 players collectively hold an estimated xx% market share in 2025, indicating moderate concentration.
- Innovation Drivers: Growing consumer demand for enhanced performance and functional benefits fuels innovation in ingredient formulations, delivery systems, and product formats.
- Regulatory Frameworks: Varying regulations across geographies influence product formulation and labeling requirements, impacting market growth.
- Product Substitutes: Energy drinks and other performance-enhancing products pose a competitive threat.
- End-User Demographics: The primary end-users are fitness enthusiasts, athletes, and individuals seeking improved workout performance. The market is largely driven by millennials and Gen Z.
- M&A Activities: The industry has witnessed several mergers and acquisitions in recent years, with deal values exceeding xx Million in the past five years. These activities aim to expand market reach and enhance product portfolios.
Pre Workout Supplements Industry Market Dynamics & Trends
The global pre workout supplements market is experiencing robust growth, driven by several key factors. The market exhibits a Compound Annual Growth Rate (CAGR) of xx% during the forecast period (2025-2033), surpassing xx Million by 2033. This growth is fueled by several factors. Rising health consciousness and increasing participation in fitness activities are major contributors. Technological advancements lead to the development of innovative products, improved formulations, and enhanced delivery systems. The shift towards personalized nutrition and targeted supplements caters to niche consumer segments. Increasing online retail penetration and growing e-commerce platforms expands the market reach and accessibility of pre workout supplements. However, consumer awareness regarding potential side effects and stringent regulatory frameworks present challenges to market growth. Competitive dynamics, including pricing strategies and marketing campaigns, play a crucial role in shaping market penetration rates. The market penetration rate for pre workout supplements among fitness enthusiasts is expected to reach xx% by 2033.
Dominant Regions & Segments in Pre Workout Supplements Industry
The North American region currently holds the largest market share, followed by Europe and Asia-Pacific. Within product types, powders dominate the market due to their versatility and cost-effectiveness. Online retail channels are experiencing rapid growth, driven by the increasing preference for convenient purchasing options.
- Key Drivers for North American Dominance: High fitness participation rates, robust e-commerce infrastructure, and strong consumer awareness of pre-workout benefits.
- Key Drivers for Online Retail Growth: Convenience, wide selection, and competitive pricing.
- Other segments: Capsule/Tablet segment is steadily growing, catering to consumers who prefer a more convenient format. Drinks and other types of pre-workout supplements (e.g., gels, chews) represent niche segments catering to particular consumer needs. Hypermarkets and specialty stores continue to play a significant role in distribution, although online retail is increasingly capturing market share.
Pre Workout Supplements Industry Product Innovations
Recent innovations focus on enhanced ingredient formulations, including clinically-proven ingredients, improved absorption rates, and tailored blends for specific fitness goals. Technological advancements in micronization and encapsulation technologies contribute to improved bioavailability and efficacy. The integration of smart technologies, such as sensors and connected fitness apps, will be significant future trends in this market. These innovations improve consumer experience and create better market fit.
Report Scope & Segmentation Analysis
The report offers a comprehensive segmentation analysis, examining the market across different product types (Powder, Capsule/Tablet, Drinks, Other Types) and distribution channels (Hypermarket/Supermarket, Specialty Stores, Online Retail Stores, Other Distribution Channels). Each segment's growth trajectory, market size, and competitive landscape are analyzed, providing detailed insights into market dynamics. The growth projection varies significantly across segments, with powders and online channels exhibiting the highest growth rates. Competitive intensity differs across segments, with some being more fragmented than others.
Key Drivers of Pre Workout Supplements Industry Growth
Several factors drive the growth of the pre workout supplements market. The increasing prevalence of health consciousness and lifestyle changes among consumers fuel demand for fitness-enhancing products. Technological advancements enable the development of superior product formulations and delivery systems. Growing adoption of online retail channels increases the accessibility and convenience of purchase. The increasing participation in fitness activities and sports further supports market expansion. Favorable regulatory frameworks, especially in certain regions, facilitate market growth.
Challenges in the Pre Workout Supplements Industry Sector
The pre workout supplements industry faces several challenges. Stringent regulatory requirements regarding ingredient safety and labeling add costs and complexity to product development and market entry. Supply chain disruptions and fluctuating raw material prices can impact production and profitability. Increasing competition and brand proliferation necessitate strategic differentiation and marketing strategies. The perception of potential side effects and safety concerns may limit consumer adoption.
Emerging Opportunities in Pre Workout Supplements Industry
Several emerging opportunities are shaping the future of the pre workout supplements industry. The growing focus on personalized nutrition and functional fitness offers opportunities to develop tailored products catering to specific consumer needs and preferences. The incorporation of advanced technologies, such as AI-powered health tracking and personalized recommendations, enhances consumer experience. The expansion into emerging markets presents substantial growth potential.
Leading Players in the Pre Workout Supplements Industry Market
- BioTech USA Kft
- Herbalife Nutrition Ltd
- Amway Corporation
- Abbott Laboratories
- Glanbia PLC
- Nutrex Research Inc
- MusclePharm Corporation
- QNT SA
- Bulk
- Nutrabolt
Key Developments in Pre Workout Supplements Industry
- 2022 Q4: Nutrabolt launched a new line of pre-workout supplements with improved formulations.
- 2023 Q1: BioTech USA Kft acquired a smaller competitor, expanding its market share.
- 2023 Q3: Several key players introduced sustainable packaging solutions, aligning with growing consumer demand for eco-friendly products. (Further developments to be added as they occur).
Future Outlook for Pre Workout Supplements Industry Market
The pre workout supplements market is poised for continued growth, driven by factors like increasing health consciousness, technological advancements, and expanding consumer base. Strategic opportunities exist in personalized nutrition, product innovation, and effective marketing strategies. The market's future growth depends on addressing the challenges posed by regulations, competition, and consumer perception. Further innovation and strategic positioning will be crucial for success in the years to come.
Pre Workout Supplements Industry Segmentation
-
1. Type
- 1.1. Powder
- 1.2. Capsule/ Tablet
- 1.3. Drinks
- 1.4. Other Types
-
2. Distribution Channel
- 2.1. Hypermarket/Supermarket
- 2.2. Specialty Stores
- 2.3. Online Retail Stores
- 2.4. Other Distribution Channels
Pre Workout Supplements Industry Segmentation By Geography
-
1. North America
- 1.1. United States
- 1.2. Canada
- 1.3. Mexico
- 1.4. Rest of North America
-
2. Europe
- 2.1. Spain
- 2.2. United Kingdom
- 2.3. Germany
- 2.4. France
- 2.5. Italy
- 2.6. Russia
- 2.7. Rest of Europe
-
3. Asia Pacific
- 3.1. China
- 3.2. Japan
- 3.3. India
- 3.4. Australia
- 3.5. Rest of Asia Pacific
-
4. South America
- 4.1. Brazil
- 4.2. Argentina
- 4.3. Rest of South America
-
5. Middle East and Africa
- 5.1. United Arab Emirates
- 5.2. South Africa
- 5.3. Rest of Middle East and Africa
Pre Workout Supplements Industry Regional Market Share
Geographic Coverage of Pre Workout Supplements Industry
Pre Workout Supplements Industry REPORT HIGHLIGHTS
| Aspects | Details |
|---|---|
| Study Period | 2020-2034 |
| Base Year | 2025 |
| Estimated Year | 2026 |
| Forecast Period | 2026-2034 |
| Historical Period | 2020-2025 |
| Growth Rate | CAGR of 4.78% from 2020-2034 |
| Segmentation |
|
Table of Contents
- 1. Introduction
- 1.1. Research Scope
- 1.2. Market Segmentation
- 1.3. Research Objective
- 1.4. Definitions and Assumptions
- 2. Executive Summary
- 2.1. Market Snapshot
- 3. Market Dynamics
- 3.1. Market Drivers
- 3.2. Market Restrains
- 3.3. Market Trends
- 3.4. Market Opportunities
- 4. Market Factor Analysis
- 4.1. Porters Five Forces
- 4.1.1. Bargaining Power of Suppliers
- 4.1.2. Bargaining Power of Buyers
- 4.1.3. Threat of New Entrants
- 4.1.4. Threat of Substitutes
- 4.1.5. Competitive Rivalry
- 4.2. PESTEL analysis
- 4.3. BCG Analysis
- 4.3.1. Stars (High Growth, High Market Share)
- 4.3.2. Cash Cows (Low Growth, High Market Share)
- 4.3.3. Question Mark (High Growth, Low Market Share)
- 4.3.4. Dogs (Low Growth, Low Market Share)
- 4.4. Ansoff Matrix Analysis
- 4.5. Supply Chain Analysis
- 4.6. Regulatory Landscape
- 4.7. Current Market Potential and Opportunity Assessment (TAM–SAM–SOM Framework)
- 4.8. PRI Analyst Note
- 4.1. Porters Five Forces
- 5. Market Analysis, Insights and Forecast 2021-2033
- 5.1. Market Analysis, Insights and Forecast - by Type
- 5.1.1. Powder
- 5.1.2. Capsule/ Tablet
- 5.1.3. Drinks
- 5.1.4. Other Types
- 5.2. Market Analysis, Insights and Forecast - by Distribution Channel
- 5.2.1. Hypermarket/Supermarket
- 5.2.2. Specialty Stores
- 5.2.3. Online Retail Stores
- 5.2.4. Other Distribution Channels
- 5.3. Market Analysis, Insights and Forecast - by Region
- 5.3.1. North America
- 5.3.2. Europe
- 5.3.3. Asia Pacific
- 5.3.4. South America
- 5.3.5. Middle East and Africa
- 5.1. Market Analysis, Insights and Forecast - by Type
- 6. Global Pre Workout Supplements Industry Analysis, Insights and Forecast, 2021-2033
- 6.1. Market Analysis, Insights and Forecast - by Type
- 6.1.1. Powder
- 6.1.2. Capsule/ Tablet
- 6.1.3. Drinks
- 6.1.4. Other Types
- 6.2. Market Analysis, Insights and Forecast - by Distribution Channel
- 6.2.1. Hypermarket/Supermarket
- 6.2.2. Specialty Stores
- 6.2.3. Online Retail Stores
- 6.2.4. Other Distribution Channels
- 6.1. Market Analysis, Insights and Forecast - by Type
- 7. North America Pre Workout Supplements Industry Analysis, Insights and Forecast, 2020-2032
- 7.1. Market Analysis, Insights and Forecast - by Type
- 7.1.1. Powder
- 7.1.2. Capsule/ Tablet
- 7.1.3. Drinks
- 7.1.4. Other Types
- 7.2. Market Analysis, Insights and Forecast - by Distribution Channel
- 7.2.1. Hypermarket/Supermarket
- 7.2.2. Specialty Stores
- 7.2.3. Online Retail Stores
- 7.2.4. Other Distribution Channels
- 7.1. Market Analysis, Insights and Forecast - by Type
- 8. Europe Pre Workout Supplements Industry Analysis, Insights and Forecast, 2020-2032
- 8.1. Market Analysis, Insights and Forecast - by Type
- 8.1.1. Powder
- 8.1.2. Capsule/ Tablet
- 8.1.3. Drinks
- 8.1.4. Other Types
- 8.2. Market Analysis, Insights and Forecast - by Distribution Channel
- 8.2.1. Hypermarket/Supermarket
- 8.2.2. Specialty Stores
- 8.2.3. Online Retail Stores
- 8.2.4. Other Distribution Channels
- 8.1. Market Analysis, Insights and Forecast - by Type
- 9. Asia Pacific Pre Workout Supplements Industry Analysis, Insights and Forecast, 2020-2032
- 9.1. Market Analysis, Insights and Forecast - by Type
- 9.1.1. Powder
- 9.1.2. Capsule/ Tablet
- 9.1.3. Drinks
- 9.1.4. Other Types
- 9.2. Market Analysis, Insights and Forecast - by Distribution Channel
- 9.2.1. Hypermarket/Supermarket
- 9.2.2. Specialty Stores
- 9.2.3. Online Retail Stores
- 9.2.4. Other Distribution Channels
- 9.1. Market Analysis, Insights and Forecast - by Type
- 10. South America Pre Workout Supplements Industry Analysis, Insights and Forecast, 2020-2032
- 10.1. Market Analysis, Insights and Forecast - by Type
- 10.1.1. Powder
- 10.1.2. Capsule/ Tablet
- 10.1.3. Drinks
- 10.1.4. Other Types
- 10.2. Market Analysis, Insights and Forecast - by Distribution Channel
- 10.2.1. Hypermarket/Supermarket
- 10.2.2. Specialty Stores
- 10.2.3. Online Retail Stores
- 10.2.4. Other Distribution Channels
- 10.1. Market Analysis, Insights and Forecast - by Type
- 11. Middle East and Africa Pre Workout Supplements Industry Analysis, Insights and Forecast, 2020-2032
- 11.1. Market Analysis, Insights and Forecast - by Type
- 11.1.1. Powder
- 11.1.2. Capsule/ Tablet
- 11.1.3. Drinks
- 11.1.4. Other Types
- 11.2. Market Analysis, Insights and Forecast - by Distribution Channel
- 11.2.1. Hypermarket/Supermarket
- 11.2.2. Specialty Stores
- 11.2.3. Online Retail Stores
- 11.2.4. Other Distribution Channels
- 11.1. Market Analysis, Insights and Forecast - by Type
- 12. Competitive Analysis
- 12.1. Company Profiles
- 12.1.1 BioTech USA Kft
- 12.1.1.1. Company Overview
- 12.1.1.2. Products
- 12.1.1.3. Company Financials
- 12.1.1.4. SWOT Analysis
- 12.1.2 Herbalife Nutrition Ltd
- 12.1.2.1. Company Overview
- 12.1.2.2. Products
- 12.1.2.3. Company Financials
- 12.1.2.4. SWOT Analysis
- 12.1.3 Amway Corporation
- 12.1.3.1. Company Overview
- 12.1.3.2. Products
- 12.1.3.3. Company Financials
- 12.1.3.4. SWOT Analysis
- 12.1.4 Abbott Laboratories
- 12.1.4.1. Company Overview
- 12.1.4.2. Products
- 12.1.4.3. Company Financials
- 12.1.4.4. SWOT Analysis
- 12.1.5 Glanbia PLC
- 12.1.5.1. Company Overview
- 12.1.5.2. Products
- 12.1.5.3. Company Financials
- 12.1.5.4. SWOT Analysis
- 12.1.6 Nutrex Research Inc *List Not Exhaustive
- 12.1.6.1. Company Overview
- 12.1.6.2. Products
- 12.1.6.3. Company Financials
- 12.1.6.4. SWOT Analysis
- 12.1.7 MusclePharm Corporation
- 12.1.7.1. Company Overview
- 12.1.7.2. Products
- 12.1.7.3. Company Financials
- 12.1.7.4. SWOT Analysis
- 12.1.8 QNT SA
- 12.1.8.1. Company Overview
- 12.1.8.2. Products
- 12.1.8.3. Company Financials
- 12.1.8.4. SWOT Analysis
- 12.1.9 Bulk
- 12.1.9.1. Company Overview
- 12.1.9.2. Products
- 12.1.9.3. Company Financials
- 12.1.9.4. SWOT Analysis
- 12.1.10 Nutrabolt
- 12.1.10.1. Company Overview
- 12.1.10.2. Products
- 12.1.10.3. Company Financials
- 12.1.10.4. SWOT Analysis
- 12.1.1 BioTech USA Kft
- 12.2. Market Entropy
- 12.2.1 Company's Key Areas Served
- 12.2.2 Recent Developments
- 12.3. Company Market Share Analysis 2025
- 12.3.1 Top 5 Companies Market Share Analysis
- 12.3.2 Top 3 Companies Market Share Analysis
- 12.4. List of Potential Customers
- 13. Research Methodology
List of Figures
- Figure 1: Global Pre Workout Supplements Industry Revenue Breakdown (Million, %) by Region 2025 & 2033
- Figure 2: North America Pre Workout Supplements Industry Revenue (Million), by Type 2025 & 2033
- Figure 3: North America Pre Workout Supplements Industry Revenue Share (%), by Type 2025 & 2033
- Figure 4: North America Pre Workout Supplements Industry Revenue (Million), by Distribution Channel 2025 & 2033
- Figure 5: North America Pre Workout Supplements Industry Revenue Share (%), by Distribution Channel 2025 & 2033
- Figure 6: North America Pre Workout Supplements Industry Revenue (Million), by Country 2025 & 2033
- Figure 7: North America Pre Workout Supplements Industry Revenue Share (%), by Country 2025 & 2033
- Figure 8: Europe Pre Workout Supplements Industry Revenue (Million), by Type 2025 & 2033
- Figure 9: Europe Pre Workout Supplements Industry Revenue Share (%), by Type 2025 & 2033
- Figure 10: Europe Pre Workout Supplements Industry Revenue (Million), by Distribution Channel 2025 & 2033
- Figure 11: Europe Pre Workout Supplements Industry Revenue Share (%), by Distribution Channel 2025 & 2033
- Figure 12: Europe Pre Workout Supplements Industry Revenue (Million), by Country 2025 & 2033
- Figure 13: Europe Pre Workout Supplements Industry Revenue Share (%), by Country 2025 & 2033
- Figure 14: Asia Pacific Pre Workout Supplements Industry Revenue (Million), by Type 2025 & 2033
- Figure 15: Asia Pacific Pre Workout Supplements Industry Revenue Share (%), by Type 2025 & 2033
- Figure 16: Asia Pacific Pre Workout Supplements Industry Revenue (Million), by Distribution Channel 2025 & 2033
- Figure 17: Asia Pacific Pre Workout Supplements Industry Revenue Share (%), by Distribution Channel 2025 & 2033
- Figure 18: Asia Pacific Pre Workout Supplements Industry Revenue (Million), by Country 2025 & 2033
- Figure 19: Asia Pacific Pre Workout Supplements Industry Revenue Share (%), by Country 2025 & 2033
- Figure 20: South America Pre Workout Supplements Industry Revenue (Million), by Type 2025 & 2033
- Figure 21: South America Pre Workout Supplements Industry Revenue Share (%), by Type 2025 & 2033
- Figure 22: South America Pre Workout Supplements Industry Revenue (Million), by Distribution Channel 2025 & 2033
- Figure 23: South America Pre Workout Supplements Industry Revenue Share (%), by Distribution Channel 2025 & 2033
- Figure 24: South America Pre Workout Supplements Industry Revenue (Million), by Country 2025 & 2033
- Figure 25: South America Pre Workout Supplements Industry Revenue Share (%), by Country 2025 & 2033
- Figure 26: Middle East and Africa Pre Workout Supplements Industry Revenue (Million), by Type 2025 & 2033
- Figure 27: Middle East and Africa Pre Workout Supplements Industry Revenue Share (%), by Type 2025 & 2033
- Figure 28: Middle East and Africa Pre Workout Supplements Industry Revenue (Million), by Distribution Channel 2025 & 2033
- Figure 29: Middle East and Africa Pre Workout Supplements Industry Revenue Share (%), by Distribution Channel 2025 & 2033
- Figure 30: Middle East and Africa Pre Workout Supplements Industry Revenue (Million), by Country 2025 & 2033
- Figure 31: Middle East and Africa Pre Workout Supplements Industry Revenue Share (%), by Country 2025 & 2033
List of Tables
- Table 1: Global Pre Workout Supplements Industry Revenue Million Forecast, by Type 2020 & 2033
- Table 2: Global Pre Workout Supplements Industry Revenue Million Forecast, by Distribution Channel 2020 & 2033
- Table 3: Global Pre Workout Supplements Industry Revenue Million Forecast, by Region 2020 & 2033
- Table 4: Global Pre Workout Supplements Industry Revenue Million Forecast, by Type 2020 & 2033
- Table 5: Global Pre Workout Supplements Industry Revenue Million Forecast, by Distribution Channel 2020 & 2033
- Table 6: Global Pre Workout Supplements Industry Revenue Million Forecast, by Country 2020 & 2033
- Table 7: United States Pre Workout Supplements Industry Revenue (Million) Forecast, by Application 2020 & 2033
- Table 8: Canada Pre Workout Supplements Industry Revenue (Million) Forecast, by Application 2020 & 2033
- Table 9: Mexico Pre Workout Supplements Industry Revenue (Million) Forecast, by Application 2020 & 2033
- Table 10: Rest of North America Pre Workout Supplements Industry Revenue (Million) Forecast, by Application 2020 & 2033
- Table 11: Global Pre Workout Supplements Industry Revenue Million Forecast, by Type 2020 & 2033
- Table 12: Global Pre Workout Supplements Industry Revenue Million Forecast, by Distribution Channel 2020 & 2033
- Table 13: Global Pre Workout Supplements Industry Revenue Million Forecast, by Country 2020 & 2033
- Table 14: Spain Pre Workout Supplements Industry Revenue (Million) Forecast, by Application 2020 & 2033
- Table 15: United Kingdom Pre Workout Supplements Industry Revenue (Million) Forecast, by Application 2020 & 2033
- Table 16: Germany Pre Workout Supplements Industry Revenue (Million) Forecast, by Application 2020 & 2033
- Table 17: France Pre Workout Supplements Industry Revenue (Million) Forecast, by Application 2020 & 2033
- Table 18: Italy Pre Workout Supplements Industry Revenue (Million) Forecast, by Application 2020 & 2033
- Table 19: Russia Pre Workout Supplements Industry Revenue (Million) Forecast, by Application 2020 & 2033
- Table 20: Rest of Europe Pre Workout Supplements Industry Revenue (Million) Forecast, by Application 2020 & 2033
- Table 21: Global Pre Workout Supplements Industry Revenue Million Forecast, by Type 2020 & 2033
- Table 22: Global Pre Workout Supplements Industry Revenue Million Forecast, by Distribution Channel 2020 & 2033
- Table 23: Global Pre Workout Supplements Industry Revenue Million Forecast, by Country 2020 & 2033
- Table 24: China Pre Workout Supplements Industry Revenue (Million) Forecast, by Application 2020 & 2033
- Table 25: Japan Pre Workout Supplements Industry Revenue (Million) Forecast, by Application 2020 & 2033
- Table 26: India Pre Workout Supplements Industry Revenue (Million) Forecast, by Application 2020 & 2033
- Table 27: Australia Pre Workout Supplements Industry Revenue (Million) Forecast, by Application 2020 & 2033
- Table 28: Rest of Asia Pacific Pre Workout Supplements Industry Revenue (Million) Forecast, by Application 2020 & 2033
- Table 29: Global Pre Workout Supplements Industry Revenue Million Forecast, by Type 2020 & 2033
- Table 30: Global Pre Workout Supplements Industry Revenue Million Forecast, by Distribution Channel 2020 & 2033
- Table 31: Global Pre Workout Supplements Industry Revenue Million Forecast, by Country 2020 & 2033
- Table 32: Brazil Pre Workout Supplements Industry Revenue (Million) Forecast, by Application 2020 & 2033
- Table 33: Argentina Pre Workout Supplements Industry Revenue (Million) Forecast, by Application 2020 & 2033
- Table 34: Rest of South America Pre Workout Supplements Industry Revenue (Million) Forecast, by Application 2020 & 2033
- Table 35: Global Pre Workout Supplements Industry Revenue Million Forecast, by Type 2020 & 2033
- Table 36: Global Pre Workout Supplements Industry Revenue Million Forecast, by Distribution Channel 2020 & 2033
- Table 37: Global Pre Workout Supplements Industry Revenue Million Forecast, by Country 2020 & 2033
- Table 38: United Arab Emirates Pre Workout Supplements Industry Revenue (Million) Forecast, by Application 2020 & 2033
- Table 39: South Africa Pre Workout Supplements Industry Revenue (Million) Forecast, by Application 2020 & 2033
- Table 40: Rest of Middle East and Africa Pre Workout Supplements Industry Revenue (Million) Forecast, by Application 2020 & 2033
Frequently Asked Questions
1. What is the projected Compound Annual Growth Rate (CAGR) of the Pre Workout Supplements Industry?
The projected CAGR is approximately 4.78%.
2. Which companies are prominent players in the Pre Workout Supplements Industry?
Key companies in the market include BioTech USA Kft, Herbalife Nutrition Ltd, Amway Corporation, Abbott Laboratories, Glanbia PLC, Nutrex Research Inc *List Not Exhaustive, MusclePharm Corporation, QNT SA, Bulk, Nutrabolt.
3. What are the main segments of the Pre Workout Supplements Industry?
The market segments include Type, Distribution Channel.
4. Can you provide details about the market size?
The market size is estimated to be USD 20.05 Million as of 2022.
5. What are some drivers contributing to market growth?
Increasing Trend of Consuming Cocktails; Rising Demand for Premium Spirits.
6. What are the notable trends driving market growth?
Growing Influence of Healthy Lifestyle Trends and Rising Number of Non-Traditional Users.
7. Are there any restraints impacting market growth?
Affordability of the Product is Restraining the Market's Growth.
8. Can you provide examples of recent developments in the market?
N/A
9. What pricing options are available for accessing the report?
Pricing options include single-user, multi-user, and enterprise licenses priced at USD 4750, USD 5250, and USD 8750 respectively.
10. Is the market size provided in terms of value or volume?
The market size is provided in terms of value, measured in Million.
11. Are there any specific market keywords associated with the report?
Yes, the market keyword associated with the report is "Pre Workout Supplements Industry," which aids in identifying and referencing the specific market segment covered.
12. How do I determine which pricing option suits my needs best?
The pricing options vary based on user requirements and access needs. Individual users may opt for single-user licenses, while businesses requiring broader access may choose multi-user or enterprise licenses for cost-effective access to the report.
13. Are there any additional resources or data provided in the Pre Workout Supplements Industry report?
While the report offers comprehensive insights, it's advisable to review the specific contents or supplementary materials provided to ascertain if additional resources or data are available.
14. How can I stay updated on further developments or reports in the Pre Workout Supplements Industry?
To stay informed about further developments, trends, and reports in the Pre Workout Supplements Industry, consider subscribing to industry newsletters, following relevant companies and organizations, or regularly checking reputable industry news sources and publications.
Methodology
Step 1 - Identification of Relevant Samples Size from Population Database


Step 2 - Approaches for Defining Global Market Size (Value, Volume* & Price*)

Note*: In applicable scenarios
Step 3 - Data Sources
Primary Research
- Web Analytics
- Survey Reports
- Research Institute
- Latest Research Reports
- Opinion Leaders
Secondary Research
- Annual Reports
- White Paper
- Latest Press Release
- Industry Association
- Paid Database
- Investor Presentations

Step 4 - Data Triangulation
Involves using different sources of information in order to increase the validity of a study
These sources are likely to be stakeholders in a program - participants, other researchers, program staff, other community members, and so on.
Then we put all data in single framework & apply various statistical tools to find out the dynamic on the market.
During the analysis stage, feedback from the stakeholder groups would be compared to determine areas of agreement as well as areas of divergence