

Key Insights
The global market for preloaded injectable intraocular lenses (IOLs) is experiencing robust growth, driven by an aging population, increasing prevalence of cataracts and refractive errors, and advancements in surgical techniques. The market's expansion is fueled by the advantages offered by preloaded IOLs, such as simplified surgical procedures, reduced operative time, and improved patient outcomes. These lenses offer surgeons enhanced precision and efficiency, contributing to higher surgical success rates and faster patient recovery times. While the precise market size in 2025 requires further data, considering a conservative estimate based on reported CAGRs and market trends, the market is likely valued at several hundred million dollars globally, representing significant revenue generation for key players such as NIDEK, Bausch + Lomb, Johnson & Johnson, Alcon, and others. Competition is intensifying with the emergence of innovative products and technological advancements. This competition fosters innovation and drives the market towards more sophisticated and patient-friendly solutions.
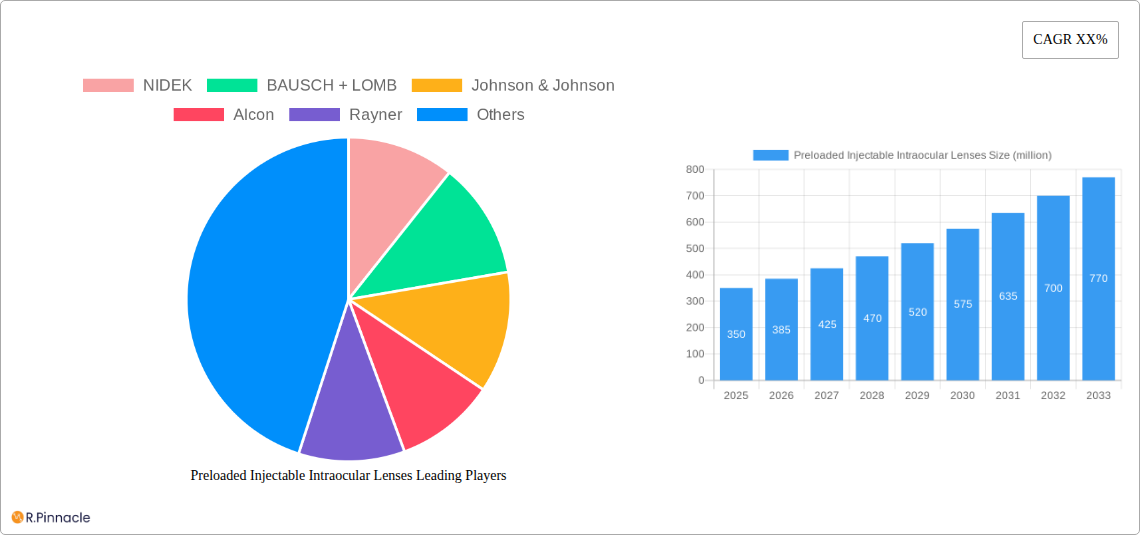
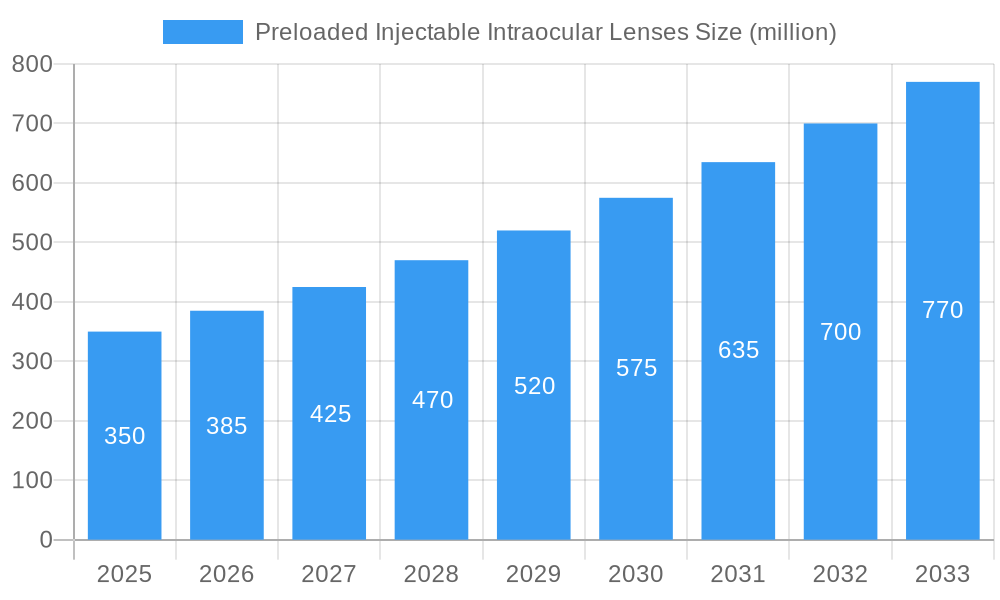
Preloaded Injectable Intraocular Lenses Market Size (In Million)
The forecast period (2025-2033) anticipates continued growth, propelled by increasing adoption in emerging markets, expanding awareness of preloaded IOL technology among ophthalmologists, and ongoing research & development initiatives focused on improving lens designs and materials. However, certain factors may restrain market expansion, including the relatively high cost of the procedure, potential complications associated with injectable IOLs, and variations in regulatory approvals across different geographical regions. Despite these challenges, the long-term outlook for preloaded injectable IOLs remains positive, with significant potential for continued market penetration and value expansion over the next decade. Strategic partnerships, technological collaborations, and focused marketing efforts will likely play a crucial role in shaping the competitive landscape and accelerating market growth during this period.
Preloaded Injectable Intraocular Lenses Company Market Share
Preloaded Injectable Intraocular Lenses Market Report: 2019-2033
This comprehensive report provides an in-depth analysis of the global preloaded injectable intraocular lenses (IOLs) market, offering invaluable insights for industry professionals, investors, and strategic decision-makers. Covering the period from 2019 to 2033, with a focus on 2025, this report meticulously examines market dynamics, competitive landscapes, technological advancements, and future growth prospects. The study period is 2019-2033, with 2025 as the base and estimated year, and 2025-2033 as the forecast period. The historical period covered is 2019-2024. The report projects a market valued in the millions, offering granular data and actionable intelligence.
Preloaded Injectable Intraocular Lenses Market Structure & Innovation Trends
This section analyzes the competitive landscape of the preloaded injectable IOL market, examining market concentration, key innovation drivers, regulatory frameworks, and industry dynamics. The report details M&A activities, including deal values (in millions of USD), and provides a comprehensive assessment of market share distribution among leading players.
- Market Concentration: The market exhibits a [level of concentration - e.g., moderately concentrated] structure, with the top five players holding approximately xx% of the market share in 2025.
- Innovation Drivers: Key drivers include advancements in material science (e.g., foldable IOL designs), improved surgical techniques, and a growing demand for minimally invasive procedures.
- Regulatory Frameworks: Stringent regulatory approvals and compliance requirements significantly impact market entry and product lifecycles. Variations in regulatory landscapes across different regions influence market penetration rates.
- Product Substitutes: The primary substitutes for preloaded injectable IOLs are conventional IOLs; however, the advantages of injectables in terms of reduced surgical trauma drive market growth.
- End-User Demographics: The aging global population and the rising prevalence of cataracts and other age-related eye conditions are major contributing factors to market expansion.
- M&A Activities: The past five years have witnessed [Number] significant M&A deals, with a total value exceeding xx million USD. These transactions primarily focused on [mention specific reasons e.g., expanding product portfolios and geographical reach]. Examples include [mention a few examples if available with deal value in millions].
Preloaded Injectable Intraocular Lenses Market Dynamics & Trends
This section explores the key growth drivers, technological disruptions, and competitive dynamics shaping the preloaded injectable IOL market. The report analyzes market growth projections, providing a detailed assessment of the Compound Annual Growth Rate (CAGR) and market penetration rates during the forecast period (2025-2033). The analysis incorporates consumer preferences, technological innovations, and competitive strategies employed by market leaders. The estimated market size in 2025 is xx million USD, projected to reach xx million USD by 2033, exhibiting a CAGR of xx%.
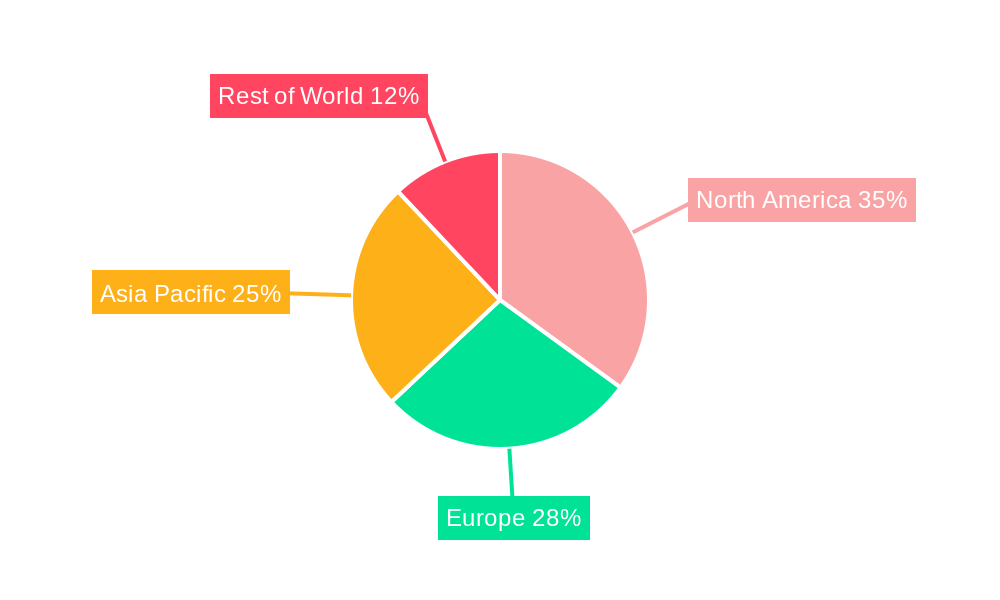
Dominant Regions & Segments in Preloaded Injectable Intraocular Lenses
This section identifies the leading geographical regions and market segments within the preloaded injectable IOL market. The analysis incorporates factors driving regional dominance, including economic policies, healthcare infrastructure, and prevalence of target conditions.
- Leading Region: [Region Name] is projected to dominate the market during the forecast period due to [reasons - e.g., high cataract prevalence, robust healthcare infrastructure, favorable regulatory environment].
- Key Drivers in Leading Region:
- High prevalence of age-related eye diseases.
- Increasing healthcare expenditure.
- Government initiatives promoting eye care access.
- Strong presence of key market players.
- Dominant Segment: [Segment Name] is expected to witness significant growth due to [reasons].
Preloaded Injectable Intraocular Lenses Product Innovations
This section summarizes the latest product developments, focusing on technological trends, competitive advantages, and market fit. The analysis highlights key innovations driving market growth and shaping the future of preloaded injectable IOL technology. Recent advancements include improved biocompatibility, enhanced lens designs for better visual outcomes, and the integration of advanced materials to minimize post-operative complications.
Report Scope & Segmentation Analysis
This report provides a comprehensive segmentation analysis of the preloaded injectable IOL market, covering various segments based on [mention all segment types -e.g., product type, material, application, end-user]. Each segment's growth projections, market size, and competitive dynamics are analyzed in detail. For example, the [Segment Name] segment is projected to experience a [growth rate]% CAGR during the forecast period driven by [reasons], while the [Segment Name] segment will reach xx million USD in value by 2033.
Key Drivers of Preloaded Injectable Intraocular Lenses Growth
Several factors contribute to the growth of the preloaded injectable IOL market. These include the rising prevalence of cataracts, technological advancements leading to improved surgical outcomes and patient satisfaction, and increasing investments in ophthalmic infrastructure, especially in developing economies. Government initiatives promoting eye care access and reimbursement policies also play a significant role in market expansion.
Challenges in the Preloaded Injectable Intraocular Lenses Sector
The preloaded injectable IOL market faces challenges, including stringent regulatory requirements, high manufacturing costs, and the need for skilled ophthalmologists for successful implantation. Supply chain disruptions and intense competition among existing players further influence market growth. The potential impact of these challenges is estimated to cause a [percentage]% reduction in the overall market growth during the forecast period.
Emerging Opportunities in Preloaded Injectable Intraocular Lenses
Emerging opportunities exist in developing economies with rising cataract prevalence, the development of advanced IOL materials, and the integration of smart technologies for personalized vision correction. The exploration of new therapeutic applications for preloaded injectable IOLs and expansion into untapped geographical regions represent significant potential growth areas.
Leading Players in the Preloaded Injectable Intraocular Lenses Market
- NIDEK
- BAUSCH + LOMB
- Johnson & Johnson
- Alcon
- Rayner
- Zeiss
- Medicel
- STAAR SURGICAL
- Hoya Surgical Optics
- Zaraccom
- Adelberg Medical
- AST Products
- Eyebright Medical Technology
- Henan Universe Intraocular Lens
- Wuxi Vision Pro
Key Developments in Preloaded Injectable Intraocular Lenses Industry
- [Month, Year]: [Company Name] launched a new preloaded injectable IOL with enhanced features.
- [Month, Year]: [Company Name] received regulatory approval for its innovative IOL design in [Region].
- [Month, Year]: A significant merger between two major players reshaped the competitive landscape.
- [Month, Year]: New clinical trial data demonstrated improved visual outcomes with a specific IOL technology.
- [Month, Year]: A key patent related to preloaded injectable IOL technology expired, leading to increased competition.
Future Outlook for Preloaded Injectable Intraocular Lenses Market
The preloaded injectable IOL market is poised for significant growth driven by technological advancements, expanding patient populations, and increasing healthcare investments. Strategic partnerships, further product innovations, and expansion into new markets are expected to drive future market potential. The market is anticipated to witness a continued rise in demand, creating lucrative opportunities for established players and emerging companies.
Preloaded Injectable Intraocular Lenses Segmentation
-
1. Application
- 1.1. Hospital
- 1.2. Clinic
-
2. Types
- 2.1. Hydrophilic Type
- 2.2. Hydrophobic Type
Preloaded Injectable Intraocular Lenses Segmentation By Geography
-
1. North America
- 1.1. United States
- 1.2. Canada
- 1.3. Mexico
-
2. South America
- 2.1. Brazil
- 2.2. Argentina
- 2.3. Rest of South America
-
3. Europe
- 3.1. United Kingdom
- 3.2. Germany
- 3.3. France
- 3.4. Italy
- 3.5. Spain
- 3.6. Russia
- 3.7. Benelux
- 3.8. Nordics
- 3.9. Rest of Europe
-
4. Middle East & Africa
- 4.1. Turkey
- 4.2. Israel
- 4.3. GCC
- 4.4. North Africa
- 4.5. South Africa
- 4.6. Rest of Middle East & Africa
-
5. Asia Pacific
- 5.1. China
- 5.2. India
- 5.3. Japan
- 5.4. South Korea
- 5.5. ASEAN
- 5.6. Oceania
- 5.7. Rest of Asia Pacific
Preloaded Injectable Intraocular Lenses Regional Market Share
Geographic Coverage of Preloaded Injectable Intraocular Lenses
Preloaded Injectable Intraocular Lenses REPORT HIGHLIGHTS
| Aspects | Details |
|---|---|
| Study Period | 2020-2034 |
| Base Year | 2025 |
| Estimated Year | 2026 |
| Forecast Period | 2026-2034 |
| Historical Period | 2020-2025 |
| Growth Rate | CAGR of XX% from 2020-2034 |
| Segmentation |
|
Table of Contents
- 1. Introduction
- 1.1. Research Scope
- 1.2. Market Segmentation
- 1.3. Research Objective
- 1.4. Definitions and Assumptions
- 2. Executive Summary
- 2.1. Market Snapshot
- 3. Market Dynamics
- 3.1. Market Drivers
- 3.2. Market Restrains
- 3.3. Market Trends
- 3.4. Market Opportunities
- 4. Market Factor Analysis
- 4.1. Porters Five Forces
- 4.1.1. Bargaining Power of Suppliers
- 4.1.2. Bargaining Power of Buyers
- 4.1.3. Threat of New Entrants
- 4.1.4. Threat of Substitutes
- 4.1.5. Competitive Rivalry
- 4.2. PESTEL analysis
- 4.3. BCG Analysis
- 4.3.1. Stars (High Growth, High Market Share)
- 4.3.2. Cash Cows (Low Growth, High Market Share)
- 4.3.3. Question Mark (High Growth, Low Market Share)
- 4.3.4. Dogs (Low Growth, Low Market Share)
- 4.4. Ansoff Matrix Analysis
- 4.5. Supply Chain Analysis
- 4.6. Regulatory Landscape
- 4.7. Current Market Potential and Opportunity Assessment (TAM–SAM–SOM Framework)
- 4.8. PRI Analyst Note
- 4.1. Porters Five Forces
- 5. Market Analysis, Insights and Forecast 2021-2033
- 5.1. Market Analysis, Insights and Forecast - by Application
- 5.1.1. Hospital
- 5.1.2. Clinic
- 5.2. Market Analysis, Insights and Forecast - by Types
- 5.2.1. Hydrophilic Type
- 5.2.2. Hydrophobic Type
- 5.3. Market Analysis, Insights and Forecast - by Region
- 5.3.1. North America
- 5.3.2. South America
- 5.3.3. Europe
- 5.3.4. Middle East & Africa
- 5.3.5. Asia Pacific
- 5.1. Market Analysis, Insights and Forecast - by Application
- 6. Global Preloaded Injectable Intraocular Lenses Analysis, Insights and Forecast, 2021-2033
- 6.1. Market Analysis, Insights and Forecast - by Application
- 6.1.1. Hospital
- 6.1.2. Clinic
- 6.2. Market Analysis, Insights and Forecast - by Types
- 6.2.1. Hydrophilic Type
- 6.2.2. Hydrophobic Type
- 6.1. Market Analysis, Insights and Forecast - by Application
- 7. North America Preloaded Injectable Intraocular Lenses Analysis, Insights and Forecast, 2020-2032
- 7.1. Market Analysis, Insights and Forecast - by Application
- 7.1.1. Hospital
- 7.1.2. Clinic
- 7.2. Market Analysis, Insights and Forecast - by Types
- 7.2.1. Hydrophilic Type
- 7.2.2. Hydrophobic Type
- 7.1. Market Analysis, Insights and Forecast - by Application
- 8. South America Preloaded Injectable Intraocular Lenses Analysis, Insights and Forecast, 2020-2032
- 8.1. Market Analysis, Insights and Forecast - by Application
- 8.1.1. Hospital
- 8.1.2. Clinic
- 8.2. Market Analysis, Insights and Forecast - by Types
- 8.2.1. Hydrophilic Type
- 8.2.2. Hydrophobic Type
- 8.1. Market Analysis, Insights and Forecast - by Application
- 9. Europe Preloaded Injectable Intraocular Lenses Analysis, Insights and Forecast, 2020-2032
- 9.1. Market Analysis, Insights and Forecast - by Application
- 9.1.1. Hospital
- 9.1.2. Clinic
- 9.2. Market Analysis, Insights and Forecast - by Types
- 9.2.1. Hydrophilic Type
- 9.2.2. Hydrophobic Type
- 9.1. Market Analysis, Insights and Forecast - by Application
- 10. Middle East & Africa Preloaded Injectable Intraocular Lenses Analysis, Insights and Forecast, 2020-2032
- 10.1. Market Analysis, Insights and Forecast - by Application
- 10.1.1. Hospital
- 10.1.2. Clinic
- 10.2. Market Analysis, Insights and Forecast - by Types
- 10.2.1. Hydrophilic Type
- 10.2.2. Hydrophobic Type
- 10.1. Market Analysis, Insights and Forecast - by Application
- 11. Asia Pacific Preloaded Injectable Intraocular Lenses Analysis, Insights and Forecast, 2020-2032
- 11.1. Market Analysis, Insights and Forecast - by Application
- 11.1.1. Hospital
- 11.1.2. Clinic
- 11.2. Market Analysis, Insights and Forecast - by Types
- 11.2.1. Hydrophilic Type
- 11.2.2. Hydrophobic Type
- 11.1. Market Analysis, Insights and Forecast - by Application
- 12. Competitive Analysis
- 12.1. Company Profiles
- 12.1.1 NIDEK
- 12.1.1.1. Company Overview
- 12.1.1.2. Products
- 12.1.1.3. Company Financials
- 12.1.1.4. SWOT Analysis
- 12.1.2 BAUSCH + LOMB
- 12.1.2.1. Company Overview
- 12.1.2.2. Products
- 12.1.2.3. Company Financials
- 12.1.2.4. SWOT Analysis
- 12.1.3 Johnson & Johnson
- 12.1.3.1. Company Overview
- 12.1.3.2. Products
- 12.1.3.3. Company Financials
- 12.1.3.4. SWOT Analysis
- 12.1.4 Alcon
- 12.1.4.1. Company Overview
- 12.1.4.2. Products
- 12.1.4.3. Company Financials
- 12.1.4.4. SWOT Analysis
- 12.1.5 Rayner
- 12.1.5.1. Company Overview
- 12.1.5.2. Products
- 12.1.5.3. Company Financials
- 12.1.5.4. SWOT Analysis
- 12.1.6 Zeiss
- 12.1.6.1. Company Overview
- 12.1.6.2. Products
- 12.1.6.3. Company Financials
- 12.1.6.4. SWOT Analysis
- 12.1.7 Medicel
- 12.1.7.1. Company Overview
- 12.1.7.2. Products
- 12.1.7.3. Company Financials
- 12.1.7.4. SWOT Analysis
- 12.1.8 STAAR SURGICAL
- 12.1.8.1. Company Overview
- 12.1.8.2. Products
- 12.1.8.3. Company Financials
- 12.1.8.4. SWOT Analysis
- 12.1.9 Hoya Surgical Optics
- 12.1.9.1. Company Overview
- 12.1.9.2. Products
- 12.1.9.3. Company Financials
- 12.1.9.4. SWOT Analysis
- 12.1.10 Zaraccom
- 12.1.10.1. Company Overview
- 12.1.10.2. Products
- 12.1.10.3. Company Financials
- 12.1.10.4. SWOT Analysis
- 12.1.11 Adelberg Medical
- 12.1.11.1. Company Overview
- 12.1.11.2. Products
- 12.1.11.3. Company Financials
- 12.1.11.4. SWOT Analysis
- 12.1.12 AST Products
- 12.1.12.1. Company Overview
- 12.1.12.2. Products
- 12.1.12.3. Company Financials
- 12.1.12.4. SWOT Analysis
- 12.1.13 Eyebright Medical Technology
- 12.1.13.1. Company Overview
- 12.1.13.2. Products
- 12.1.13.3. Company Financials
- 12.1.13.4. SWOT Analysis
- 12.1.14 Henan Universe Intraocular Lens
- 12.1.14.1. Company Overview
- 12.1.14.2. Products
- 12.1.14.3. Company Financials
- 12.1.14.4. SWOT Analysis
- 12.1.15 Wuxi Vision Pro
- 12.1.15.1. Company Overview
- 12.1.15.2. Products
- 12.1.15.3. Company Financials
- 12.1.15.4. SWOT Analysis
- 12.1.1 NIDEK
- 12.2. Market Entropy
- 12.2.1 Company's Key Areas Served
- 12.2.2 Recent Developments
- 12.3. Company Market Share Analysis 2025
- 12.3.1 Top 5 Companies Market Share Analysis
- 12.3.2 Top 3 Companies Market Share Analysis
- 12.4. List of Potential Customers
- 13. Research Methodology
List of Figures
- Figure 1: Global Preloaded Injectable Intraocular Lenses Revenue Breakdown (million, %) by Region 2025 & 2033
- Figure 2: Global Preloaded Injectable Intraocular Lenses Volume Breakdown (K, %) by Region 2025 & 2033
- Figure 3: North America Preloaded Injectable Intraocular Lenses Revenue (million), by Application 2025 & 2033
- Figure 4: North America Preloaded Injectable Intraocular Lenses Volume (K), by Application 2025 & 2033
- Figure 5: North America Preloaded Injectable Intraocular Lenses Revenue Share (%), by Application 2025 & 2033
- Figure 6: North America Preloaded Injectable Intraocular Lenses Volume Share (%), by Application 2025 & 2033
- Figure 7: North America Preloaded Injectable Intraocular Lenses Revenue (million), by Types 2025 & 2033
- Figure 8: North America Preloaded Injectable Intraocular Lenses Volume (K), by Types 2025 & 2033
- Figure 9: North America Preloaded Injectable Intraocular Lenses Revenue Share (%), by Types 2025 & 2033
- Figure 10: North America Preloaded Injectable Intraocular Lenses Volume Share (%), by Types 2025 & 2033
- Figure 11: North America Preloaded Injectable Intraocular Lenses Revenue (million), by Country 2025 & 2033
- Figure 12: North America Preloaded Injectable Intraocular Lenses Volume (K), by Country 2025 & 2033
- Figure 13: North America Preloaded Injectable Intraocular Lenses Revenue Share (%), by Country 2025 & 2033
- Figure 14: North America Preloaded Injectable Intraocular Lenses Volume Share (%), by Country 2025 & 2033
- Figure 15: South America Preloaded Injectable Intraocular Lenses Revenue (million), by Application 2025 & 2033
- Figure 16: South America Preloaded Injectable Intraocular Lenses Volume (K), by Application 2025 & 2033
- Figure 17: South America Preloaded Injectable Intraocular Lenses Revenue Share (%), by Application 2025 & 2033
- Figure 18: South America Preloaded Injectable Intraocular Lenses Volume Share (%), by Application 2025 & 2033
- Figure 19: South America Preloaded Injectable Intraocular Lenses Revenue (million), by Types 2025 & 2033
- Figure 20: South America Preloaded Injectable Intraocular Lenses Volume (K), by Types 2025 & 2033
- Figure 21: South America Preloaded Injectable Intraocular Lenses Revenue Share (%), by Types 2025 & 2033
- Figure 22: South America Preloaded Injectable Intraocular Lenses Volume Share (%), by Types 2025 & 2033
- Figure 23: South America Preloaded Injectable Intraocular Lenses Revenue (million), by Country 2025 & 2033
- Figure 24: South America Preloaded Injectable Intraocular Lenses Volume (K), by Country 2025 & 2033
- Figure 25: South America Preloaded Injectable Intraocular Lenses Revenue Share (%), by Country 2025 & 2033
- Figure 26: South America Preloaded Injectable Intraocular Lenses Volume Share (%), by Country 2025 & 2033
- Figure 27: Europe Preloaded Injectable Intraocular Lenses Revenue (million), by Application 2025 & 2033
- Figure 28: Europe Preloaded Injectable Intraocular Lenses Volume (K), by Application 2025 & 2033
- Figure 29: Europe Preloaded Injectable Intraocular Lenses Revenue Share (%), by Application 2025 & 2033
- Figure 30: Europe Preloaded Injectable Intraocular Lenses Volume Share (%), by Application 2025 & 2033
- Figure 31: Europe Preloaded Injectable Intraocular Lenses Revenue (million), by Types 2025 & 2033
- Figure 32: Europe Preloaded Injectable Intraocular Lenses Volume (K), by Types 2025 & 2033
- Figure 33: Europe Preloaded Injectable Intraocular Lenses Revenue Share (%), by Types 2025 & 2033
- Figure 34: Europe Preloaded Injectable Intraocular Lenses Volume Share (%), by Types 2025 & 2033
- Figure 35: Europe Preloaded Injectable Intraocular Lenses Revenue (million), by Country 2025 & 2033
- Figure 36: Europe Preloaded Injectable Intraocular Lenses Volume (K), by Country 2025 & 2033
- Figure 37: Europe Preloaded Injectable Intraocular Lenses Revenue Share (%), by Country 2025 & 2033
- Figure 38: Europe Preloaded Injectable Intraocular Lenses Volume Share (%), by Country 2025 & 2033
- Figure 39: Middle East & Africa Preloaded Injectable Intraocular Lenses Revenue (million), by Application 2025 & 2033
- Figure 40: Middle East & Africa Preloaded Injectable Intraocular Lenses Volume (K), by Application 2025 & 2033
- Figure 41: Middle East & Africa Preloaded Injectable Intraocular Lenses Revenue Share (%), by Application 2025 & 2033
- Figure 42: Middle East & Africa Preloaded Injectable Intraocular Lenses Volume Share (%), by Application 2025 & 2033
- Figure 43: Middle East & Africa Preloaded Injectable Intraocular Lenses Revenue (million), by Types 2025 & 2033
- Figure 44: Middle East & Africa Preloaded Injectable Intraocular Lenses Volume (K), by Types 2025 & 2033
- Figure 45: Middle East & Africa Preloaded Injectable Intraocular Lenses Revenue Share (%), by Types 2025 & 2033
- Figure 46: Middle East & Africa Preloaded Injectable Intraocular Lenses Volume Share (%), by Types 2025 & 2033
- Figure 47: Middle East & Africa Preloaded Injectable Intraocular Lenses Revenue (million), by Country 2025 & 2033
- Figure 48: Middle East & Africa Preloaded Injectable Intraocular Lenses Volume (K), by Country 2025 & 2033
- Figure 49: Middle East & Africa Preloaded Injectable Intraocular Lenses Revenue Share (%), by Country 2025 & 2033
- Figure 50: Middle East & Africa Preloaded Injectable Intraocular Lenses Volume Share (%), by Country 2025 & 2033
- Figure 51: Asia Pacific Preloaded Injectable Intraocular Lenses Revenue (million), by Application 2025 & 2033
- Figure 52: Asia Pacific Preloaded Injectable Intraocular Lenses Volume (K), by Application 2025 & 2033
- Figure 53: Asia Pacific Preloaded Injectable Intraocular Lenses Revenue Share (%), by Application 2025 & 2033
- Figure 54: Asia Pacific Preloaded Injectable Intraocular Lenses Volume Share (%), by Application 2025 & 2033
- Figure 55: Asia Pacific Preloaded Injectable Intraocular Lenses Revenue (million), by Types 2025 & 2033
- Figure 56: Asia Pacific Preloaded Injectable Intraocular Lenses Volume (K), by Types 2025 & 2033
- Figure 57: Asia Pacific Preloaded Injectable Intraocular Lenses Revenue Share (%), by Types 2025 & 2033
- Figure 58: Asia Pacific Preloaded Injectable Intraocular Lenses Volume Share (%), by Types 2025 & 2033
- Figure 59: Asia Pacific Preloaded Injectable Intraocular Lenses Revenue (million), by Country 2025 & 2033
- Figure 60: Asia Pacific Preloaded Injectable Intraocular Lenses Volume (K), by Country 2025 & 2033
- Figure 61: Asia Pacific Preloaded Injectable Intraocular Lenses Revenue Share (%), by Country 2025 & 2033
- Figure 62: Asia Pacific Preloaded Injectable Intraocular Lenses Volume Share (%), by Country 2025 & 2033
List of Tables
- Table 1: Global Preloaded Injectable Intraocular Lenses Revenue million Forecast, by Application 2020 & 2033
- Table 2: Global Preloaded Injectable Intraocular Lenses Volume K Forecast, by Application 2020 & 2033
- Table 3: Global Preloaded Injectable Intraocular Lenses Revenue million Forecast, by Types 2020 & 2033
- Table 4: Global Preloaded Injectable Intraocular Lenses Volume K Forecast, by Types 2020 & 2033
- Table 5: Global Preloaded Injectable Intraocular Lenses Revenue million Forecast, by Region 2020 & 2033
- Table 6: Global Preloaded Injectable Intraocular Lenses Volume K Forecast, by Region 2020 & 2033
- Table 7: Global Preloaded Injectable Intraocular Lenses Revenue million Forecast, by Application 2020 & 2033
- Table 8: Global Preloaded Injectable Intraocular Lenses Volume K Forecast, by Application 2020 & 2033
- Table 9: Global Preloaded Injectable Intraocular Lenses Revenue million Forecast, by Types 2020 & 2033
- Table 10: Global Preloaded Injectable Intraocular Lenses Volume K Forecast, by Types 2020 & 2033
- Table 11: Global Preloaded Injectable Intraocular Lenses Revenue million Forecast, by Country 2020 & 2033
- Table 12: Global Preloaded Injectable Intraocular Lenses Volume K Forecast, by Country 2020 & 2033
- Table 13: United States Preloaded Injectable Intraocular Lenses Revenue (million) Forecast, by Application 2020 & 2033
- Table 14: United States Preloaded Injectable Intraocular Lenses Volume (K) Forecast, by Application 2020 & 2033
- Table 15: Canada Preloaded Injectable Intraocular Lenses Revenue (million) Forecast, by Application 2020 & 2033
- Table 16: Canada Preloaded Injectable Intraocular Lenses Volume (K) Forecast, by Application 2020 & 2033
- Table 17: Mexico Preloaded Injectable Intraocular Lenses Revenue (million) Forecast, by Application 2020 & 2033
- Table 18: Mexico Preloaded Injectable Intraocular Lenses Volume (K) Forecast, by Application 2020 & 2033
- Table 19: Global Preloaded Injectable Intraocular Lenses Revenue million Forecast, by Application 2020 & 2033
- Table 20: Global Preloaded Injectable Intraocular Lenses Volume K Forecast, by Application 2020 & 2033
- Table 21: Global Preloaded Injectable Intraocular Lenses Revenue million Forecast, by Types 2020 & 2033
- Table 22: Global Preloaded Injectable Intraocular Lenses Volume K Forecast, by Types 2020 & 2033
- Table 23: Global Preloaded Injectable Intraocular Lenses Revenue million Forecast, by Country 2020 & 2033
- Table 24: Global Preloaded Injectable Intraocular Lenses Volume K Forecast, by Country 2020 & 2033
- Table 25: Brazil Preloaded Injectable Intraocular Lenses Revenue (million) Forecast, by Application 2020 & 2033
- Table 26: Brazil Preloaded Injectable Intraocular Lenses Volume (K) Forecast, by Application 2020 & 2033
- Table 27: Argentina Preloaded Injectable Intraocular Lenses Revenue (million) Forecast, by Application 2020 & 2033
- Table 28: Argentina Preloaded Injectable Intraocular Lenses Volume (K) Forecast, by Application 2020 & 2033
- Table 29: Rest of South America Preloaded Injectable Intraocular Lenses Revenue (million) Forecast, by Application 2020 & 2033
- Table 30: Rest of South America Preloaded Injectable Intraocular Lenses Volume (K) Forecast, by Application 2020 & 2033
- Table 31: Global Preloaded Injectable Intraocular Lenses Revenue million Forecast, by Application 2020 & 2033
- Table 32: Global Preloaded Injectable Intraocular Lenses Volume K Forecast, by Application 2020 & 2033
- Table 33: Global Preloaded Injectable Intraocular Lenses Revenue million Forecast, by Types 2020 & 2033
- Table 34: Global Preloaded Injectable Intraocular Lenses Volume K Forecast, by Types 2020 & 2033
- Table 35: Global Preloaded Injectable Intraocular Lenses Revenue million Forecast, by Country 2020 & 2033
- Table 36: Global Preloaded Injectable Intraocular Lenses Volume K Forecast, by Country 2020 & 2033
- Table 37: United Kingdom Preloaded Injectable Intraocular Lenses Revenue (million) Forecast, by Application 2020 & 2033
- Table 38: United Kingdom Preloaded Injectable Intraocular Lenses Volume (K) Forecast, by Application 2020 & 2033
- Table 39: Germany Preloaded Injectable Intraocular Lenses Revenue (million) Forecast, by Application 2020 & 2033
- Table 40: Germany Preloaded Injectable Intraocular Lenses Volume (K) Forecast, by Application 2020 & 2033
- Table 41: France Preloaded Injectable Intraocular Lenses Revenue (million) Forecast, by Application 2020 & 2033
- Table 42: France Preloaded Injectable Intraocular Lenses Volume (K) Forecast, by Application 2020 & 2033
- Table 43: Italy Preloaded Injectable Intraocular Lenses Revenue (million) Forecast, by Application 2020 & 2033
- Table 44: Italy Preloaded Injectable Intraocular Lenses Volume (K) Forecast, by Application 2020 & 2033
- Table 45: Spain Preloaded Injectable Intraocular Lenses Revenue (million) Forecast, by Application 2020 & 2033
- Table 46: Spain Preloaded Injectable Intraocular Lenses Volume (K) Forecast, by Application 2020 & 2033
- Table 47: Russia Preloaded Injectable Intraocular Lenses Revenue (million) Forecast, by Application 2020 & 2033
- Table 48: Russia Preloaded Injectable Intraocular Lenses Volume (K) Forecast, by Application 2020 & 2033
- Table 49: Benelux Preloaded Injectable Intraocular Lenses Revenue (million) Forecast, by Application 2020 & 2033
- Table 50: Benelux Preloaded Injectable Intraocular Lenses Volume (K) Forecast, by Application 2020 & 2033
- Table 51: Nordics Preloaded Injectable Intraocular Lenses Revenue (million) Forecast, by Application 2020 & 2033
- Table 52: Nordics Preloaded Injectable Intraocular Lenses Volume (K) Forecast, by Application 2020 & 2033
- Table 53: Rest of Europe Preloaded Injectable Intraocular Lenses Revenue (million) Forecast, by Application 2020 & 2033
- Table 54: Rest of Europe Preloaded Injectable Intraocular Lenses Volume (K) Forecast, by Application 2020 & 2033
- Table 55: Global Preloaded Injectable Intraocular Lenses Revenue million Forecast, by Application 2020 & 2033
- Table 56: Global Preloaded Injectable Intraocular Lenses Volume K Forecast, by Application 2020 & 2033
- Table 57: Global Preloaded Injectable Intraocular Lenses Revenue million Forecast, by Types 2020 & 2033
- Table 58: Global Preloaded Injectable Intraocular Lenses Volume K Forecast, by Types 2020 & 2033
- Table 59: Global Preloaded Injectable Intraocular Lenses Revenue million Forecast, by Country 2020 & 2033
- Table 60: Global Preloaded Injectable Intraocular Lenses Volume K Forecast, by Country 2020 & 2033
- Table 61: Turkey Preloaded Injectable Intraocular Lenses Revenue (million) Forecast, by Application 2020 & 2033
- Table 62: Turkey Preloaded Injectable Intraocular Lenses Volume (K) Forecast, by Application 2020 & 2033
- Table 63: Israel Preloaded Injectable Intraocular Lenses Revenue (million) Forecast, by Application 2020 & 2033
- Table 64: Israel Preloaded Injectable Intraocular Lenses Volume (K) Forecast, by Application 2020 & 2033
- Table 65: GCC Preloaded Injectable Intraocular Lenses Revenue (million) Forecast, by Application 2020 & 2033
- Table 66: GCC Preloaded Injectable Intraocular Lenses Volume (K) Forecast, by Application 2020 & 2033
- Table 67: North Africa Preloaded Injectable Intraocular Lenses Revenue (million) Forecast, by Application 2020 & 2033
- Table 68: North Africa Preloaded Injectable Intraocular Lenses Volume (K) Forecast, by Application 2020 & 2033
- Table 69: South Africa Preloaded Injectable Intraocular Lenses Revenue (million) Forecast, by Application 2020 & 2033
- Table 70: South Africa Preloaded Injectable Intraocular Lenses Volume (K) Forecast, by Application 2020 & 2033
- Table 71: Rest of Middle East & Africa Preloaded Injectable Intraocular Lenses Revenue (million) Forecast, by Application 2020 & 2033
- Table 72: Rest of Middle East & Africa Preloaded Injectable Intraocular Lenses Volume (K) Forecast, by Application 2020 & 2033
- Table 73: Global Preloaded Injectable Intraocular Lenses Revenue million Forecast, by Application 2020 & 2033
- Table 74: Global Preloaded Injectable Intraocular Lenses Volume K Forecast, by Application 2020 & 2033
- Table 75: Global Preloaded Injectable Intraocular Lenses Revenue million Forecast, by Types 2020 & 2033
- Table 76: Global Preloaded Injectable Intraocular Lenses Volume K Forecast, by Types 2020 & 2033
- Table 77: Global Preloaded Injectable Intraocular Lenses Revenue million Forecast, by Country 2020 & 2033
- Table 78: Global Preloaded Injectable Intraocular Lenses Volume K Forecast, by Country 2020 & 2033
- Table 79: China Preloaded Injectable Intraocular Lenses Revenue (million) Forecast, by Application 2020 & 2033
- Table 80: China Preloaded Injectable Intraocular Lenses Volume (K) Forecast, by Application 2020 & 2033
- Table 81: India Preloaded Injectable Intraocular Lenses Revenue (million) Forecast, by Application 2020 & 2033
- Table 82: India Preloaded Injectable Intraocular Lenses Volume (K) Forecast, by Application 2020 & 2033
- Table 83: Japan Preloaded Injectable Intraocular Lenses Revenue (million) Forecast, by Application 2020 & 2033
- Table 84: Japan Preloaded Injectable Intraocular Lenses Volume (K) Forecast, by Application 2020 & 2033
- Table 85: South Korea Preloaded Injectable Intraocular Lenses Revenue (million) Forecast, by Application 2020 & 2033
- Table 86: South Korea Preloaded Injectable Intraocular Lenses Volume (K) Forecast, by Application 2020 & 2033
- Table 87: ASEAN Preloaded Injectable Intraocular Lenses Revenue (million) Forecast, by Application 2020 & 2033
- Table 88: ASEAN Preloaded Injectable Intraocular Lenses Volume (K) Forecast, by Application 2020 & 2033
- Table 89: Oceania Preloaded Injectable Intraocular Lenses Revenue (million) Forecast, by Application 2020 & 2033
- Table 90: Oceania Preloaded Injectable Intraocular Lenses Volume (K) Forecast, by Application 2020 & 2033
- Table 91: Rest of Asia Pacific Preloaded Injectable Intraocular Lenses Revenue (million) Forecast, by Application 2020 & 2033
- Table 92: Rest of Asia Pacific Preloaded Injectable Intraocular Lenses Volume (K) Forecast, by Application 2020 & 2033
Frequently Asked Questions
1. What is the projected Compound Annual Growth Rate (CAGR) of the Preloaded Injectable Intraocular Lenses?
The projected CAGR is approximately XX%.
2. Which companies are prominent players in the Preloaded Injectable Intraocular Lenses?
Key companies in the market include NIDEK, BAUSCH + LOMB, Johnson & Johnson, Alcon, Rayner, Zeiss, Medicel, STAAR SURGICAL, Hoya Surgical Optics, Zaraccom, Adelberg Medical, AST Products, Eyebright Medical Technology, Henan Universe Intraocular Lens, Wuxi Vision Pro.
3. What are the main segments of the Preloaded Injectable Intraocular Lenses?
The market segments include Application, Types.
4. Can you provide details about the market size?
The market size is estimated to be USD XXX million as of 2022.
5. What are some drivers contributing to market growth?
N/A
6. What are the notable trends driving market growth?
N/A
7. Are there any restraints impacting market growth?
N/A
8. Can you provide examples of recent developments in the market?
N/A
9. What pricing options are available for accessing the report?
Pricing options include single-user, multi-user, and enterprise licenses priced at USD 3950.00, USD 5925.00, and USD 7900.00 respectively.
10. Is the market size provided in terms of value or volume?
The market size is provided in terms of value, measured in million and volume, measured in K.
11. Are there any specific market keywords associated with the report?
Yes, the market keyword associated with the report is "Preloaded Injectable Intraocular Lenses," which aids in identifying and referencing the specific market segment covered.
12. How do I determine which pricing option suits my needs best?
The pricing options vary based on user requirements and access needs. Individual users may opt for single-user licenses, while businesses requiring broader access may choose multi-user or enterprise licenses for cost-effective access to the report.
13. Are there any additional resources or data provided in the Preloaded Injectable Intraocular Lenses report?
While the report offers comprehensive insights, it's advisable to review the specific contents or supplementary materials provided to ascertain if additional resources or data are available.
14. How can I stay updated on further developments or reports in the Preloaded Injectable Intraocular Lenses?
To stay informed about further developments, trends, and reports in the Preloaded Injectable Intraocular Lenses, consider subscribing to industry newsletters, following relevant companies and organizations, or regularly checking reputable industry news sources and publications.
Methodology
Step 1 - Identification of Relevant Samples Size from Population Database


Step 2 - Approaches for Defining Global Market Size (Value, Volume* & Price*)

Note*: In applicable scenarios
Step 3 - Data Sources
Primary Research
- Web Analytics
- Survey Reports
- Research Institute
- Latest Research Reports
- Opinion Leaders
Secondary Research
- Annual Reports
- White Paper
- Latest Press Release
- Industry Association
- Paid Database
- Investor Presentations

Step 4 - Data Triangulation
Involves using different sources of information in order to increase the validity of a study
These sources are likely to be stakeholders in a program - participants, other researchers, program staff, other community members, and so on.
Then we put all data in single framework & apply various statistical tools to find out the dynamic on the market.
During the analysis stage, feedback from the stakeholder groups would be compared to determine areas of agreement as well as areas of divergence