
Key Insights
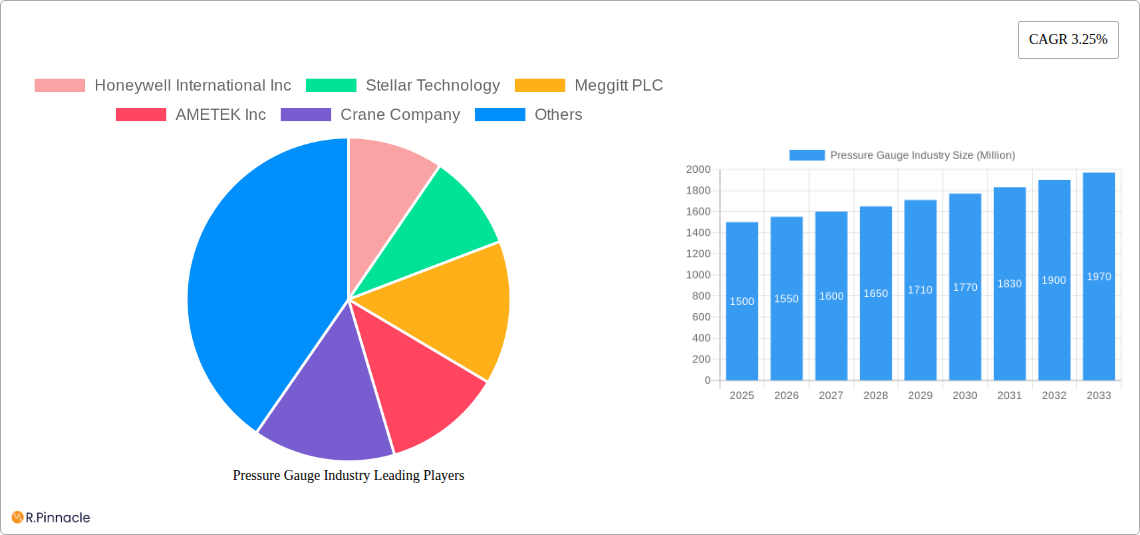
The pressure gauge industry, exhibiting a Compound Annual Growth Rate (CAGR) of 3.25%, is poised for steady expansion from 2025 to 2033. Driven by increasing industrial automation across sectors like aerospace and defense, automotive, healthcare, and energy, demand for accurate and reliable pressure measurement devices is escalating. Technological advancements, particularly in digital pressure gauges offering improved accuracy, remote monitoring capabilities, and enhanced durability, are significant trends shaping market growth. While the industry faces some restraints, including the increasing cost of raw materials and potential supply chain disruptions, the overall outlook remains positive. The shift toward sophisticated applications necessitates higher-precision gauges, fueling the growth of the digital segment. Furthermore, stringent safety regulations in industries like aerospace and defense are mandating the use of advanced, reliable pressure gauges, contributing to market expansion. The North American market, spearheaded by the United States, currently holds a significant market share due to robust industrial activity and technological innovation. However, the Asia-Pacific region, particularly China and India, is anticipated to witness robust growth driven by industrialization and infrastructure development. This presents significant opportunities for market players to expand their presence and capture a larger share of this rapidly evolving market.
The segmentation of the market reveals a strong preference for digital pressure gauges over analog counterparts. This preference is underpinned by advantages such as enhanced precision, data logging capabilities, and ease of integration with digital systems. Within applications, aerospace and defense sectors are expected to contribute significantly to the overall market growth owing to stringent safety standards and increasing demand for advanced aviation and defense systems. The healthcare sector's adoption of advanced pressure monitoring technologies, particularly in medical equipment, also drives significant demand. Key players in the market, including Honeywell International Inc., AMETEK Inc., and Meggitt PLC, are continuously investing in R&D and strategic partnerships to enhance their product offerings and expand their global reach, strengthening the overall competitive landscape and fostering innovation within the industry.
Pressure Gauge Industry Market Report: 2019-2033
This comprehensive report provides an in-depth analysis of the global pressure gauge industry, offering valuable insights for industry professionals, investors, and strategic decision-makers. The report covers the period from 2019 to 2033, with a focus on the forecast period from 2025 to 2033, and utilizes 2025 as the base year and estimated year. The global market is projected to reach xx Million by 2033, exhibiting a robust CAGR of xx% during the forecast period.
Pressure Gauge Industry Market Structure & Innovation Trends
The pressure gauge market exhibits a moderately consolidated structure, with key players like Honeywell International Inc, AMETEK Inc, Emerson Electric Co, and Crane Company holding significant market share. However, several smaller, specialized players also contribute to the overall market dynamics. Market share for these major players fluctuates, with estimates suggesting Honeywell holds approximately xx% in 2025, while AMETEK and Emerson hold xx% and xx%, respectively. The remaining xx% is distributed among other players, including those mentioned in the report’s Executive Summary.
Innovation in the pressure gauge industry is driven by the demand for enhanced accuracy, improved durability, increased functionality, and wireless connectivity. Stringent regulatory frameworks, particularly within industries like aerospace and healthcare, further stimulate innovation. Significant M&A activity has also reshaped the market landscape. For example, in recent years, there have been deals worth an estimated xx Million, largely driven by the desire to consolidate market share and broaden product portfolios.
- Market Concentration: Moderately Consolidated
- Key Innovation Drivers: Accuracy, Durability, Functionality, Wireless Connectivity, Regulatory Compliance
- M&A Activity: Significant, with deals totaling approximately xx Million in recent years.
- Product Substitutes: Emerging technologies like optical sensors and MEMS-based pressure sensors.
Pressure Gauge Industry Market Dynamics & Trends
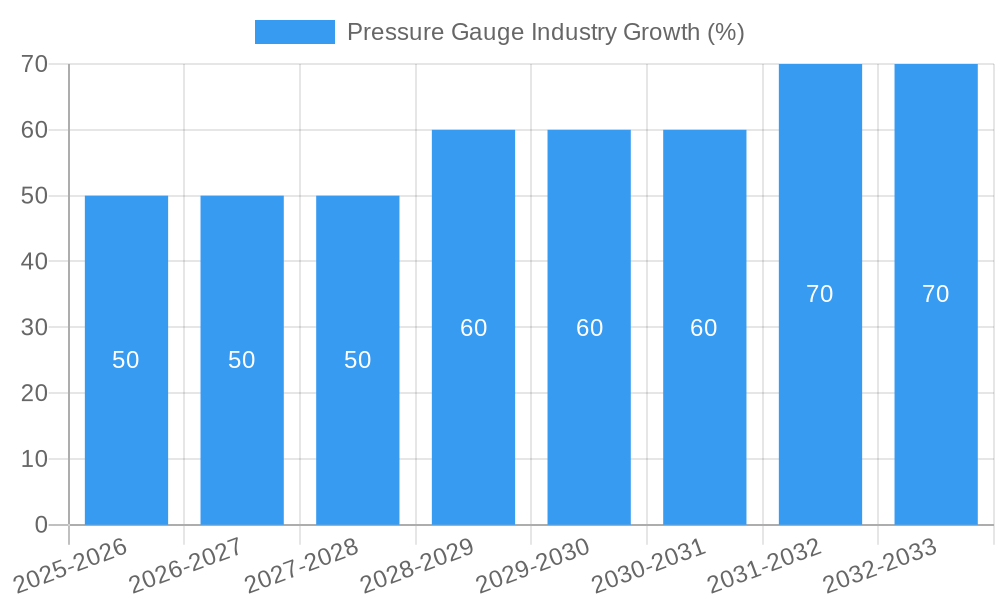
The pressure gauge market is experiencing robust growth, propelled by several key factors. Expanding industrial automation across diverse sectors such as energy, automotive, and healthcare fuels demand. The increasing adoption of sophisticated pressure measurement technologies in critical applications like aerospace and defense further contributes to the market expansion. Technological advancements, such as the integration of digital and wireless technologies, enhance product functionality and efficiency. Consumer preferences are shifting towards more accurate, reliable, and user-friendly pressure gauges. Competitive dynamics are characterized by intense rivalry amongst established players and the emergence of new entrants offering innovative solutions.
The market exhibits a strong growth trajectory, with a projected CAGR of xx% from 2025 to 2033. Market penetration continues to increase across various end-use sectors, especially in emerging economies, spurred by infrastructure development and industrialization. The increasing use of digital pressure gauges is driving a significant shift in market share, with a projected xx% market penetration by 2033.
Dominant Regions & Segments in Pressure Gauge Industry
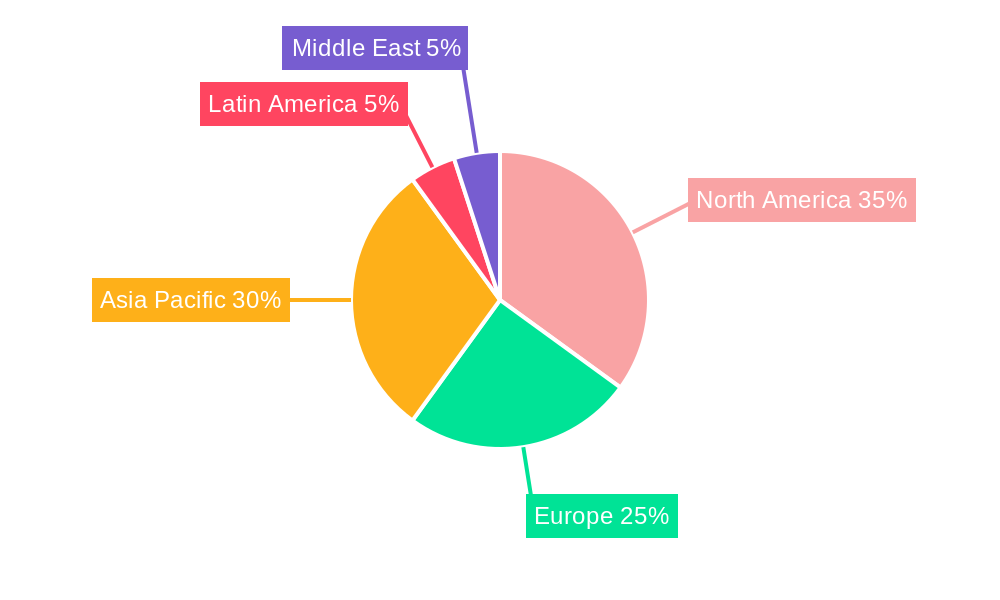
North America currently holds the leading position in the global pressure gauge market, driven by robust industrial activity, technological advancements, and high adoption rates across various sectors. Within North America, the United States holds a significant share due to its large manufacturing base and substantial investments in R&D. Europe follows as a major market, propelled by stringent regulatory compliance and a strong focus on industrial automation. Asia-Pacific is exhibiting rapid growth, fueled by increasing industrialization, infrastructure development, and a burgeoning manufacturing sector.
- Leading Region: North America (United States)
- Key Drivers in North America: Strong industrial base, technological advancements, high adoption rates.
- Key Drivers in Europe: Stringent regulations, industrial automation.
- Key Drivers in Asia-Pacific: Industrialization, infrastructure development, manufacturing growth.
Dominant Segments:
The digital segment is experiencing rapid growth due to its advanced functionalities and greater precision compared to analog counterparts. The aerospace and defense application segment dominates due to stringent safety and accuracy requirements and high spending on defense equipment and technology. The energy sector is also a significant application segment, driven by the demands of oil & gas extraction, power generation, and pipeline monitoring.
Pressure Gauge Industry Product Innovations
Recent innovations focus on improving accuracy, reliability, and connectivity. The integration of digital technologies and wireless communication enables remote monitoring and data acquisition, enhancing efficiency and safety. Product developments such as the DPG509 series from OMEGA and iPRESS from Parker Meggitt highlight these trends, emphasizing user-friendly interfaces and sophisticated functionalities tailored to specific applications. These innovations aim to deliver improved accuracy, enhanced durability, and streamlined data management capabilities, leading to stronger market penetration and competitive advantage.
Report Scope & Segmentation Analysis
This report offers a comprehensive segmentation of the pressure gauge market across various parameters.
Output Type:
- Analog: This segment is expected to witness steady growth due to its cost-effectiveness and simplicity. The market size is projected to be xx Million in 2025.
- Digital: This segment is anticipated to exhibit significant growth due to increasing demand for high accuracy and advanced features. The market size is projected to be xx Million in 2025.
Application:
- Aerospace & Defense: This segment is driven by stringent safety standards and high demand for reliable pressure measurement.
- Automotive: This segment is growing due to increasing use of pressure gauges in advanced driver-assistance systems (ADAS).
- Healthcare: This segment shows steady growth driven by medical equipment applications and continuous monitoring demands.
- Energy: This segment is influenced by the growth in oil and gas exploration and refining.
- Other Applications: This segment comprises various other industrial applications and shows moderate growth potential.
Key Drivers of Pressure Gauge Industry Growth
The growth of the pressure gauge industry is largely driven by technological advancements (digitalization, wireless connectivity), increasing demand across various industrial sectors (aerospace, automotive, energy), and stringent regulatory requirements for safety and accuracy in many applications. Economic growth in developing economies and infrastructure projects further boost demand for pressure gauges.
Challenges in the Pressure Gauge Industry Sector
The pressure gauge industry faces challenges such as intense competition from both established and emerging players, fluctuations in raw material prices, and evolving supply chain dynamics. Regulatory compliance varies across geographies, posing additional obstacles. These factors can impact production costs and profitability.
Emerging Opportunities in Pressure Gauge Industry
Emerging opportunities lie in the development of smart pressure gauges with integrated sensors and data analytics capabilities. Expansion into niche markets, such as renewable energy and environmental monitoring, also presents significant growth potential. Furthermore, the adoption of advanced materials and manufacturing processes can lead to improved product durability and cost-effectiveness.
Leading Players in the Pressure Gauge Industry Market
- Honeywell International Inc
- Stellar Technology
- Meggitt PLC
- AMETEK Inc
- Crane Company
- Tavis Corporation
- Industrial Quick Search Inc
- Emerson Electric Co
- CIRCOr Aerospace
- Newbow Aerospace Ltd
- WINTERS INSTRUMENTS
Key Developments in Pressure Gauge Industry
- December 2022: OMEGA launches the DPG509 series of digital pressure gauges, featuring a user-friendly interface and high accuracy (0.08%).
- October 2022: Parker Meggitt introduces iPRESS, a long-range wireless tire pressure gauge for aviation, enhancing user experience with integrated smartphone app functionality.
Future Outlook for Pressure Gauge Industry Market
The future of the pressure gauge market looks promising, driven by sustained growth across key end-use sectors and continuous technological innovations. Strategic partnerships and collaborations among industry players, along with a focus on developing sustainable and energy-efficient solutions, are expected to further shape the market landscape. The increasing demand for accurate and reliable pressure measurement across diverse industries will continue to fuel market growth.
Pressure Gauge Industry Segmentation
-
1. Output Type
- 1.1. Analog
- 1.2. Digital
-
2. Application
- 2.1. Aerospace and Defense
- 2.2. Automotive
- 2.3. Healthcare
- 2.4. Energy
- 2.5. Other Applications
Pressure Gauge Industry Segmentation By Geography
-
1. North America
- 1.1. United States
- 1.2. Canada
-
2. Europe
- 2.1. United Kingdom
- 2.2. Germany
- 2.3. France
- 2.4. Rest of Europe
-
3. Asia Pacific
- 3.1. China
- 3.2. India
- 3.3. Japan
- 3.4. Rest of Asia Pacific
-
4. Latin America
- 4.1. Brazil
- 4.2. Rest of Latin America
- 5. Middle East
-
6. Saudi Arabia
- 6.1. United Arab Emirates
- 6.2. Turkey
- 6.3. Rest of Middle East
Pressure Gauge Industry REPORT HIGHLIGHTS
| Aspects | Details |
|---|---|
| Study Period | 2019-2033 |
| Base Year | 2024 |
| Estimated Year | 2025 |
| Forecast Period | 2025-2033 |
| Historical Period | 2019-2024 |
| Growth Rate | CAGR of 3.25% from 2019-2033 |
| Segmentation |
|
Table of Contents
- 1. Introduction
- 1.1. Research Scope
- 1.2. Market Segmentation
- 1.3. Research Methodology
- 1.4. Definitions and Assumptions
- 2. Executive Summary
- 2.1. Introduction
- 3. Market Dynamics
- 3.1. Introduction
- 3.2. Market Drivers
- 3.3. Market Restrains
- 3.4. Market Trends
- 3.4.1. Healthcare Segment is Projected to Show the Highest Growth During the Forecast Period
- 4. Market Factor Analysis
- 4.1. Porters Five Forces
- 4.2. Supply/Value Chain
- 4.3. PESTEL analysis
- 4.4. Market Entropy
- 4.5. Patent/Trademark Analysis
- 5. Global Pressure Gauge Industry Analysis, Insights and Forecast, 2019-2031
- 5.1. Market Analysis, Insights and Forecast - by Output Type
- 5.1.1. Analog
- 5.1.2. Digital
- 5.2. Market Analysis, Insights and Forecast - by Application
- 5.2.1. Aerospace and Defense
- 5.2.2. Automotive
- 5.2.3. Healthcare
- 5.2.4. Energy
- 5.2.5. Other Applications
- 5.3. Market Analysis, Insights and Forecast - by Region
- 5.3.1. North America
- 5.3.2. Europe
- 5.3.3. Asia Pacific
- 5.3.4. Latin America
- 5.3.5. Middle East
- 5.3.6. Saudi Arabia
- 5.1. Market Analysis, Insights and Forecast - by Output Type
- 6. North America Pressure Gauge Industry Analysis, Insights and Forecast, 2019-2031
- 6.1. Market Analysis, Insights and Forecast - by Output Type
- 6.1.1. Analog
- 6.1.2. Digital
- 6.2. Market Analysis, Insights and Forecast - by Application
- 6.2.1. Aerospace and Defense
- 6.2.2. Automotive
- 6.2.3. Healthcare
- 6.2.4. Energy
- 6.2.5. Other Applications
- 6.1. Market Analysis, Insights and Forecast - by Output Type
- 7. Europe Pressure Gauge Industry Analysis, Insights and Forecast, 2019-2031
- 7.1. Market Analysis, Insights and Forecast - by Output Type
- 7.1.1. Analog
- 7.1.2. Digital
- 7.2. Market Analysis, Insights and Forecast - by Application
- 7.2.1. Aerospace and Defense
- 7.2.2. Automotive
- 7.2.3. Healthcare
- 7.2.4. Energy
- 7.2.5. Other Applications
- 7.1. Market Analysis, Insights and Forecast - by Output Type
- 8. Asia Pacific Pressure Gauge Industry Analysis, Insights and Forecast, 2019-2031
- 8.1. Market Analysis, Insights and Forecast - by Output Type
- 8.1.1. Analog
- 8.1.2. Digital
- 8.2. Market Analysis, Insights and Forecast - by Application
- 8.2.1. Aerospace and Defense
- 8.2.2. Automotive
- 8.2.3. Healthcare
- 8.2.4. Energy
- 8.2.5. Other Applications
- 8.1. Market Analysis, Insights and Forecast - by Output Type
- 9. Latin America Pressure Gauge Industry Analysis, Insights and Forecast, 2019-2031
- 9.1. Market Analysis, Insights and Forecast - by Output Type
- 9.1.1. Analog
- 9.1.2. Digital
- 9.2. Market Analysis, Insights and Forecast - by Application
- 9.2.1. Aerospace and Defense
- 9.2.2. Automotive
- 9.2.3. Healthcare
- 9.2.4. Energy
- 9.2.5. Other Applications
- 9.1. Market Analysis, Insights and Forecast - by Output Type
- 10. Middle East Pressure Gauge Industry Analysis, Insights and Forecast, 2019-2031
- 10.1. Market Analysis, Insights and Forecast - by Output Type
- 10.1.1. Analog
- 10.1.2. Digital
- 10.2. Market Analysis, Insights and Forecast - by Application
- 10.2.1. Aerospace and Defense
- 10.2.2. Automotive
- 10.2.3. Healthcare
- 10.2.4. Energy
- 10.2.5. Other Applications
- 10.1. Market Analysis, Insights and Forecast - by Output Type
- 11. Saudi Arabia Pressure Gauge Industry Analysis, Insights and Forecast, 2019-2031
- 11.1. Market Analysis, Insights and Forecast - by Output Type
- 11.1.1. Analog
- 11.1.2. Digital
- 11.2. Market Analysis, Insights and Forecast - by Application
- 11.2.1. Aerospace and Defense
- 11.2.2. Automotive
- 11.2.3. Healthcare
- 11.2.4. Energy
- 11.2.5. Other Applications
- 11.1. Market Analysis, Insights and Forecast - by Output Type
- 12. North America Pressure Gauge Industry Analysis, Insights and Forecast, 2019-2031
- 12.1. Market Analysis, Insights and Forecast - By Country/Sub-region
- 12.1.1 United States
- 12.1.2 Canada
- 13. Europe Pressure Gauge Industry Analysis, Insights and Forecast, 2019-2031
- 13.1. Market Analysis, Insights and Forecast - By Country/Sub-region
- 13.1.1 United Kingdom
- 13.1.2 Germany
- 13.1.3 France
- 13.1.4 Rest of Europe
- 14. Asia Pacific Pressure Gauge Industry Analysis, Insights and Forecast, 2019-2031
- 14.1. Market Analysis, Insights and Forecast - By Country/Sub-region
- 14.1.1 China
- 14.1.2 India
- 14.1.3 Japan
- 14.1.4 Rest of Asia Pacific
- 15. Latin America Pressure Gauge Industry Analysis, Insights and Forecast, 2019-2031
- 15.1. Market Analysis, Insights and Forecast - By Country/Sub-region
- 15.1.1 Brazil
- 15.1.2 Rest of Latin America
- 16. Middle East Pressure Gauge Industry Analysis, Insights and Forecast, 2019-2031
- 16.1. Market Analysis, Insights and Forecast - By Country/Sub-region
- 16.1.1.
- 17. Saudi Arabia Pressure Gauge Industry Analysis, Insights and Forecast, 2019-2031
- 17.1. Market Analysis, Insights and Forecast - By Country/Sub-region
- 17.1.1 United Arab Emirates
- 17.1.2 Turkey
- 17.1.3 Rest of Middle East
- 18. Competitive Analysis
- 18.1. Global Market Share Analysis 2024
- 18.2. Company Profiles
- 18.2.1 Honeywell International Inc
- 18.2.1.1. Overview
- 18.2.1.2. Products
- 18.2.1.3. SWOT Analysis
- 18.2.1.4. Recent Developments
- 18.2.1.5. Financials (Based on Availability)
- 18.2.2 Stellar Technology
- 18.2.2.1. Overview
- 18.2.2.2. Products
- 18.2.2.3. SWOT Analysis
- 18.2.2.4. Recent Developments
- 18.2.2.5. Financials (Based on Availability)
- 18.2.3 Meggitt PLC
- 18.2.3.1. Overview
- 18.2.3.2. Products
- 18.2.3.3. SWOT Analysis
- 18.2.3.4. Recent Developments
- 18.2.3.5. Financials (Based on Availability)
- 18.2.4 AMETEK Inc
- 18.2.4.1. Overview
- 18.2.4.2. Products
- 18.2.4.3. SWOT Analysis
- 18.2.4.4. Recent Developments
- 18.2.4.5. Financials (Based on Availability)
- 18.2.5 Crane Company
- 18.2.5.1. Overview
- 18.2.5.2. Products
- 18.2.5.3. SWOT Analysis
- 18.2.5.4. Recent Developments
- 18.2.5.5. Financials (Based on Availability)
- 18.2.6 Tavis Corporation
- 18.2.6.1. Overview
- 18.2.6.2. Products
- 18.2.6.3. SWOT Analysis
- 18.2.6.4. Recent Developments
- 18.2.6.5. Financials (Based on Availability)
- 18.2.7 Industrial Quick Search Inc
- 18.2.7.1. Overview
- 18.2.7.2. Products
- 18.2.7.3. SWOT Analysis
- 18.2.7.4. Recent Developments
- 18.2.7.5. Financials (Based on Availability)
- 18.2.8 Emerson Electric Co
- 18.2.8.1. Overview
- 18.2.8.2. Products
- 18.2.8.3. SWOT Analysis
- 18.2.8.4. Recent Developments
- 18.2.8.5. Financials (Based on Availability)
- 18.2.9 CIRCOR Aerospace
- 18.2.9.1. Overview
- 18.2.9.2. Products
- 18.2.9.3. SWOT Analysis
- 18.2.9.4. Recent Developments
- 18.2.9.5. Financials (Based on Availability)
- 18.2.10 Newbow Aerospace Ltd
- 18.2.10.1. Overview
- 18.2.10.2. Products
- 18.2.10.3. SWOT Analysis
- 18.2.10.4. Recent Developments
- 18.2.10.5. Financials (Based on Availability)
- 18.2.11 WINTERS INSTRUMENTS
- 18.2.11.1. Overview
- 18.2.11.2. Products
- 18.2.11.3. SWOT Analysis
- 18.2.11.4. Recent Developments
- 18.2.11.5. Financials (Based on Availability)
- 18.2.1 Honeywell International Inc
List of Figures
- Figure 1: Global Pressure Gauge Industry Revenue Breakdown (Million, %) by Region 2024 & 2032
- Figure 2: North America Pressure Gauge Industry Revenue (Million), by Country 2024 & 2032
- Figure 3: North America Pressure Gauge Industry Revenue Share (%), by Country 2024 & 2032
- Figure 4: Europe Pressure Gauge Industry Revenue (Million), by Country 2024 & 2032
- Figure 5: Europe Pressure Gauge Industry Revenue Share (%), by Country 2024 & 2032
- Figure 6: Asia Pacific Pressure Gauge Industry Revenue (Million), by Country 2024 & 2032
- Figure 7: Asia Pacific Pressure Gauge Industry Revenue Share (%), by Country 2024 & 2032
- Figure 8: Latin America Pressure Gauge Industry Revenue (Million), by Country 2024 & 2032
- Figure 9: Latin America Pressure Gauge Industry Revenue Share (%), by Country 2024 & 2032
- Figure 10: Middle East Pressure Gauge Industry Revenue (Million), by Country 2024 & 2032
- Figure 11: Middle East Pressure Gauge Industry Revenue Share (%), by Country 2024 & 2032
- Figure 12: Saudi Arabia Pressure Gauge Industry Revenue (Million), by Country 2024 & 2032
- Figure 13: Saudi Arabia Pressure Gauge Industry Revenue Share (%), by Country 2024 & 2032
- Figure 14: North America Pressure Gauge Industry Revenue (Million), by Output Type 2024 & 2032
- Figure 15: North America Pressure Gauge Industry Revenue Share (%), by Output Type 2024 & 2032
- Figure 16: North America Pressure Gauge Industry Revenue (Million), by Application 2024 & 2032
- Figure 17: North America Pressure Gauge Industry Revenue Share (%), by Application 2024 & 2032
- Figure 18: North America Pressure Gauge Industry Revenue (Million), by Country 2024 & 2032
- Figure 19: North America Pressure Gauge Industry Revenue Share (%), by Country 2024 & 2032
- Figure 20: Europe Pressure Gauge Industry Revenue (Million), by Output Type 2024 & 2032
- Figure 21: Europe Pressure Gauge Industry Revenue Share (%), by Output Type 2024 & 2032
- Figure 22: Europe Pressure Gauge Industry Revenue (Million), by Application 2024 & 2032
- Figure 23: Europe Pressure Gauge Industry Revenue Share (%), by Application 2024 & 2032
- Figure 24: Europe Pressure Gauge Industry Revenue (Million), by Country 2024 & 2032
- Figure 25: Europe Pressure Gauge Industry Revenue Share (%), by Country 2024 & 2032
- Figure 26: Asia Pacific Pressure Gauge Industry Revenue (Million), by Output Type 2024 & 2032
- Figure 27: Asia Pacific Pressure Gauge Industry Revenue Share (%), by Output Type 2024 & 2032
- Figure 28: Asia Pacific Pressure Gauge Industry Revenue (Million), by Application 2024 & 2032
- Figure 29: Asia Pacific Pressure Gauge Industry Revenue Share (%), by Application 2024 & 2032
- Figure 30: Asia Pacific Pressure Gauge Industry Revenue (Million), by Country 2024 & 2032
- Figure 31: Asia Pacific Pressure Gauge Industry Revenue Share (%), by Country 2024 & 2032
- Figure 32: Latin America Pressure Gauge Industry Revenue (Million), by Output Type 2024 & 2032
- Figure 33: Latin America Pressure Gauge Industry Revenue Share (%), by Output Type 2024 & 2032
- Figure 34: Latin America Pressure Gauge Industry Revenue (Million), by Application 2024 & 2032
- Figure 35: Latin America Pressure Gauge Industry Revenue Share (%), by Application 2024 & 2032
- Figure 36: Latin America Pressure Gauge Industry Revenue (Million), by Country 2024 & 2032
- Figure 37: Latin America Pressure Gauge Industry Revenue Share (%), by Country 2024 & 2032
- Figure 38: Middle East Pressure Gauge Industry Revenue (Million), by Output Type 2024 & 2032
- Figure 39: Middle East Pressure Gauge Industry Revenue Share (%), by Output Type 2024 & 2032
- Figure 40: Middle East Pressure Gauge Industry Revenue (Million), by Application 2024 & 2032
- Figure 41: Middle East Pressure Gauge Industry Revenue Share (%), by Application 2024 & 2032
- Figure 42: Middle East Pressure Gauge Industry Revenue (Million), by Country 2024 & 2032
- Figure 43: Middle East Pressure Gauge Industry Revenue Share (%), by Country 2024 & 2032
- Figure 44: Saudi Arabia Pressure Gauge Industry Revenue (Million), by Output Type 2024 & 2032
- Figure 45: Saudi Arabia Pressure Gauge Industry Revenue Share (%), by Output Type 2024 & 2032
- Figure 46: Saudi Arabia Pressure Gauge Industry Revenue (Million), by Application 2024 & 2032
- Figure 47: Saudi Arabia Pressure Gauge Industry Revenue Share (%), by Application 2024 & 2032
- Figure 48: Saudi Arabia Pressure Gauge Industry Revenue (Million), by Country 2024 & 2032
- Figure 49: Saudi Arabia Pressure Gauge Industry Revenue Share (%), by Country 2024 & 2032
List of Tables
- Table 1: Global Pressure Gauge Industry Revenue Million Forecast, by Region 2019 & 2032
- Table 2: Global Pressure Gauge Industry Revenue Million Forecast, by Output Type 2019 & 2032
- Table 3: Global Pressure Gauge Industry Revenue Million Forecast, by Application 2019 & 2032
- Table 4: Global Pressure Gauge Industry Revenue Million Forecast, by Region 2019 & 2032
- Table 5: Global Pressure Gauge Industry Revenue Million Forecast, by Country 2019 & 2032
- Table 6: United States Pressure Gauge Industry Revenue (Million) Forecast, by Application 2019 & 2032
- Table 7: Canada Pressure Gauge Industry Revenue (Million) Forecast, by Application 2019 & 2032
- Table 8: Global Pressure Gauge Industry Revenue Million Forecast, by Country 2019 & 2032
- Table 9: United Kingdom Pressure Gauge Industry Revenue (Million) Forecast, by Application 2019 & 2032
- Table 10: Germany Pressure Gauge Industry Revenue (Million) Forecast, by Application 2019 & 2032
- Table 11: France Pressure Gauge Industry Revenue (Million) Forecast, by Application 2019 & 2032
- Table 12: Rest of Europe Pressure Gauge Industry Revenue (Million) Forecast, by Application 2019 & 2032
- Table 13: Global Pressure Gauge Industry Revenue Million Forecast, by Country 2019 & 2032
- Table 14: China Pressure Gauge Industry Revenue (Million) Forecast, by Application 2019 & 2032
- Table 15: India Pressure Gauge Industry Revenue (Million) Forecast, by Application 2019 & 2032
- Table 16: Japan Pressure Gauge Industry Revenue (Million) Forecast, by Application 2019 & 2032
- Table 17: Rest of Asia Pacific Pressure Gauge Industry Revenue (Million) Forecast, by Application 2019 & 2032
- Table 18: Global Pressure Gauge Industry Revenue Million Forecast, by Country 2019 & 2032
- Table 19: Brazil Pressure Gauge Industry Revenue (Million) Forecast, by Application 2019 & 2032
- Table 20: Rest of Latin America Pressure Gauge Industry Revenue (Million) Forecast, by Application 2019 & 2032
- Table 21: Global Pressure Gauge Industry Revenue Million Forecast, by Country 2019 & 2032
- Table 22: Pressure Gauge Industry Revenue (Million) Forecast, by Application 2019 & 2032
- Table 23: Global Pressure Gauge Industry Revenue Million Forecast, by Country 2019 & 2032
- Table 24: United Arab Emirates Pressure Gauge Industry Revenue (Million) Forecast, by Application 2019 & 2032
- Table 25: Turkey Pressure Gauge Industry Revenue (Million) Forecast, by Application 2019 & 2032
- Table 26: Rest of Middle East Pressure Gauge Industry Revenue (Million) Forecast, by Application 2019 & 2032
- Table 27: Global Pressure Gauge Industry Revenue Million Forecast, by Output Type 2019 & 2032
- Table 28: Global Pressure Gauge Industry Revenue Million Forecast, by Application 2019 & 2032
- Table 29: Global Pressure Gauge Industry Revenue Million Forecast, by Country 2019 & 2032
- Table 30: United States Pressure Gauge Industry Revenue (Million) Forecast, by Application 2019 & 2032
- Table 31: Canada Pressure Gauge Industry Revenue (Million) Forecast, by Application 2019 & 2032
- Table 32: Global Pressure Gauge Industry Revenue Million Forecast, by Output Type 2019 & 2032
- Table 33: Global Pressure Gauge Industry Revenue Million Forecast, by Application 2019 & 2032
- Table 34: Global Pressure Gauge Industry Revenue Million Forecast, by Country 2019 & 2032
- Table 35: United Kingdom Pressure Gauge Industry Revenue (Million) Forecast, by Application 2019 & 2032
- Table 36: Germany Pressure Gauge Industry Revenue (Million) Forecast, by Application 2019 & 2032
- Table 37: France Pressure Gauge Industry Revenue (Million) Forecast, by Application 2019 & 2032
- Table 38: Rest of Europe Pressure Gauge Industry Revenue (Million) Forecast, by Application 2019 & 2032
- Table 39: Global Pressure Gauge Industry Revenue Million Forecast, by Output Type 2019 & 2032
- Table 40: Global Pressure Gauge Industry Revenue Million Forecast, by Application 2019 & 2032
- Table 41: Global Pressure Gauge Industry Revenue Million Forecast, by Country 2019 & 2032
- Table 42: China Pressure Gauge Industry Revenue (Million) Forecast, by Application 2019 & 2032
- Table 43: India Pressure Gauge Industry Revenue (Million) Forecast, by Application 2019 & 2032
- Table 44: Japan Pressure Gauge Industry Revenue (Million) Forecast, by Application 2019 & 2032
- Table 45: Rest of Asia Pacific Pressure Gauge Industry Revenue (Million) Forecast, by Application 2019 & 2032
- Table 46: Global Pressure Gauge Industry Revenue Million Forecast, by Output Type 2019 & 2032
- Table 47: Global Pressure Gauge Industry Revenue Million Forecast, by Application 2019 & 2032
- Table 48: Global Pressure Gauge Industry Revenue Million Forecast, by Country 2019 & 2032
- Table 49: Brazil Pressure Gauge Industry Revenue (Million) Forecast, by Application 2019 & 2032
- Table 50: Rest of Latin America Pressure Gauge Industry Revenue (Million) Forecast, by Application 2019 & 2032
- Table 51: Global Pressure Gauge Industry Revenue Million Forecast, by Output Type 2019 & 2032
- Table 52: Global Pressure Gauge Industry Revenue Million Forecast, by Application 2019 & 2032
- Table 53: Global Pressure Gauge Industry Revenue Million Forecast, by Country 2019 & 2032
- Table 54: Global Pressure Gauge Industry Revenue Million Forecast, by Output Type 2019 & 2032
- Table 55: Global Pressure Gauge Industry Revenue Million Forecast, by Application 2019 & 2032
- Table 56: Global Pressure Gauge Industry Revenue Million Forecast, by Country 2019 & 2032
- Table 57: United Arab Emirates Pressure Gauge Industry Revenue (Million) Forecast, by Application 2019 & 2032
- Table 58: Turkey Pressure Gauge Industry Revenue (Million) Forecast, by Application 2019 & 2032
- Table 59: Rest of Middle East Pressure Gauge Industry Revenue (Million) Forecast, by Application 2019 & 2032
Frequently Asked Questions
1. What is the projected Compound Annual Growth Rate (CAGR) of the Pressure Gauge Industry?
The projected CAGR is approximately 3.25%.
2. Which companies are prominent players in the Pressure Gauge Industry?
Key companies in the market include Honeywell International Inc, Stellar Technology, Meggitt PLC, AMETEK Inc, Crane Company, Tavis Corporation, Industrial Quick Search Inc, Emerson Electric Co, CIRCOR Aerospace, Newbow Aerospace Ltd, WINTERS INSTRUMENTS.
3. What are the main segments of the Pressure Gauge Industry?
The market segments include Output Type, Application.
4. Can you provide details about the market size?
The market size is estimated to be USD XX Million as of 2022.
5. What are some drivers contributing to market growth?
N/A
6. What are the notable trends driving market growth?
Healthcare Segment is Projected to Show the Highest Growth During the Forecast Period.
7. Are there any restraints impacting market growth?
N/A
8. Can you provide examples of recent developments in the market?
In December 2022, OMEGA announced the launch of DPG509, OMEGA's newest series of digital pressure gauges, an advanced product designed with maximum functionality. The new DPG509 features a user-friendly interface with four buttons and a large 4-digit backlit display. The full-scale accuracy the product offers is as high as 0.08%.
9. What pricing options are available for accessing the report?
Pricing options include single-user, multi-user, and enterprise licenses priced at USD 4750, USD 5250, and USD 8750 respectively.
10. Is the market size provided in terms of value or volume?
The market size is provided in terms of value, measured in Million.
11. Are there any specific market keywords associated with the report?
Yes, the market keyword associated with the report is "Pressure Gauge Industry," which aids in identifying and referencing the specific market segment covered.
12. How do I determine which pricing option suits my needs best?
The pricing options vary based on user requirements and access needs. Individual users may opt for single-user licenses, while businesses requiring broader access may choose multi-user or enterprise licenses for cost-effective access to the report.
13. Are there any additional resources or data provided in the Pressure Gauge Industry report?
While the report offers comprehensive insights, it's advisable to review the specific contents or supplementary materials provided to ascertain if additional resources or data are available.
14. How can I stay updated on further developments or reports in the Pressure Gauge Industry?
To stay informed about further developments, trends, and reports in the Pressure Gauge Industry, consider subscribing to industry newsletters, following relevant companies and organizations, or regularly checking reputable industry news sources and publications.
Methodology
Step 1 - Identification of Relevant Samples Size from Population Database


Step 2 - Approaches for Defining Global Market Size (Value, Volume* & Price*)

Note*: In applicable scenarios
Step 3 - Data Sources
Primary Research
- Web Analytics
- Survey Reports
- Research Institute
- Latest Research Reports
- Opinion Leaders
Secondary Research
- Annual Reports
- White Paper
- Latest Press Release
- Industry Association
- Paid Database
- Investor Presentations

Step 4 - Data Triangulation
Involves using different sources of information in order to increase the validity of a study
These sources are likely to be stakeholders in a program - participants, other researchers, program staff, other community members, and so on.
Then we put all data in single framework & apply various statistical tools to find out the dynamic on the market.
During the analysis stage, feedback from the stakeholder groups would be compared to determine areas of agreement as well as areas of divergence


