

Key Insights
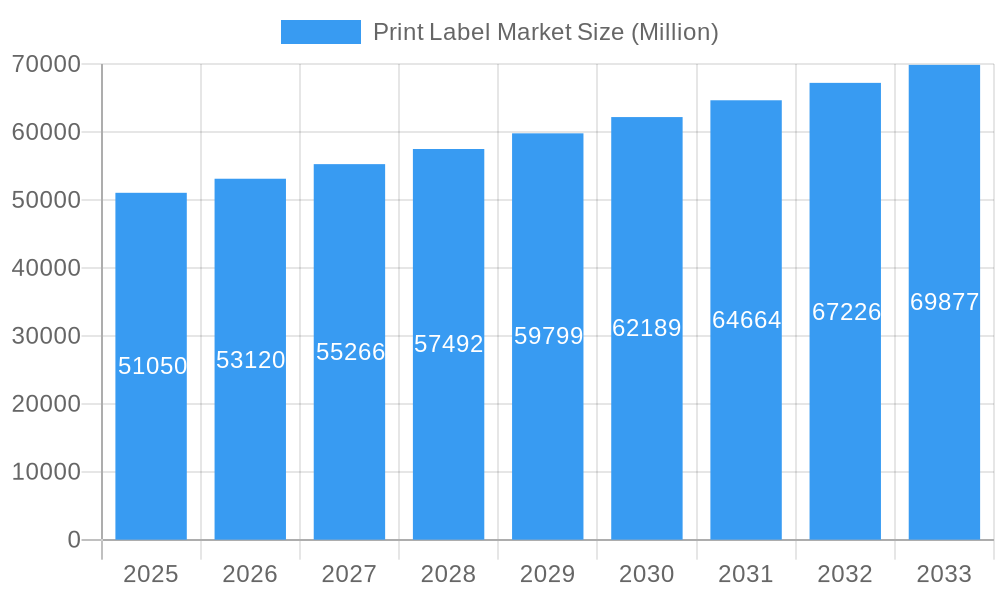
The global print label market, valued at $51.05 billion in 2025, is projected to experience robust growth, driven by a Compound Annual Growth Rate (CAGR) of 4.09% from 2025 to 2033. This expansion is fueled by several key factors. The increasing demand for customized packaging across diverse end-use industries, including food and beverage, healthcare, and cosmetics, is a significant driver. The rising preference for visually appealing and informative labels to enhance product branding and attract consumers further boosts market growth. Technological advancements in print processes, such as the adoption of digital printing technologies offering greater flexibility and shorter turnaround times, contribute significantly. Furthermore, the growing e-commerce sector necessitates sophisticated labeling solutions for efficient supply chain management and product tracking, stimulating market demand. The shift towards sustainable and eco-friendly label materials, including biodegradable and recyclable options, also presents a promising avenue for growth.
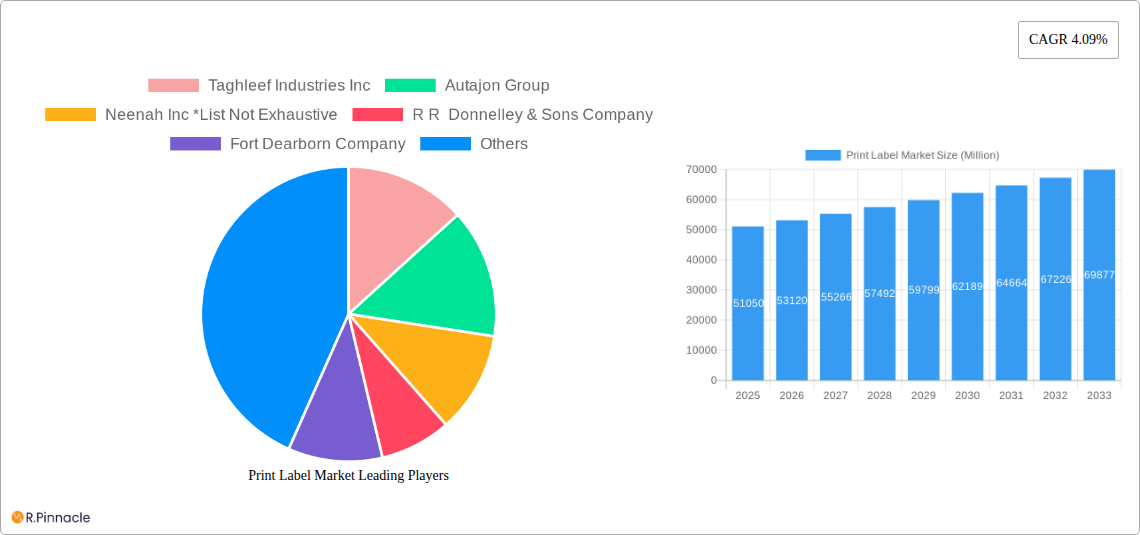
Print Label Market Market Size (In Billion)
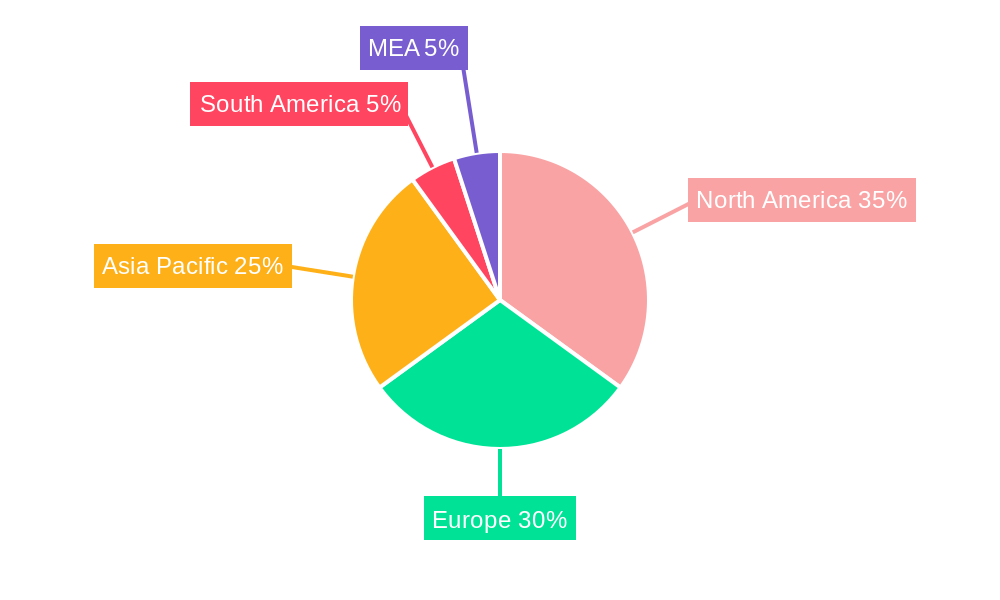
However, the market faces certain restraints. Fluctuations in raw material prices, particularly those of adhesives and substrates, can impact profitability. Stringent environmental regulations regarding label material composition and disposal pose challenges to manufacturers. Competition from alternative labeling technologies, such as RFID tags, also exerts pressure on the market. Nevertheless, the overall market outlook remains positive, with continued innovation in label design, materials, and printing technologies expected to drive growth across various geographical segments. North America and Europe are currently the dominant regions, but the Asia-Pacific region is anticipated to witness substantial growth due to expanding industrialization and rising consumer spending. The increasing adoption of pressure-sensitive labels and the growing demand for specialized labels, such as linerless and in-mold labels, further segment and diversify this dynamic market.
Print Label Market Company Market Share
Print Label Market Report: 2019-2033
This comprehensive report provides a detailed analysis of the global Print Label Market, offering invaluable insights for industry professionals, investors, and strategic decision-makers. The study period covers 2019-2033, with 2025 as the base and estimated year. The report segments the market by print process, label format, and end-user industries, offering granular data and projections for informed business planning. Expect a detailed examination of market dynamics, competitive landscape, and emerging opportunities, supported by robust data and insightful analysis. The market is valued at xx Million in 2025 and is projected to reach xx Million by 2033, exhibiting a CAGR of xx% during the forecast period (2025-2033).
Print Label Market Structure & Innovation Trends
The Print Label Market exhibits a moderately consolidated structure, with several key players holding significant market share. While precise market share data for individual companies is proprietary, companies like Avery Dennison Corporation, CCL Industries, and 3M Company are recognized as major players. The market is characterized by ongoing M&A activity, as evidenced by acquisitions such as Resource Label Group's acquisition of QSX Labels in 2022. While precise deal values for all M&A activity are unavailable, these transactions highlight the consolidation trend within the industry and the pursuit of enhanced market positions and expanded product portfolios. The market is driven by innovation in print technologies (e.g., inkjet, flexography), sustainability concerns pushing for eco-friendly materials, and evolving end-user demands for customized and high-quality labels. Regulatory frameworks related to labeling and material compliance also influence market trends. Product substitutes such as digital printing and other forms of product identification exist but often don't fully replace print labels due to cost or performance reasons. The end-user demographics are diverse, spanning various industries and requiring different label functionalities.
- Market Concentration: Moderately consolidated, with several large players holding significant market share (exact figures are proprietary and require a full report purchase).
- Innovation Drivers: Advancements in printing technologies, sustainable material development, and customization demands.
- M&A Activity: Significant activity observed, with acquisitions driving consolidation (e.g., Resource Label Group's acquisition of QSX Labels). Deal values for all M&A are proprietary.
- Regulatory Frameworks: Regulations impacting material composition and labeling practices significantly influence market trends.
Print Label Market Dynamics & Trends
The Print Label Market is experiencing robust growth, driven by several key factors. The increasing demand for packaged goods across diverse sectors fuels the need for labels. Technological advancements, such as the adoption of digital printing technologies like inkjet, are improving label production efficiency and customization capabilities. Consumer preferences for sustainable and eco-friendly packaging are driving the demand for labels made from recycled and renewable materials. The competitive dynamics are intense, with established players and new entrants vying for market share through innovation, pricing strategies, and acquisitions. The market exhibits a high degree of fragmentation, with many small and medium-sized enterprises coexisting alongside large multinational corporations. This leads to both intense competition and significant opportunities for differentiation.
Dominant Regions & Segments in Print Label Market
While precise regional breakdowns require a full report, North America and Europe are anticipated to be leading regions in the Print Label Market, owing to their established packaging and manufacturing industries and high consumer spending. Within the segments:
- By Print Process: Flexography maintains a significant market share due to its versatility and cost-effectiveness. Inkjet printing is expected to grow rapidly due to its high level of customization.
- By Label Format: Pressure-sensitive labels represent the largest segment, driven by its ease of application and broad applicability. The linerless label segment is experiencing growth due to sustainability concerns.
- By End-user Industries: Food and beverage, healthcare, and cosmetics are major end-user segments, with growth driven by the high volume of packaged products.
Key Drivers by Region (examples):
- North America: Strong consumer spending, robust manufacturing base, and regulatory emphasis on product labeling.
- Europe: Similar to North America, with the added presence of several large label manufacturing companies.
- Asia-Pacific: Rapidly growing economies with increasing demand for packaged goods, though infrastructure in certain regions might hinder rapid growth.
Print Label Market Product Innovations
Recent product innovations focus on sustainable materials, such as recycled paper and biodegradable films, and advanced printing technologies like inkjet and digital printing for enhanced customization and precision. These innovations cater to growing consumer demand for environmentally friendly packaging and increased brand differentiation. Further, innovations are extending into smart labels with integrated technologies for track and trace applications and enhanced consumer engagement.
Report Scope & Segmentation Analysis
This report provides an in-depth segmentation of the Print Label Market, meticulously analyzing it across three critical dimensions: print process (e.g., flexography, digital printing, gravure), label format (e.g., pressure-sensitive, shrink sleeves, in-mold labels), and end-user industries (e.g., food & beverage, pharmaceuticals, personal care, industrial). For each segment, we offer a granular analysis of historical and projected market sizes, compound annual growth rates (CAGR), prevailing competitive dynamics, and the pivotal market drivers influencing their trajectory. Detailed, segment-specific forecasts, including market value in millions of USD and precise growth rates, are exclusively reserved for subscribers of the complete report.
Key Drivers of Print Label Market Growth
The Print Label Market's growth is primarily driven by technological advancements in printing technologies, the rise of e-commerce and its associated demand for packaging, and increasing regulatory pressures emphasizing product labeling and traceability. Sustainability concerns are also a major factor, driving demand for eco-friendly label materials and production processes.
Challenges in the Print Label Market Sector
Challenges include fluctuations in raw material prices, intense competition from both established players and new entrants, and ever-evolving regulatory compliance requirements. Supply chain disruptions can also impact production and delivery times, negatively affecting market dynamics. These challenges can impact profitability and overall market growth.
Emerging Opportunities in Print Label Market
The Print Label Market is currently witnessing significant emerging opportunities fueled by a confluence of evolving consumer preferences and technological advancements. A paramount opportunity lies in the escalating demand for sustainable and eco-friendly labels, with a particular focus on recyclable materials, biodegradable options, and reduced environmental impact throughout the product lifecycle. Concurrently, the burgeoning field of smart packaging solutions presents a fertile ground for innovation, incorporating integrated technologies such as RFID, NFC, and QR codes for enhanced traceability, consumer engagement, and supply chain efficiency. Furthermore, the expansion into new and developing geographic markets, driven by industrial growth and rising disposable incomes, offers substantial potential. The persistent trend of personalization and customization, enabling brands to tailor labels for specific campaigns, regions, or even individual consumers, remains a strong and consistent driver of market opportunity.
Leading Players in the Print Label Market Market
- Taghleef Industries Inc
- Autajon Group
- Neenah Inc
- R R Donnelley & Sons Company
- Fort Dearborn Company
- Ahlstrom-Munksjo Oyj
- Constantia Flexibles Group GmbH
- Multi Packaging Solutions (WestRock Company)
- Coveris
- Epac holdings LLC
- CCL Industries
- Taylor Corporation
- 3M Company
- Cenveo Corporation
- Mondi Group
- Ravenwood Packaging
- Multi-Color Corporation
- Clondalkin Group
- Avery Dennison Corporation
- Fuji Seal International Inc
- Huhtamaki OYJ
- Brady Corporation
- Sato America
- Fedrigoni Self-Adhesives (Fedrigoni Group)
Key Developments in Print Label Market Industry
- May 2022: Mondi demonstrated a strong commitment to sustainability by transitioning its entire portfolio of glassine-based release liners to certified base paper, aligning with growing industry demands for environmentally responsible packaging materials.
- January 2022: Resource Label Group LLC strategically expanded its market footprint in the New England region through the acquisition of QSX Labels, reinforcing its presence and service offerings in this key geographical area.
- October 2021: HP Inc. launched a new range of digital printing solutions designed for the label and packaging industry, promising enhanced speed, efficiency, and print quality for converters.
- July 2021: Avery Dennison introduced its new sustainable adhesive technology, designed to improve recyclability and reduce the environmental impact of pressure-sensitive labels across various applications.
Future Outlook for Print Label Market Market
The Print Label Market is on an upward trajectory, poised for robust and sustained growth in the foreseeable future. This positive outlook is underpinned by several key factors: ongoing technological innovation, particularly in digital printing and material science, which enables greater efficiency and enhanced label functionalities; a continuously increasing demand for sustainable packaging solutions driven by regulatory pressures and consumer awareness; and the exponential growth of the e-commerce sector, which necessitates sophisticated and visually appealing labeling for product identification and branding across diverse supply chains. To capitalize on these trends and navigate the evolving competitive landscape, strategic partnerships, mergers and acquisitions, and dedicated investments in research and development will be crucial for market players seeking to drive innovation, expand their global reach, and secure a leading position in the Print Label Market.
Print Label Market Segmentation
-
1. Print Process
- 1.1. Offset lithography
- 1.2. Gravure
- 1.3. Flexography
- 1.4. Screen
- 1.5. Letterpress
- 1.6. Electrophotography
- 1.7. Inkjet
-
2. Label Format
- 2.1. Wet-glue labels
- 2.2. Pressure-sensitive labels
- 2.3. Linerless labels
- 2.4. Multi-part tracking labels
- 2.5. In-mold labels
- 2.6. Shrink and Stretch Sleeves
-
3. End-user Industries
- 3.1. Food
- 3.2. Beverage
- 3.3. Healthcare
- 3.4. Cosmetics
- 3.5. Household
- 3.6. Industri
- 3.7. Logistics
- 3.8. Other End-user Industries
Print Label Market Segmentation By Geography
-
1. North America
- 1.1. United States
- 1.2. Canada
-
2. Europe
- 2.1. United Kingdom
- 2.2. Germany
- 2.3. France
- 2.4. Spain
- 2.5. Italy
- 2.6. Poland
- 2.7. Netherlands
- 2.8. Rest of Europe
-
3. Asia Pacific
- 3.1. China
- 3.2. India
- 3.3. Japan
- 3.4. Australia
- 3.5. South Korea
- 3.6. Rest of Asia Pacific
-
4. Latin America
- 4.1. Brazil
- 4.2. Mexico
- 4.3. Rest of Latin America
- 5. Middle East and Africa
Print Label Market Regional Market Share
Geographic Coverage of Print Label Market
Print Label Market REPORT HIGHLIGHTS
| Aspects | Details |
|---|---|
| Study Period | 2020-2034 |
| Base Year | 2025 |
| Estimated Year | 2026 |
| Forecast Period | 2026-2034 |
| Historical Period | 2020-2025 |
| Growth Rate | CAGR of 4.09% from 2020-2034 |
| Segmentation |
|
Table of Contents
- 1. Introduction
- 1.1. Research Scope
- 1.2. Market Segmentation
- 1.3. Research Objective
- 1.4. Definitions and Assumptions
- 2. Executive Summary
- 2.1. Market Snapshot
- 3. Market Dynamics
- 3.1. Market Drivers
- 3.2. Market Restrains
- 3.3. Market Trends
- 3.4. Market Opportunities
- 4. Market Factor Analysis
- 4.1. Porters Five Forces
- 4.1.1. Bargaining Power of Suppliers
- 4.1.2. Bargaining Power of Buyers
- 4.1.3. Threat of New Entrants
- 4.1.4. Threat of Substitutes
- 4.1.5. Competitive Rivalry
- 4.2. PESTEL analysis
- 4.3. BCG Analysis
- 4.3.1. Stars (High Growth, High Market Share)
- 4.3.2. Cash Cows (Low Growth, High Market Share)
- 4.3.3. Question Mark (High Growth, Low Market Share)
- 4.3.4. Dogs (Low Growth, Low Market Share)
- 4.4. Ansoff Matrix Analysis
- 4.5. Supply Chain Analysis
- 4.6. Regulatory Landscape
- 4.7. Current Market Potential and Opportunity Assessment (TAM–SAM–SOM Framework)
- 4.8. PRI Analyst Note
- 4.1. Porters Five Forces
- 5. Market Analysis, Insights and Forecast 2021-2033
- 5.1. Market Analysis, Insights and Forecast - by Print Process
- 5.1.1. Offset lithography
- 5.1.2. Gravure
- 5.1.3. Flexography
- 5.1.4. Screen
- 5.1.5. Letterpress
- 5.1.6. Electrophotography
- 5.1.7. Inkjet
- 5.2. Market Analysis, Insights and Forecast - by Label Format
- 5.2.1. Wet-glue labels
- 5.2.2. Pressure-sensitive labels
- 5.2.3. Linerless labels
- 5.2.4. Multi-part tracking labels
- 5.2.5. In-mold labels
- 5.2.6. Shrink and Stretch Sleeves
- 5.3. Market Analysis, Insights and Forecast - by End-user Industries
- 5.3.1. Food
- 5.3.2. Beverage
- 5.3.3. Healthcare
- 5.3.4. Cosmetics
- 5.3.5. Household
- 5.3.6. Industri
- 5.3.7. Logistics
- 5.3.8. Other End-user Industries
- 5.4. Market Analysis, Insights and Forecast - by Region
- 5.4.1. North America
- 5.4.2. Europe
- 5.4.3. Asia Pacific
- 5.4.4. Latin America
- 5.4.5. Middle East and Africa
- 5.1. Market Analysis, Insights and Forecast - by Print Process
- 6. Global Print Label Market Analysis, Insights and Forecast, 2021-2033
- 6.1. Market Analysis, Insights and Forecast - by Print Process
- 6.1.1. Offset lithography
- 6.1.2. Gravure
- 6.1.3. Flexography
- 6.1.4. Screen
- 6.1.5. Letterpress
- 6.1.6. Electrophotography
- 6.1.7. Inkjet
- 6.2. Market Analysis, Insights and Forecast - by Label Format
- 6.2.1. Wet-glue labels
- 6.2.2. Pressure-sensitive labels
- 6.2.3. Linerless labels
- 6.2.4. Multi-part tracking labels
- 6.2.5. In-mold labels
- 6.2.6. Shrink and Stretch Sleeves
- 6.3. Market Analysis, Insights and Forecast - by End-user Industries
- 6.3.1. Food
- 6.3.2. Beverage
- 6.3.3. Healthcare
- 6.3.4. Cosmetics
- 6.3.5. Household
- 6.3.6. Industri
- 6.3.7. Logistics
- 6.3.8. Other End-user Industries
- 6.1. Market Analysis, Insights and Forecast - by Print Process
- 7. North America Print Label Market Analysis, Insights and Forecast, 2020-2032
- 7.1. Market Analysis, Insights and Forecast - by Print Process
- 7.1.1. Offset lithography
- 7.1.2. Gravure
- 7.1.3. Flexography
- 7.1.4. Screen
- 7.1.5. Letterpress
- 7.1.6. Electrophotography
- 7.1.7. Inkjet
- 7.2. Market Analysis, Insights and Forecast - by Label Format
- 7.2.1. Wet-glue labels
- 7.2.2. Pressure-sensitive labels
- 7.2.3. Linerless labels
- 7.2.4. Multi-part tracking labels
- 7.2.5. In-mold labels
- 7.2.6. Shrink and Stretch Sleeves
- 7.3. Market Analysis, Insights and Forecast - by End-user Industries
- 7.3.1. Food
- 7.3.2. Beverage
- 7.3.3. Healthcare
- 7.3.4. Cosmetics
- 7.3.5. Household
- 7.3.6. Industri
- 7.3.7. Logistics
- 7.3.8. Other End-user Industries
- 7.1. Market Analysis, Insights and Forecast - by Print Process
- 8. Europe Print Label Market Analysis, Insights and Forecast, 2020-2032
- 8.1. Market Analysis, Insights and Forecast - by Print Process
- 8.1.1. Offset lithography
- 8.1.2. Gravure
- 8.1.3. Flexography
- 8.1.4. Screen
- 8.1.5. Letterpress
- 8.1.6. Electrophotography
- 8.1.7. Inkjet
- 8.2. Market Analysis, Insights and Forecast - by Label Format
- 8.2.1. Wet-glue labels
- 8.2.2. Pressure-sensitive labels
- 8.2.3. Linerless labels
- 8.2.4. Multi-part tracking labels
- 8.2.5. In-mold labels
- 8.2.6. Shrink and Stretch Sleeves
- 8.3. Market Analysis, Insights and Forecast - by End-user Industries
- 8.3.1. Food
- 8.3.2. Beverage
- 8.3.3. Healthcare
- 8.3.4. Cosmetics
- 8.3.5. Household
- 8.3.6. Industri
- 8.3.7. Logistics
- 8.3.8. Other End-user Industries
- 8.1. Market Analysis, Insights and Forecast - by Print Process
- 9. Asia Pacific Print Label Market Analysis, Insights and Forecast, 2020-2032
- 9.1. Market Analysis, Insights and Forecast - by Print Process
- 9.1.1. Offset lithography
- 9.1.2. Gravure
- 9.1.3. Flexography
- 9.1.4. Screen
- 9.1.5. Letterpress
- 9.1.6. Electrophotography
- 9.1.7. Inkjet
- 9.2. Market Analysis, Insights and Forecast - by Label Format
- 9.2.1. Wet-glue labels
- 9.2.2. Pressure-sensitive labels
- 9.2.3. Linerless labels
- 9.2.4. Multi-part tracking labels
- 9.2.5. In-mold labels
- 9.2.6. Shrink and Stretch Sleeves
- 9.3. Market Analysis, Insights and Forecast - by End-user Industries
- 9.3.1. Food
- 9.3.2. Beverage
- 9.3.3. Healthcare
- 9.3.4. Cosmetics
- 9.3.5. Household
- 9.3.6. Industri
- 9.3.7. Logistics
- 9.3.8. Other End-user Industries
- 9.1. Market Analysis, Insights and Forecast - by Print Process
- 10. Latin America Print Label Market Analysis, Insights and Forecast, 2020-2032
- 10.1. Market Analysis, Insights and Forecast - by Print Process
- 10.1.1. Offset lithography
- 10.1.2. Gravure
- 10.1.3. Flexography
- 10.1.4. Screen
- 10.1.5. Letterpress
- 10.1.6. Electrophotography
- 10.1.7. Inkjet
- 10.2. Market Analysis, Insights and Forecast - by Label Format
- 10.2.1. Wet-glue labels
- 10.2.2. Pressure-sensitive labels
- 10.2.3. Linerless labels
- 10.2.4. Multi-part tracking labels
- 10.2.5. In-mold labels
- 10.2.6. Shrink and Stretch Sleeves
- 10.3. Market Analysis, Insights and Forecast - by End-user Industries
- 10.3.1. Food
- 10.3.2. Beverage
- 10.3.3. Healthcare
- 10.3.4. Cosmetics
- 10.3.5. Household
- 10.3.6. Industri
- 10.3.7. Logistics
- 10.3.8. Other End-user Industries
- 10.1. Market Analysis, Insights and Forecast - by Print Process
- 11. Middle East and Africa Print Label Market Analysis, Insights and Forecast, 2020-2032
- 11.1. Market Analysis, Insights and Forecast - by Print Process
- 11.1.1. Offset lithography
- 11.1.2. Gravure
- 11.1.3. Flexography
- 11.1.4. Screen
- 11.1.5. Letterpress
- 11.1.6. Electrophotography
- 11.1.7. Inkjet
- 11.2. Market Analysis, Insights and Forecast - by Label Format
- 11.2.1. Wet-glue labels
- 11.2.2. Pressure-sensitive labels
- 11.2.3. Linerless labels
- 11.2.4. Multi-part tracking labels
- 11.2.5. In-mold labels
- 11.2.6. Shrink and Stretch Sleeves
- 11.3. Market Analysis, Insights and Forecast - by End-user Industries
- 11.3.1. Food
- 11.3.2. Beverage
- 11.3.3. Healthcare
- 11.3.4. Cosmetics
- 11.3.5. Household
- 11.3.6. Industri
- 11.3.7. Logistics
- 11.3.8. Other End-user Industries
- 11.1. Market Analysis, Insights and Forecast - by Print Process
- 12. Competitive Analysis
- 12.1. Company Profiles
- 12.1.1 Taghleef Industries Inc
- 12.1.1.1. Company Overview
- 12.1.1.2. Products
- 12.1.1.3. Company Financials
- 12.1.1.4. SWOT Analysis
- 12.1.2 Autajon Group
- 12.1.2.1. Company Overview
- 12.1.2.2. Products
- 12.1.2.3. Company Financials
- 12.1.2.4. SWOT Analysis
- 12.1.3 Neenah Inc *List Not Exhaustive
- 12.1.3.1. Company Overview
- 12.1.3.2. Products
- 12.1.3.3. Company Financials
- 12.1.3.4. SWOT Analysis
- 12.1.4 R R Donnelley & Sons Company
- 12.1.4.1. Company Overview
- 12.1.4.2. Products
- 12.1.4.3. Company Financials
- 12.1.4.4. SWOT Analysis
- 12.1.5 Fort Dearborn Company
- 12.1.5.1. Company Overview
- 12.1.5.2. Products
- 12.1.5.3. Company Financials
- 12.1.5.4. SWOT Analysis
- 12.1.6 Ahlstrom-Munksjo Oyj
- 12.1.6.1. Company Overview
- 12.1.6.2. Products
- 12.1.6.3. Company Financials
- 12.1.6.4. SWOT Analysis
- 12.1.7 Constantia Flexibles Group GmbH
- 12.1.7.1. Company Overview
- 12.1.7.2. Products
- 12.1.7.3. Company Financials
- 12.1.7.4. SWOT Analysis
- 12.1.8 Multi Packaging Solutions (WestRock Company)
- 12.1.8.1. Company Overview
- 12.1.8.2. Products
- 12.1.8.3. Company Financials
- 12.1.8.4. SWOT Analysis
- 12.1.9 Coveris
- 12.1.9.1. Company Overview
- 12.1.9.2. Products
- 12.1.9.3. Company Financials
- 12.1.9.4. SWOT Analysis
- 12.1.10 Epac holdings LLC
- 12.1.10.1. Company Overview
- 12.1.10.2. Products
- 12.1.10.3. Company Financials
- 12.1.10.4. SWOT Analysis
- 12.1.11 CCL Industries
- 12.1.11.1. Company Overview
- 12.1.11.2. Products
- 12.1.11.3. Company Financials
- 12.1.11.4. SWOT Analysis
- 12.1.12 Taylor Corporation
- 12.1.12.1. Company Overview
- 12.1.12.2. Products
- 12.1.12.3. Company Financials
- 12.1.12.4. SWOT Analysis
- 12.1.13 3M Company
- 12.1.13.1. Company Overview
- 12.1.13.2. Products
- 12.1.13.3. Company Financials
- 12.1.13.4. SWOT Analysis
- 12.1.14 Cenveo Corporation
- 12.1.14.1. Company Overview
- 12.1.14.2. Products
- 12.1.14.3. Company Financials
- 12.1.14.4. SWOT Analysis
- 12.1.15 Mondi Group
- 12.1.15.1. Company Overview
- 12.1.15.2. Products
- 12.1.15.3. Company Financials
- 12.1.15.4. SWOT Analysis
- 12.1.16 Ravenwood Packaging
- 12.1.16.1. Company Overview
- 12.1.16.2. Products
- 12.1.16.3. Company Financials
- 12.1.16.4. SWOT Analysis
- 12.1.17 Multi-Color Corporation
- 12.1.17.1. Company Overview
- 12.1.17.2. Products
- 12.1.17.3. Company Financials
- 12.1.17.4. SWOT Analysis
- 12.1.18 Clondalkin Group
- 12.1.18.1. Company Overview
- 12.1.18.2. Products
- 12.1.18.3. Company Financials
- 12.1.18.4. SWOT Analysis
- 12.1.19 Avery Dennison Corporation
- 12.1.19.1. Company Overview
- 12.1.19.2. Products
- 12.1.19.3. Company Financials
- 12.1.19.4. SWOT Analysis
- 12.1.20 Fuji Seal International Inc
- 12.1.20.1. Company Overview
- 12.1.20.2. Products
- 12.1.20.3. Company Financials
- 12.1.20.4. SWOT Analysis
- 12.1.21 Huhtamaki OYJ
- 12.1.21.1. Company Overview
- 12.1.21.2. Products
- 12.1.21.3. Company Financials
- 12.1.21.4. SWOT Analysis
- 12.1.22 Brady Corporation
- 12.1.22.1. Company Overview
- 12.1.22.2. Products
- 12.1.22.3. Company Financials
- 12.1.22.4. SWOT Analysis
- 12.1.23 Sato America
- 12.1.23.1. Company Overview
- 12.1.23.2. Products
- 12.1.23.3. Company Financials
- 12.1.23.4. SWOT Analysis
- 12.1.24 Fedrigoni Self-Adhesives (Fedrigoni Group)
- 12.1.24.1. Company Overview
- 12.1.24.2. Products
- 12.1.24.3. Company Financials
- 12.1.24.4. SWOT Analysis
- 12.1.1 Taghleef Industries Inc
- 12.2. Market Entropy
- 12.2.1 Company's Key Areas Served
- 12.2.2 Recent Developments
- 12.3. Company Market Share Analysis 2025
- 12.3.1 Top 5 Companies Market Share Analysis
- 12.3.2 Top 3 Companies Market Share Analysis
- 12.4. List of Potential Customers
- 13. Research Methodology
List of Figures
- Figure 1: Global Print Label Market Revenue Breakdown (Million, %) by Region 2025 & 2033
- Figure 2: North America Print Label Market Revenue (Million), by Print Process 2025 & 2033
- Figure 3: North America Print Label Market Revenue Share (%), by Print Process 2025 & 2033
- Figure 4: North America Print Label Market Revenue (Million), by Label Format 2025 & 2033
- Figure 5: North America Print Label Market Revenue Share (%), by Label Format 2025 & 2033
- Figure 6: North America Print Label Market Revenue (Million), by End-user Industries 2025 & 2033
- Figure 7: North America Print Label Market Revenue Share (%), by End-user Industries 2025 & 2033
- Figure 8: North America Print Label Market Revenue (Million), by Country 2025 & 2033
- Figure 9: North America Print Label Market Revenue Share (%), by Country 2025 & 2033
- Figure 10: Europe Print Label Market Revenue (Million), by Print Process 2025 & 2033
- Figure 11: Europe Print Label Market Revenue Share (%), by Print Process 2025 & 2033
- Figure 12: Europe Print Label Market Revenue (Million), by Label Format 2025 & 2033
- Figure 13: Europe Print Label Market Revenue Share (%), by Label Format 2025 & 2033
- Figure 14: Europe Print Label Market Revenue (Million), by End-user Industries 2025 & 2033
- Figure 15: Europe Print Label Market Revenue Share (%), by End-user Industries 2025 & 2033
- Figure 16: Europe Print Label Market Revenue (Million), by Country 2025 & 2033
- Figure 17: Europe Print Label Market Revenue Share (%), by Country 2025 & 2033
- Figure 18: Asia Pacific Print Label Market Revenue (Million), by Print Process 2025 & 2033
- Figure 19: Asia Pacific Print Label Market Revenue Share (%), by Print Process 2025 & 2033
- Figure 20: Asia Pacific Print Label Market Revenue (Million), by Label Format 2025 & 2033
- Figure 21: Asia Pacific Print Label Market Revenue Share (%), by Label Format 2025 & 2033
- Figure 22: Asia Pacific Print Label Market Revenue (Million), by End-user Industries 2025 & 2033
- Figure 23: Asia Pacific Print Label Market Revenue Share (%), by End-user Industries 2025 & 2033
- Figure 24: Asia Pacific Print Label Market Revenue (Million), by Country 2025 & 2033
- Figure 25: Asia Pacific Print Label Market Revenue Share (%), by Country 2025 & 2033
- Figure 26: Latin America Print Label Market Revenue (Million), by Print Process 2025 & 2033
- Figure 27: Latin America Print Label Market Revenue Share (%), by Print Process 2025 & 2033
- Figure 28: Latin America Print Label Market Revenue (Million), by Label Format 2025 & 2033
- Figure 29: Latin America Print Label Market Revenue Share (%), by Label Format 2025 & 2033
- Figure 30: Latin America Print Label Market Revenue (Million), by End-user Industries 2025 & 2033
- Figure 31: Latin America Print Label Market Revenue Share (%), by End-user Industries 2025 & 2033
- Figure 32: Latin America Print Label Market Revenue (Million), by Country 2025 & 2033
- Figure 33: Latin America Print Label Market Revenue Share (%), by Country 2025 & 2033
- Figure 34: Middle East and Africa Print Label Market Revenue (Million), by Print Process 2025 & 2033
- Figure 35: Middle East and Africa Print Label Market Revenue Share (%), by Print Process 2025 & 2033
- Figure 36: Middle East and Africa Print Label Market Revenue (Million), by Label Format 2025 & 2033
- Figure 37: Middle East and Africa Print Label Market Revenue Share (%), by Label Format 2025 & 2033
- Figure 38: Middle East and Africa Print Label Market Revenue (Million), by End-user Industries 2025 & 2033
- Figure 39: Middle East and Africa Print Label Market Revenue Share (%), by End-user Industries 2025 & 2033
- Figure 40: Middle East and Africa Print Label Market Revenue (Million), by Country 2025 & 2033
- Figure 41: Middle East and Africa Print Label Market Revenue Share (%), by Country 2025 & 2033
List of Tables
- Table 1: Global Print Label Market Revenue Million Forecast, by Print Process 2020 & 2033
- Table 2: Global Print Label Market Revenue Million Forecast, by Label Format 2020 & 2033
- Table 3: Global Print Label Market Revenue Million Forecast, by End-user Industries 2020 & 2033
- Table 4: Global Print Label Market Revenue Million Forecast, by Region 2020 & 2033
- Table 5: Global Print Label Market Revenue Million Forecast, by Print Process 2020 & 2033
- Table 6: Global Print Label Market Revenue Million Forecast, by Label Format 2020 & 2033
- Table 7: Global Print Label Market Revenue Million Forecast, by End-user Industries 2020 & 2033
- Table 8: Global Print Label Market Revenue Million Forecast, by Country 2020 & 2033
- Table 9: United States Print Label Market Revenue (Million) Forecast, by Application 2020 & 2033
- Table 10: Canada Print Label Market Revenue (Million) Forecast, by Application 2020 & 2033
- Table 11: Global Print Label Market Revenue Million Forecast, by Print Process 2020 & 2033
- Table 12: Global Print Label Market Revenue Million Forecast, by Label Format 2020 & 2033
- Table 13: Global Print Label Market Revenue Million Forecast, by End-user Industries 2020 & 2033
- Table 14: Global Print Label Market Revenue Million Forecast, by Country 2020 & 2033
- Table 15: United Kingdom Print Label Market Revenue (Million) Forecast, by Application 2020 & 2033
- Table 16: Germany Print Label Market Revenue (Million) Forecast, by Application 2020 & 2033
- Table 17: France Print Label Market Revenue (Million) Forecast, by Application 2020 & 2033
- Table 18: Spain Print Label Market Revenue (Million) Forecast, by Application 2020 & 2033
- Table 19: Italy Print Label Market Revenue (Million) Forecast, by Application 2020 & 2033
- Table 20: Poland Print Label Market Revenue (Million) Forecast, by Application 2020 & 2033
- Table 21: Netherlands Print Label Market Revenue (Million) Forecast, by Application 2020 & 2033
- Table 22: Rest of Europe Print Label Market Revenue (Million) Forecast, by Application 2020 & 2033
- Table 23: Global Print Label Market Revenue Million Forecast, by Print Process 2020 & 2033
- Table 24: Global Print Label Market Revenue Million Forecast, by Label Format 2020 & 2033
- Table 25: Global Print Label Market Revenue Million Forecast, by End-user Industries 2020 & 2033
- Table 26: Global Print Label Market Revenue Million Forecast, by Country 2020 & 2033
- Table 27: China Print Label Market Revenue (Million) Forecast, by Application 2020 & 2033
- Table 28: India Print Label Market Revenue (Million) Forecast, by Application 2020 & 2033
- Table 29: Japan Print Label Market Revenue (Million) Forecast, by Application 2020 & 2033
- Table 30: Australia Print Label Market Revenue (Million) Forecast, by Application 2020 & 2033
- Table 31: South Korea Print Label Market Revenue (Million) Forecast, by Application 2020 & 2033
- Table 32: Rest of Asia Pacific Print Label Market Revenue (Million) Forecast, by Application 2020 & 2033
- Table 33: Global Print Label Market Revenue Million Forecast, by Print Process 2020 & 2033
- Table 34: Global Print Label Market Revenue Million Forecast, by Label Format 2020 & 2033
- Table 35: Global Print Label Market Revenue Million Forecast, by End-user Industries 2020 & 2033
- Table 36: Global Print Label Market Revenue Million Forecast, by Country 2020 & 2033
- Table 37: Brazil Print Label Market Revenue (Million) Forecast, by Application 2020 & 2033
- Table 38: Mexico Print Label Market Revenue (Million) Forecast, by Application 2020 & 2033
- Table 39: Rest of Latin America Print Label Market Revenue (Million) Forecast, by Application 2020 & 2033
- Table 40: Global Print Label Market Revenue Million Forecast, by Print Process 2020 & 2033
- Table 41: Global Print Label Market Revenue Million Forecast, by Label Format 2020 & 2033
- Table 42: Global Print Label Market Revenue Million Forecast, by End-user Industries 2020 & 2033
- Table 43: Global Print Label Market Revenue Million Forecast, by Country 2020 & 2033
Frequently Asked Questions
1. What is the projected Compound Annual Growth Rate (CAGR) of the Print Label Market?
The projected CAGR is approximately 4.09%.
2. Which companies are prominent players in the Print Label Market?
Key companies in the market include Taghleef Industries Inc, Autajon Group, Neenah Inc *List Not Exhaustive, R R Donnelley & Sons Company, Fort Dearborn Company, Ahlstrom-Munksjo Oyj, Constantia Flexibles Group GmbH, Multi Packaging Solutions (WestRock Company), Coveris, Epac holdings LLC, CCL Industries, Taylor Corporation, 3M Company, Cenveo Corporation, Mondi Group, Ravenwood Packaging, Multi-Color Corporation, Clondalkin Group, Avery Dennison Corporation, Fuji Seal International Inc, Huhtamaki OYJ, Brady Corporation, Sato America, Fedrigoni Self-Adhesives (Fedrigoni Group).
3. What are the main segments of the Print Label Market?
The market segments include Print Process, Label Format, End-user Industries.
4. Can you provide details about the market size?
The market size is estimated to be USD 51.05 Million as of 2022.
5. What are some drivers contributing to market growth?
Evolution of Digital Print Technology; Increased Focus toward Manufacturing in the Developing Economies.
6. What are the notable trends driving market growth?
Food Industry to Create Significant Demand During Forecast Period.
7. Are there any restraints impacting market growth?
; Performance Issues with Bio-based Materials; High Cost of Bio-packaging Materials.
8. Can you provide examples of recent developments in the market?
May 2022 - Mondi has switched its entire portfolio of glassine-based release liners to the certified base paper. The modification results from Mondi's continued proactive dedication to sustainability, which includes creating environmentally friendly solutions. Labels, tapes, and medicinal applications are the principal uses for glassine-based release liners.
9. What pricing options are available for accessing the report?
Pricing options include single-user, multi-user, and enterprise licenses priced at USD 4750, USD 5250, and USD 8750 respectively.
10. Is the market size provided in terms of value or volume?
The market size is provided in terms of value, measured in Million.
11. Are there any specific market keywords associated with the report?
Yes, the market keyword associated with the report is "Print Label Market," which aids in identifying and referencing the specific market segment covered.
12. How do I determine which pricing option suits my needs best?
The pricing options vary based on user requirements and access needs. Individual users may opt for single-user licenses, while businesses requiring broader access may choose multi-user or enterprise licenses for cost-effective access to the report.
13. Are there any additional resources or data provided in the Print Label Market report?
While the report offers comprehensive insights, it's advisable to review the specific contents or supplementary materials provided to ascertain if additional resources or data are available.
14. How can I stay updated on further developments or reports in the Print Label Market?
To stay informed about further developments, trends, and reports in the Print Label Market, consider subscribing to industry newsletters, following relevant companies and organizations, or regularly checking reputable industry news sources and publications.
Methodology
Step 1 - Identification of Relevant Samples Size from Population Database


Step 2 - Approaches for Defining Global Market Size (Value, Volume* & Price*)

Note*: In applicable scenarios
Step 3 - Data Sources
Primary Research
- Web Analytics
- Survey Reports
- Research Institute
- Latest Research Reports
- Opinion Leaders
Secondary Research
- Annual Reports
- White Paper
- Latest Press Release
- Industry Association
- Paid Database
- Investor Presentations

Step 4 - Data Triangulation
Involves using different sources of information in order to increase the validity of a study
These sources are likely to be stakeholders in a program - participants, other researchers, program staff, other community members, and so on.
Then we put all data in single framework & apply various statistical tools to find out the dynamic on the market.
During the analysis stage, feedback from the stakeholder groups would be compared to determine areas of agreement as well as areas of divergence