

Key Insights
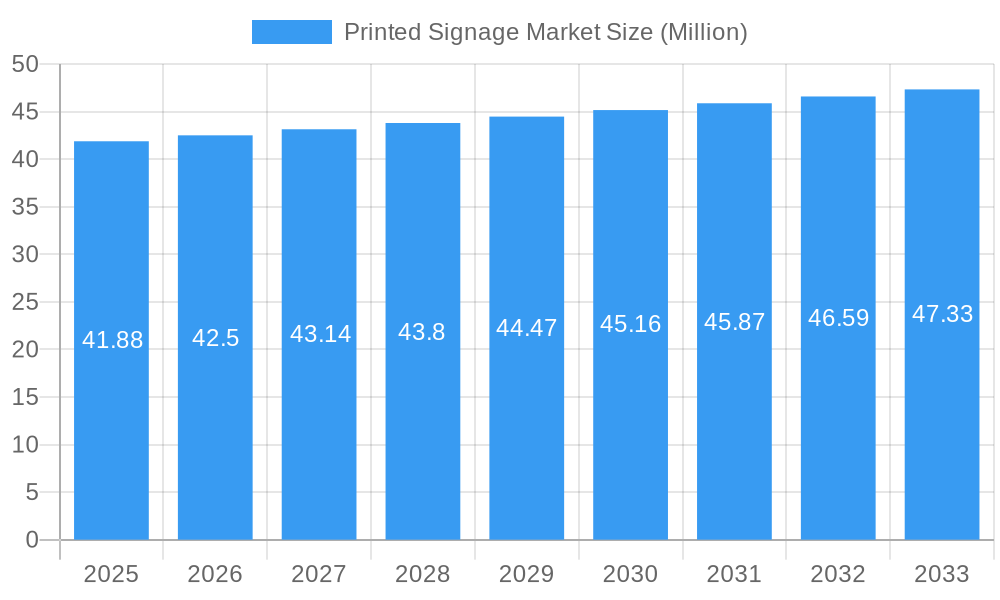
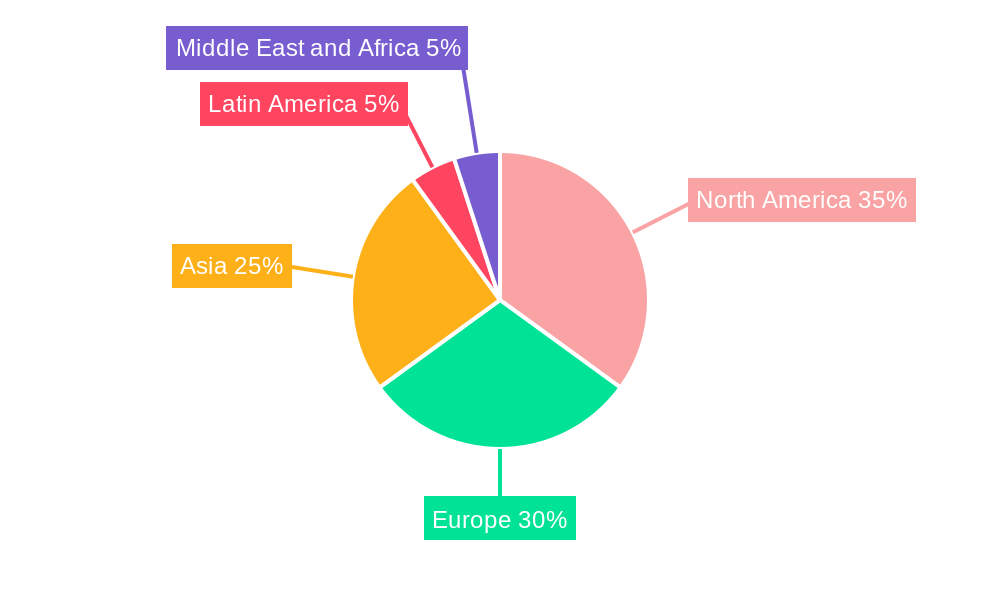
The global printed signage market, valued at $41.88 million in 2025, is projected to experience steady growth, driven by the increasing need for impactful brand communication across diverse sectors. The market's Compound Annual Growth Rate (CAGR) of 1.56% from 2019 to 2024 indicates a consistent demand for printed signage solutions. Key drivers include the expanding retail and BFSI sectors, the rise of experiential marketing initiatives, and the continued relevance of outdoor advertising. Growth is further fueled by advancements in print technology, offering higher resolution, vibrant colors, and durable materials, particularly in inkjet and screen printing segments. While the market faces some restraints, such as the rising popularity of digital signage and the fluctuating costs of raw materials, these challenges are likely to be offset by the persistent demand for tangible branding and promotional tools in established and emerging markets. The segmentation by type (banners, backdrops, billboards, pop displays etc.), print technology (screen, inkjet, sheetfed), end-user vertical (retail, BFSI, healthcare etc.), and application (indoor/outdoor) provides diverse opportunities for market players. The geographical distribution highlights strong presence in North America and Europe, with Asia-Pacific showing significant growth potential due to expanding economies and increasing urbanization.
Printed Signage Market Market Size (In Million)
The competitive landscape is marked by established players such as Spandex Ltd, Avery Dennison Corporation, and 3A Composites Holding AG, alongside regional players catering to specific market needs. Future growth will depend on innovative product development, strategic partnerships, and effective adaptation to changing consumer preferences. Focus on sustainable and eco-friendly printing solutions is also expected to become increasingly important. The market is anticipated to show a gradual expansion over the forecast period (2025-2033), with consistent demand from existing sectors and potential inroads into new markets. Continued innovation in materials and printing techniques, alongside targeted marketing strategies, will be critical for achieving sustained growth in the years to come.
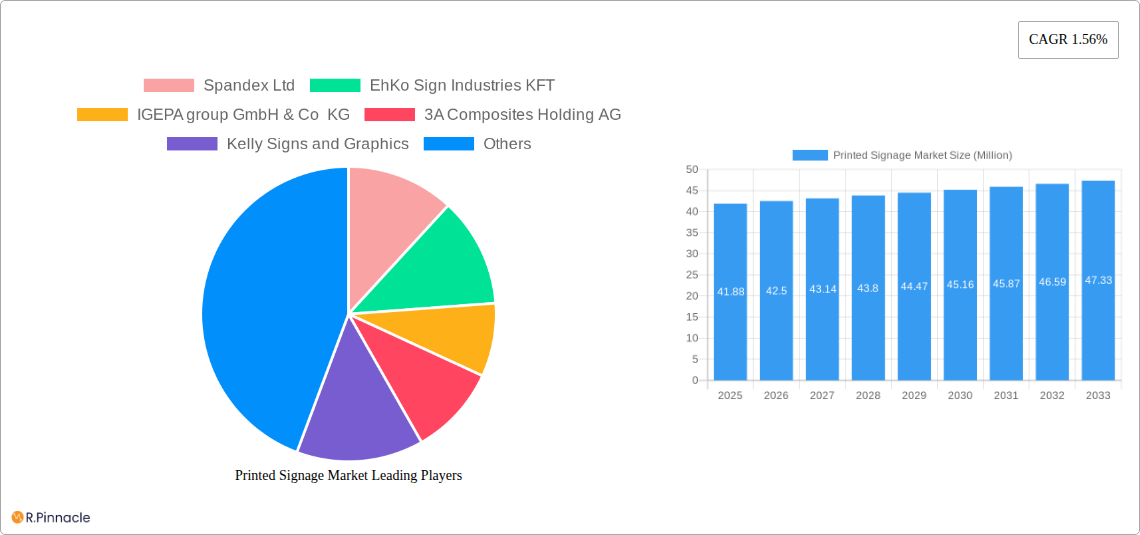
Printed Signage Market Company Market Share
Printed Signage Market: A Comprehensive Report (2019-2033)
This in-depth report provides a comprehensive analysis of the Printed Signage Market, offering valuable insights for industry professionals, investors, and strategic decision-makers. The study period covers 2019-2033, with 2025 as the base and estimated year. We project robust growth, driven by technological advancements and evolving consumer preferences. The report meticulously segments the market by type, print technology, end-user vertical, and application, providing granular data for informed strategic planning. Expect detailed analysis of leading players such as Spandex Ltd, EhKo Sign Industries KFT, and Avery Dennison Corporation, among others. This report is your key to unlocking the potential of the Printed Signage Market.
Printed Signage Market Structure & Innovation Trends
The Printed Signage Market exhibits a moderately concentrated structure, with a few major players holding significant market share. Spandex Ltd, Avery Dennison Corporation, and IGEPA group GmbH & Co KG are among the leading companies, collectively controlling an estimated xx% of the market in 2025. However, several smaller regional players and specialized firms contribute to a dynamic and competitive landscape.
Innovation Drivers:
- Technological advancements in printing technologies (e.g., inkjet, screen printing) are key drivers, enabling higher quality, faster turnaround times, and cost-effectiveness.
- Growing demand for visually appealing and impactful signage across various sectors fuels innovation in design and materials.
- Sustainability concerns are driving the adoption of eco-friendly printing inks and materials.
Regulatory Frameworks:
Regulatory compliance varies across regions, impacting material choices and printing practices. Environmental regulations are influencing the shift towards sustainable materials.
Product Substitutes:
Digital signage and other forms of visual communication are emerging as substitutes, although printed signage retains its importance for certain applications.
End-User Demographics:
Market demand is diverse, driven by businesses across BFSI, retail, transportation, healthcare, and more, each sector exhibiting unique needs and preferences.
M&A Activities:
Recent M&A activities, including the acquisition of Regal Signs & Designs by Kuhn Corp (February 2024) and Advertising Arts by Panther Premier Print Solutions (December 2023), indicate consolidation and strategic growth within the sector. The total value of these deals is estimated at xx Million. These acquisitions suggest a trend towards broader service offerings and increased market reach.
Printed Signage Market Dynamics & Trends
The Printed Signage Market is poised for significant growth, with a projected CAGR of xx% from 2025 to 2033. This growth is driven by several factors:
- The increasing importance of brand visibility and marketing efforts across diverse sectors, driving demand for high-quality signage.
- Technological advancements such as high-resolution printing and eco-friendly inks, enhancing the quality and sustainability of printed signage.
- The growing adoption of digital printing technologies, allowing for customization and cost-effectiveness.
- Expansion into new applications, such as interactive displays and augmented reality signage.
- The increasing demand for outdoor advertising, particularly in developing economies.
Market penetration rates vary across different segments and regions. The penetration of digital printing technologies is expected to increase significantly in the forecast period. The competitive landscape is becoming more intense as new entrants and technology providers emerge. This necessitates continuous innovation and adaptation for established players.
Dominant Regions & Segments in Printed Signage Market
Leading Regions:
North America and Europe currently hold significant market share, driven by established businesses, robust infrastructure, and high demand. However, the Asia-Pacific region is witnessing rapid growth, fueled by increasing urbanization and economic development.
Dominant Segments:
- By Type: Banner and backdrops dominate due to widespread usage in advertising and events.
- By Print Technology: Inkjet printing is gaining traction due to its versatility and cost-effectiveness.
- By End-user Vertical: Retail holds a significant share, with signage being crucial for visual merchandising and branding.
- By Application: Outdoor signage dominates due to high visibility and broad reach.
Key Drivers (by Region):
- North America: Strong economic growth, established marketing practices, and high adoption of advanced technologies.
- Europe: Similar to North America, with a focus on sustainability and regulatory compliance.
- Asia-Pacific: Rapid urbanization, increasing disposable incomes, and growing marketing investment.
Printed Signage Market Product Innovations
Recent innovations focus on eco-friendly materials, enhanced durability, and integration of technology. The launch of Brother UK's MFC-J6959DW multifunction printer (July 2023) signifies a shift towards in-house signage production for businesses. This allows for greater customization and cost control. Further innovation centers on developing sustainable and recyclable materials, improving the environmental profile of the industry.
Report Scope & Segmentation Analysis
This report provides a detailed analysis of the Printed Signage Market segmented by:
By Type: Banner and Backdrop, Corporate Graphics, Exhibitions and Trade Shows, Backlit Displays, Pop Display, Billboards. Each type exhibits different growth rates, with banner and backdrops currently dominating.
By Print Technology: Screen, Inkjet, Sheetfed. Inkjet is rapidly growing due to its flexibility and cost-effectiveness.
By End-user Vertical: BFSI, Retail, Transportation and Logistics, Healthcare. The retail sector currently commands the largest market share.
By Application: Indoor, Outdoor. Outdoor signage benefits from high visibility but faces challenges related to weather resistance.
Each segment’s growth projection, market size, and competitive landscape are analyzed in detail.
Key Drivers of Printed Signage Market Growth
The market's growth is propelled by several factors:
- The rise of digital printing, offering customization and cost-efficiency.
- Increased focus on branding and marketing across industries.
- Demand for eye-catching signage in retail and commercial spaces.
- Government regulations driving the adoption of eco-friendly materials.
Challenges in the Printed Signage Market Sector
The industry faces challenges such as:
- Competition from digital signage and other alternative media.
- Fluctuations in raw material costs impacting profitability.
- Environmental regulations requiring the use of sustainable materials.
- Economic downturns can significantly impact marketing budgets.
Emerging Opportunities in Printed Signage Market
Key opportunities include:
- Growth in emerging markets, especially in Asia-Pacific.
- Adoption of innovative printing technologies, such as 3D printing.
- Focus on sustainable and eco-friendly solutions.
- Increased use of interactive signage and digital integration.
Leading Players in the Printed Signage Market Market
- Spandex Ltd
- EhKo Sign Industries KFT
- IGEPA group GmbH & Co KG
- 3A Composites Holding AG
- Kelly Signs and Graphics
- L&H Sign Company Inc
- Mactac LLLC (Lintec)
- Lintec Corporation
- Identity Group
- Avery Dennison Corporation
- Orafol Europe GmbH
- Signs Express
Key Developments in Printed Signage Market Industry
- February 2024: Kuhn Corp's acquisition of Regal Signs & Designs strengthens its market position.
- December 2023: Panther Premier Print Solutions acquires Advertising Arts, expanding its service portfolio.
- July 2023: Brother UK launches a new multifunction printer, enabling businesses to produce high-quality signage in-house.
Future Outlook for Printed Signage Market Market
The Printed Signage Market is expected to experience sustained growth, driven by technological advancements, increasing marketing budgets, and the growing importance of visual communication. Strategic partnerships, investments in R&D, and expansion into new markets will be key factors for success in this dynamic sector. The adoption of sustainable and innovative materials will further shape the market's future.
Printed Signage Market Segmentation
-
1. Type
- 1.1. Banner and Backdrop
- 1.2. Corporate Graphics, Exhibitions, and Trade Shows
- 1.3. Backlit Displays
- 1.4. Pop Display
- 1.5. Billboards
-
2. Print Technology
- 2.1. Screen
- 2.2. Inkjet
- 2.3. Sheetfed
-
3. End-user Vertical
- 3.1. BFSI
- 3.2. Retail
- 3.3. Transportation and Logistics
- 3.4. Healthcare
-
4. Application
- 4.1. Indoor
- 4.2. Outdoor
Printed Signage Market Segmentation By Geography
-
1. North America
- 1.1. United States
- 1.2. Canada
-
2. Europe
- 2.1. Germany
- 2.2. United Kingdom
- 2.3. France
- 2.4. Italy
-
3. Asia
- 3.1. China
- 3.2. India
- 3.3. Japan
- 3.4. South Korea
- 3.5. Thailand
- 3.6. Australia and New Zealand
-
4. Latin America
- 4.1. Brazil
- 4.2. Mexico
-
5. Middle East and Africa
- 5.1. United Arab Emirates
- 5.2. Saudi Arabia
- 5.3. South Africa
Printed Signage Market Regional Market Share
Geographic Coverage of Printed Signage Market
Printed Signage Market REPORT HIGHLIGHTS
| Aspects | Details |
|---|---|
| Study Period | 2020-2034 |
| Base Year | 2025 |
| Estimated Year | 2026 |
| Forecast Period | 2026-2034 |
| Historical Period | 2020-2025 |
| Growth Rate | CAGR of 1.56% from 2020-2034 |
| Segmentation |
|
Table of Contents
- 1. Introduction
- 1.1. Research Scope
- 1.2. Market Segmentation
- 1.3. Research Objective
- 1.4. Definitions and Assumptions
- 2. Executive Summary
- 2.1. Market Snapshot
- 3. Market Dynamics
- 3.1. Market Drivers
- 3.2. Market Restrains
- 3.3. Market Trends
- 3.4. Market Opportunities
- 4. Market Factor Analysis
- 4.1. Porters Five Forces
- 4.1.1. Bargaining Power of Suppliers
- 4.1.2. Bargaining Power of Buyers
- 4.1.3. Threat of New Entrants
- 4.1.4. Threat of Substitutes
- 4.1.5. Competitive Rivalry
- 4.2. PESTEL analysis
- 4.3. BCG Analysis
- 4.3.1. Stars (High Growth, High Market Share)
- 4.3.2. Cash Cows (Low Growth, High Market Share)
- 4.3.3. Question Mark (High Growth, Low Market Share)
- 4.3.4. Dogs (Low Growth, Low Market Share)
- 4.4. Ansoff Matrix Analysis
- 4.5. Supply Chain Analysis
- 4.6. Regulatory Landscape
- 4.7. Current Market Potential and Opportunity Assessment (TAM–SAM–SOM Framework)
- 4.8. PRI Analyst Note
- 4.1. Porters Five Forces
- 5. Market Analysis, Insights and Forecast 2021-2033
- 5.1. Market Analysis, Insights and Forecast - by Type
- 5.1.1. Banner and Backdrop
- 5.1.2. Corporate Graphics, Exhibitions, and Trade Shows
- 5.1.3. Backlit Displays
- 5.1.4. Pop Display
- 5.1.5. Billboards
- 5.2. Market Analysis, Insights and Forecast - by Print Technology
- 5.2.1. Screen
- 5.2.2. Inkjet
- 5.2.3. Sheetfed
- 5.3. Market Analysis, Insights and Forecast - by End-user Vertical
- 5.3.1. BFSI
- 5.3.2. Retail
- 5.3.3. Transportation and Logistics
- 5.3.4. Healthcare
- 5.4. Market Analysis, Insights and Forecast - by Application
- 5.4.1. Indoor
- 5.4.2. Outdoor
- 5.5. Market Analysis, Insights and Forecast - by Region
- 5.5.1. North America
- 5.5.2. Europe
- 5.5.3. Asia
- 5.5.4. Latin America
- 5.5.5. Middle East and Africa
- 5.1. Market Analysis, Insights and Forecast - by Type
- 6. Global Printed Signage Market Analysis, Insights and Forecast, 2021-2033
- 6.1. Market Analysis, Insights and Forecast - by Type
- 6.1.1. Banner and Backdrop
- 6.1.2. Corporate Graphics, Exhibitions, and Trade Shows
- 6.1.3. Backlit Displays
- 6.1.4. Pop Display
- 6.1.5. Billboards
- 6.2. Market Analysis, Insights and Forecast - by Print Technology
- 6.2.1. Screen
- 6.2.2. Inkjet
- 6.2.3. Sheetfed
- 6.3. Market Analysis, Insights and Forecast - by End-user Vertical
- 6.3.1. BFSI
- 6.3.2. Retail
- 6.3.3. Transportation and Logistics
- 6.3.4. Healthcare
- 6.4. Market Analysis, Insights and Forecast - by Application
- 6.4.1. Indoor
- 6.4.2. Outdoor
- 6.1. Market Analysis, Insights and Forecast - by Type
- 7. North America Printed Signage Market Analysis, Insights and Forecast, 2020-2032
- 7.1. Market Analysis, Insights and Forecast - by Type
- 7.1.1. Banner and Backdrop
- 7.1.2. Corporate Graphics, Exhibitions, and Trade Shows
- 7.1.3. Backlit Displays
- 7.1.4. Pop Display
- 7.1.5. Billboards
- 7.2. Market Analysis, Insights and Forecast - by Print Technology
- 7.2.1. Screen
- 7.2.2. Inkjet
- 7.2.3. Sheetfed
- 7.3. Market Analysis, Insights and Forecast - by End-user Vertical
- 7.3.1. BFSI
- 7.3.2. Retail
- 7.3.3. Transportation and Logistics
- 7.3.4. Healthcare
- 7.4. Market Analysis, Insights and Forecast - by Application
- 7.4.1. Indoor
- 7.4.2. Outdoor
- 7.1. Market Analysis, Insights and Forecast - by Type
- 8. Europe Printed Signage Market Analysis, Insights and Forecast, 2020-2032
- 8.1. Market Analysis, Insights and Forecast - by Type
- 8.1.1. Banner and Backdrop
- 8.1.2. Corporate Graphics, Exhibitions, and Trade Shows
- 8.1.3. Backlit Displays
- 8.1.4. Pop Display
- 8.1.5. Billboards
- 8.2. Market Analysis, Insights and Forecast - by Print Technology
- 8.2.1. Screen
- 8.2.2. Inkjet
- 8.2.3. Sheetfed
- 8.3. Market Analysis, Insights and Forecast - by End-user Vertical
- 8.3.1. BFSI
- 8.3.2. Retail
- 8.3.3. Transportation and Logistics
- 8.3.4. Healthcare
- 8.4. Market Analysis, Insights and Forecast - by Application
- 8.4.1. Indoor
- 8.4.2. Outdoor
- 8.1. Market Analysis, Insights and Forecast - by Type
- 9. Asia Printed Signage Market Analysis, Insights and Forecast, 2020-2032
- 9.1. Market Analysis, Insights and Forecast - by Type
- 9.1.1. Banner and Backdrop
- 9.1.2. Corporate Graphics, Exhibitions, and Trade Shows
- 9.1.3. Backlit Displays
- 9.1.4. Pop Display
- 9.1.5. Billboards
- 9.2. Market Analysis, Insights and Forecast - by Print Technology
- 9.2.1. Screen
- 9.2.2. Inkjet
- 9.2.3. Sheetfed
- 9.3. Market Analysis, Insights and Forecast - by End-user Vertical
- 9.3.1. BFSI
- 9.3.2. Retail
- 9.3.3. Transportation and Logistics
- 9.3.4. Healthcare
- 9.4. Market Analysis, Insights and Forecast - by Application
- 9.4.1. Indoor
- 9.4.2. Outdoor
- 9.1. Market Analysis, Insights and Forecast - by Type
- 10. Latin America Printed Signage Market Analysis, Insights and Forecast, 2020-2032
- 10.1. Market Analysis, Insights and Forecast - by Type
- 10.1.1. Banner and Backdrop
- 10.1.2. Corporate Graphics, Exhibitions, and Trade Shows
- 10.1.3. Backlit Displays
- 10.1.4. Pop Display
- 10.1.5. Billboards
- 10.2. Market Analysis, Insights and Forecast - by Print Technology
- 10.2.1. Screen
- 10.2.2. Inkjet
- 10.2.3. Sheetfed
- 10.3. Market Analysis, Insights and Forecast - by End-user Vertical
- 10.3.1. BFSI
- 10.3.2. Retail
- 10.3.3. Transportation and Logistics
- 10.3.4. Healthcare
- 10.4. Market Analysis, Insights and Forecast - by Application
- 10.4.1. Indoor
- 10.4.2. Outdoor
- 10.1. Market Analysis, Insights and Forecast - by Type
- 11. Middle East and Africa Printed Signage Market Analysis, Insights and Forecast, 2020-2032
- 11.1. Market Analysis, Insights and Forecast - by Type
- 11.1.1. Banner and Backdrop
- 11.1.2. Corporate Graphics, Exhibitions, and Trade Shows
- 11.1.3. Backlit Displays
- 11.1.4. Pop Display
- 11.1.5. Billboards
- 11.2. Market Analysis, Insights and Forecast - by Print Technology
- 11.2.1. Screen
- 11.2.2. Inkjet
- 11.2.3. Sheetfed
- 11.3. Market Analysis, Insights and Forecast - by End-user Vertical
- 11.3.1. BFSI
- 11.3.2. Retail
- 11.3.3. Transportation and Logistics
- 11.3.4. Healthcare
- 11.4. Market Analysis, Insights and Forecast - by Application
- 11.4.1. Indoor
- 11.4.2. Outdoor
- 11.1. Market Analysis, Insights and Forecast - by Type
- 12. Competitive Analysis
- 12.1. Company Profiles
- 12.1.1 Spandex Ltd
- 12.1.1.1. Company Overview
- 12.1.1.2. Products
- 12.1.1.3. Company Financials
- 12.1.1.4. SWOT Analysis
- 12.1.2 EhKo Sign Industries KFT
- 12.1.2.1. Company Overview
- 12.1.2.2. Products
- 12.1.2.3. Company Financials
- 12.1.2.4. SWOT Analysis
- 12.1.3 IGEPA group GmbH & Co KG
- 12.1.3.1. Company Overview
- 12.1.3.2. Products
- 12.1.3.3. Company Financials
- 12.1.3.4. SWOT Analysis
- 12.1.4 3A Composites Holding AG
- 12.1.4.1. Company Overview
- 12.1.4.2. Products
- 12.1.4.3. Company Financials
- 12.1.4.4. SWOT Analysis
- 12.1.5 Kelly Signs and Graphics
- 12.1.5.1. Company Overview
- 12.1.5.2. Products
- 12.1.5.3. Company Financials
- 12.1.5.4. SWOT Analysis
- 12.1.6 L&H Sign Company Inc
- 12.1.6.1. Company Overview
- 12.1.6.2. Products
- 12.1.6.3. Company Financials
- 12.1.6.4. SWOT Analysis
- 12.1.7 Mactac LLLC (Lintec)
- 12.1.7.1. Company Overview
- 12.1.7.2. Products
- 12.1.7.3. Company Financials
- 12.1.7.4. SWOT Analysis
- 12.1.8 Lintec Corporation
- 12.1.8.1. Company Overview
- 12.1.8.2. Products
- 12.1.8.3. Company Financials
- 12.1.8.4. SWOT Analysis
- 12.1.9 Identity Group
- 12.1.9.1. Company Overview
- 12.1.9.2. Products
- 12.1.9.3. Company Financials
- 12.1.9.4. SWOT Analysis
- 12.1.10 Avery Dennison Corporation
- 12.1.10.1. Company Overview
- 12.1.10.2. Products
- 12.1.10.3. Company Financials
- 12.1.10.4. SWOT Analysis
- 12.1.11 Orafol Europe GmbH
- 12.1.11.1. Company Overview
- 12.1.11.2. Products
- 12.1.11.3. Company Financials
- 12.1.11.4. SWOT Analysis
- 12.1.12 Signs Express
- 12.1.12.1. Company Overview
- 12.1.12.2. Products
- 12.1.12.3. Company Financials
- 12.1.12.4. SWOT Analysis
- 12.1.1 Spandex Ltd
- 12.2. Market Entropy
- 12.2.1 Company's Key Areas Served
- 12.2.2 Recent Developments
- 12.3. Company Market Share Analysis 2025
- 12.3.1 Top 5 Companies Market Share Analysis
- 12.3.2 Top 3 Companies Market Share Analysis
- 12.4. List of Potential Customers
- 13. Research Methodology
List of Figures
- Figure 1: Global Printed Signage Market Revenue Breakdown (Million, %) by Region 2025 & 2033
- Figure 2: North America Printed Signage Market Revenue (Million), by Type 2025 & 2033
- Figure 3: North America Printed Signage Market Revenue Share (%), by Type 2025 & 2033
- Figure 4: North America Printed Signage Market Revenue (Million), by Print Technology 2025 & 2033
- Figure 5: North America Printed Signage Market Revenue Share (%), by Print Technology 2025 & 2033
- Figure 6: North America Printed Signage Market Revenue (Million), by End-user Vertical 2025 & 2033
- Figure 7: North America Printed Signage Market Revenue Share (%), by End-user Vertical 2025 & 2033
- Figure 8: North America Printed Signage Market Revenue (Million), by Application 2025 & 2033
- Figure 9: North America Printed Signage Market Revenue Share (%), by Application 2025 & 2033
- Figure 10: North America Printed Signage Market Revenue (Million), by Country 2025 & 2033
- Figure 11: North America Printed Signage Market Revenue Share (%), by Country 2025 & 2033
- Figure 12: Europe Printed Signage Market Revenue (Million), by Type 2025 & 2033
- Figure 13: Europe Printed Signage Market Revenue Share (%), by Type 2025 & 2033
- Figure 14: Europe Printed Signage Market Revenue (Million), by Print Technology 2025 & 2033
- Figure 15: Europe Printed Signage Market Revenue Share (%), by Print Technology 2025 & 2033
- Figure 16: Europe Printed Signage Market Revenue (Million), by End-user Vertical 2025 & 2033
- Figure 17: Europe Printed Signage Market Revenue Share (%), by End-user Vertical 2025 & 2033
- Figure 18: Europe Printed Signage Market Revenue (Million), by Application 2025 & 2033
- Figure 19: Europe Printed Signage Market Revenue Share (%), by Application 2025 & 2033
- Figure 20: Europe Printed Signage Market Revenue (Million), by Country 2025 & 2033
- Figure 21: Europe Printed Signage Market Revenue Share (%), by Country 2025 & 2033
- Figure 22: Asia Printed Signage Market Revenue (Million), by Type 2025 & 2033
- Figure 23: Asia Printed Signage Market Revenue Share (%), by Type 2025 & 2033
- Figure 24: Asia Printed Signage Market Revenue (Million), by Print Technology 2025 & 2033
- Figure 25: Asia Printed Signage Market Revenue Share (%), by Print Technology 2025 & 2033
- Figure 26: Asia Printed Signage Market Revenue (Million), by End-user Vertical 2025 & 2033
- Figure 27: Asia Printed Signage Market Revenue Share (%), by End-user Vertical 2025 & 2033
- Figure 28: Asia Printed Signage Market Revenue (Million), by Application 2025 & 2033
- Figure 29: Asia Printed Signage Market Revenue Share (%), by Application 2025 & 2033
- Figure 30: Asia Printed Signage Market Revenue (Million), by Country 2025 & 2033
- Figure 31: Asia Printed Signage Market Revenue Share (%), by Country 2025 & 2033
- Figure 32: Latin America Printed Signage Market Revenue (Million), by Type 2025 & 2033
- Figure 33: Latin America Printed Signage Market Revenue Share (%), by Type 2025 & 2033
- Figure 34: Latin America Printed Signage Market Revenue (Million), by Print Technology 2025 & 2033
- Figure 35: Latin America Printed Signage Market Revenue Share (%), by Print Technology 2025 & 2033
- Figure 36: Latin America Printed Signage Market Revenue (Million), by End-user Vertical 2025 & 2033
- Figure 37: Latin America Printed Signage Market Revenue Share (%), by End-user Vertical 2025 & 2033
- Figure 38: Latin America Printed Signage Market Revenue (Million), by Application 2025 & 2033
- Figure 39: Latin America Printed Signage Market Revenue Share (%), by Application 2025 & 2033
- Figure 40: Latin America Printed Signage Market Revenue (Million), by Country 2025 & 2033
- Figure 41: Latin America Printed Signage Market Revenue Share (%), by Country 2025 & 2033
- Figure 42: Middle East and Africa Printed Signage Market Revenue (Million), by Type 2025 & 2033
- Figure 43: Middle East and Africa Printed Signage Market Revenue Share (%), by Type 2025 & 2033
- Figure 44: Middle East and Africa Printed Signage Market Revenue (Million), by Print Technology 2025 & 2033
- Figure 45: Middle East and Africa Printed Signage Market Revenue Share (%), by Print Technology 2025 & 2033
- Figure 46: Middle East and Africa Printed Signage Market Revenue (Million), by End-user Vertical 2025 & 2033
- Figure 47: Middle East and Africa Printed Signage Market Revenue Share (%), by End-user Vertical 2025 & 2033
- Figure 48: Middle East and Africa Printed Signage Market Revenue (Million), by Application 2025 & 2033
- Figure 49: Middle East and Africa Printed Signage Market Revenue Share (%), by Application 2025 & 2033
- Figure 50: Middle East and Africa Printed Signage Market Revenue (Million), by Country 2025 & 2033
- Figure 51: Middle East and Africa Printed Signage Market Revenue Share (%), by Country 2025 & 2033
List of Tables
- Table 1: Global Printed Signage Market Revenue Million Forecast, by Type 2020 & 2033
- Table 2: Global Printed Signage Market Revenue Million Forecast, by Print Technology 2020 & 2033
- Table 3: Global Printed Signage Market Revenue Million Forecast, by End-user Vertical 2020 & 2033
- Table 4: Global Printed Signage Market Revenue Million Forecast, by Application 2020 & 2033
- Table 5: Global Printed Signage Market Revenue Million Forecast, by Region 2020 & 2033
- Table 6: Global Printed Signage Market Revenue Million Forecast, by Type 2020 & 2033
- Table 7: Global Printed Signage Market Revenue Million Forecast, by Print Technology 2020 & 2033
- Table 8: Global Printed Signage Market Revenue Million Forecast, by End-user Vertical 2020 & 2033
- Table 9: Global Printed Signage Market Revenue Million Forecast, by Application 2020 & 2033
- Table 10: Global Printed Signage Market Revenue Million Forecast, by Country 2020 & 2033
- Table 11: United States Printed Signage Market Revenue (Million) Forecast, by Application 2020 & 2033
- Table 12: Canada Printed Signage Market Revenue (Million) Forecast, by Application 2020 & 2033
- Table 13: Global Printed Signage Market Revenue Million Forecast, by Type 2020 & 2033
- Table 14: Global Printed Signage Market Revenue Million Forecast, by Print Technology 2020 & 2033
- Table 15: Global Printed Signage Market Revenue Million Forecast, by End-user Vertical 2020 & 2033
- Table 16: Global Printed Signage Market Revenue Million Forecast, by Application 2020 & 2033
- Table 17: Global Printed Signage Market Revenue Million Forecast, by Country 2020 & 2033
- Table 18: Germany Printed Signage Market Revenue (Million) Forecast, by Application 2020 & 2033
- Table 19: United Kingdom Printed Signage Market Revenue (Million) Forecast, by Application 2020 & 2033
- Table 20: France Printed Signage Market Revenue (Million) Forecast, by Application 2020 & 2033
- Table 21: Italy Printed Signage Market Revenue (Million) Forecast, by Application 2020 & 2033
- Table 22: Global Printed Signage Market Revenue Million Forecast, by Type 2020 & 2033
- Table 23: Global Printed Signage Market Revenue Million Forecast, by Print Technology 2020 & 2033
- Table 24: Global Printed Signage Market Revenue Million Forecast, by End-user Vertical 2020 & 2033
- Table 25: Global Printed Signage Market Revenue Million Forecast, by Application 2020 & 2033
- Table 26: Global Printed Signage Market Revenue Million Forecast, by Country 2020 & 2033
- Table 27: China Printed Signage Market Revenue (Million) Forecast, by Application 2020 & 2033
- Table 28: India Printed Signage Market Revenue (Million) Forecast, by Application 2020 & 2033
- Table 29: Japan Printed Signage Market Revenue (Million) Forecast, by Application 2020 & 2033
- Table 30: South Korea Printed Signage Market Revenue (Million) Forecast, by Application 2020 & 2033
- Table 31: Thailand Printed Signage Market Revenue (Million) Forecast, by Application 2020 & 2033
- Table 32: Australia and New Zealand Printed Signage Market Revenue (Million) Forecast, by Application 2020 & 2033
- Table 33: Global Printed Signage Market Revenue Million Forecast, by Type 2020 & 2033
- Table 34: Global Printed Signage Market Revenue Million Forecast, by Print Technology 2020 & 2033
- Table 35: Global Printed Signage Market Revenue Million Forecast, by End-user Vertical 2020 & 2033
- Table 36: Global Printed Signage Market Revenue Million Forecast, by Application 2020 & 2033
- Table 37: Global Printed Signage Market Revenue Million Forecast, by Country 2020 & 2033
- Table 38: Brazil Printed Signage Market Revenue (Million) Forecast, by Application 2020 & 2033
- Table 39: Mexico Printed Signage Market Revenue (Million) Forecast, by Application 2020 & 2033
- Table 40: Global Printed Signage Market Revenue Million Forecast, by Type 2020 & 2033
- Table 41: Global Printed Signage Market Revenue Million Forecast, by Print Technology 2020 & 2033
- Table 42: Global Printed Signage Market Revenue Million Forecast, by End-user Vertical 2020 & 2033
- Table 43: Global Printed Signage Market Revenue Million Forecast, by Application 2020 & 2033
- Table 44: Global Printed Signage Market Revenue Million Forecast, by Country 2020 & 2033
- Table 45: United Arab Emirates Printed Signage Market Revenue (Million) Forecast, by Application 2020 & 2033
- Table 46: Saudi Arabia Printed Signage Market Revenue (Million) Forecast, by Application 2020 & 2033
- Table 47: South Africa Printed Signage Market Revenue (Million) Forecast, by Application 2020 & 2033
Frequently Asked Questions
1. What is the projected Compound Annual Growth Rate (CAGR) of the Printed Signage Market?
The projected CAGR is approximately 1.56%.
2. Which companies are prominent players in the Printed Signage Market?
Key companies in the market include Spandex Ltd, EhKo Sign Industries KFT, IGEPA group GmbH & Co KG, 3A Composites Holding AG, Kelly Signs and Graphics, L&H Sign Company Inc, Mactac LLLC (Lintec), Lintec Corporation, Identity Group, Avery Dennison Corporation, Orafol Europe GmbH, Signs Express.
3. What are the main segments of the Printed Signage Market?
The market segments include Type, Print Technology, End-user Vertical, Application.
4. Can you provide details about the market size?
The market size is estimated to be USD 41.88 Million as of 2022.
5. What are some drivers contributing to market growth?
Cost Effectiveness of Printed Signage; Inclination of the Retail Industry Toward the Application of Printed Signage.
6. What are the notable trends driving market growth?
The Retail Sector Expected to Grow at a Significant Rate.
7. Are there any restraints impacting market growth?
High Competition from the Digital Signage Segment.
8. Can you provide examples of recent developments in the market?
February 2024: Kuhn Corp Print & Packaging strategically moved to fortify its position in the sign and display sector by successfully acquiring Regal Signs & Designs from its original owners. This acquisition is in line with Kuhn's commitment to expanding its signage operations and meeting growing customer demand, and it signifies a period of strategic growth for the company.
9. What pricing options are available for accessing the report?
Pricing options include single-user, multi-user, and enterprise licenses priced at USD 4750, USD 5250, and USD 8750 respectively.
10. Is the market size provided in terms of value or volume?
The market size is provided in terms of value, measured in Million.
11. Are there any specific market keywords associated with the report?
Yes, the market keyword associated with the report is "Printed Signage Market," which aids in identifying and referencing the specific market segment covered.
12. How do I determine which pricing option suits my needs best?
The pricing options vary based on user requirements and access needs. Individual users may opt for single-user licenses, while businesses requiring broader access may choose multi-user or enterprise licenses for cost-effective access to the report.
13. Are there any additional resources or data provided in the Printed Signage Market report?
While the report offers comprehensive insights, it's advisable to review the specific contents or supplementary materials provided to ascertain if additional resources or data are available.
14. How can I stay updated on further developments or reports in the Printed Signage Market?
To stay informed about further developments, trends, and reports in the Printed Signage Market, consider subscribing to industry newsletters, following relevant companies and organizations, or regularly checking reputable industry news sources and publications.
Methodology
Step 1 - Identification of Relevant Samples Size from Population Database


Step 2 - Approaches for Defining Global Market Size (Value, Volume* & Price*)

Note*: In applicable scenarios
Step 3 - Data Sources
Primary Research
- Web Analytics
- Survey Reports
- Research Institute
- Latest Research Reports
- Opinion Leaders
Secondary Research
- Annual Reports
- White Paper
- Latest Press Release
- Industry Association
- Paid Database
- Investor Presentations

Step 4 - Data Triangulation
Involves using different sources of information in order to increase the validity of a study
These sources are likely to be stakeholders in a program - participants, other researchers, program staff, other community members, and so on.
Then we put all data in single framework & apply various statistical tools to find out the dynamic on the market.
During the analysis stage, feedback from the stakeholder groups would be compared to determine areas of agreement as well as areas of divergence