

Key Insights
The global process gas compressor market is poised for significant expansion, projected to reach $6.3 billion by 2033, driven by a compound annual growth rate (CAGR) of 5.7% from the base year 2025. This growth is underpinned by escalating demand from the expanding oil and gas sector, particularly in the Middle East and Asia-Pacific. The increasing adoption of process gas compressors across diverse industries such as chemicals, power generation, and industrial gases further fuels this upward trajectory. Key drivers include technological advancements in energy-efficient, oil-free compressors and a heightened emphasis on emission reduction. However, market expansion may be influenced by volatile energy prices, stringent environmental regulations, and the cyclical nature of certain end-user industries. The market segmentation highlights a prevalent use of oil-injected compressors in established sectors, while oil-free alternatives are gaining prominence due to their environmental advantages and application-specific suitability. While North America and Europe currently dominate market share, the Asia-Pacific region is anticipated to experience robust growth, propelled by industrialization and infrastructure development initiatives.
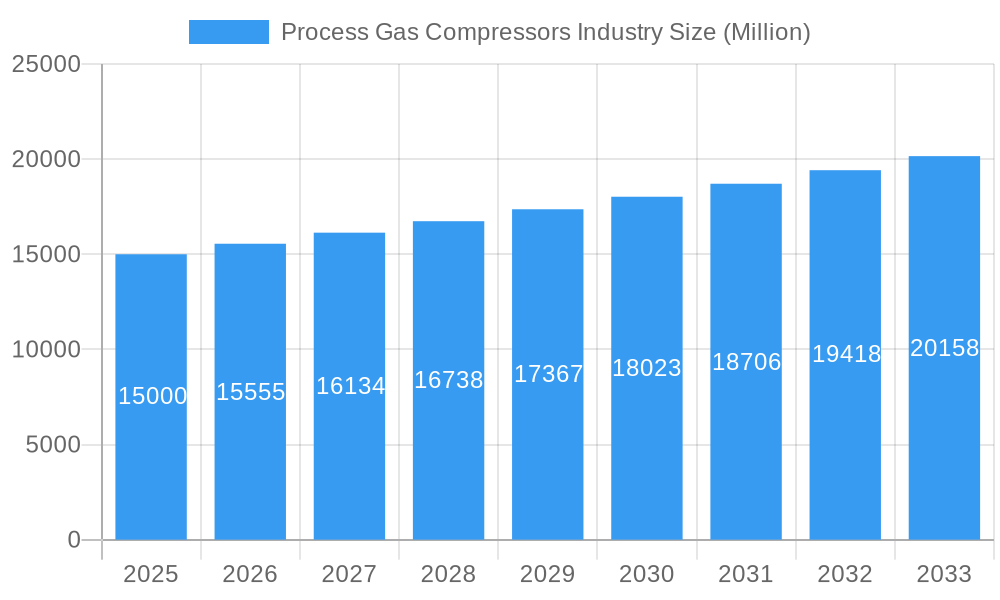
Process Gas Compressors Industry Market Size (In Billion)
The competitive landscape features prominent global entities and specialized regional players. Strategic collaborations, mergers, acquisitions, and continuous product innovation are key strategies employed to address evolving end-user demands. Companies are focusing on delivering customized solutions and comprehensive service packages to maintain a competitive edge. The market's future prospects remain favorable, supported by sustained demand and ongoing technological improvements aimed at enhancing efficiency, reliability, and environmental performance. The global transition to cleaner energy sources also presents opportunities for developing specialized compressors for renewable energy applications, contributing to long-term market growth. Regional expansion will be contingent upon government policies, infrastructure investments, and prevailing economic conditions.
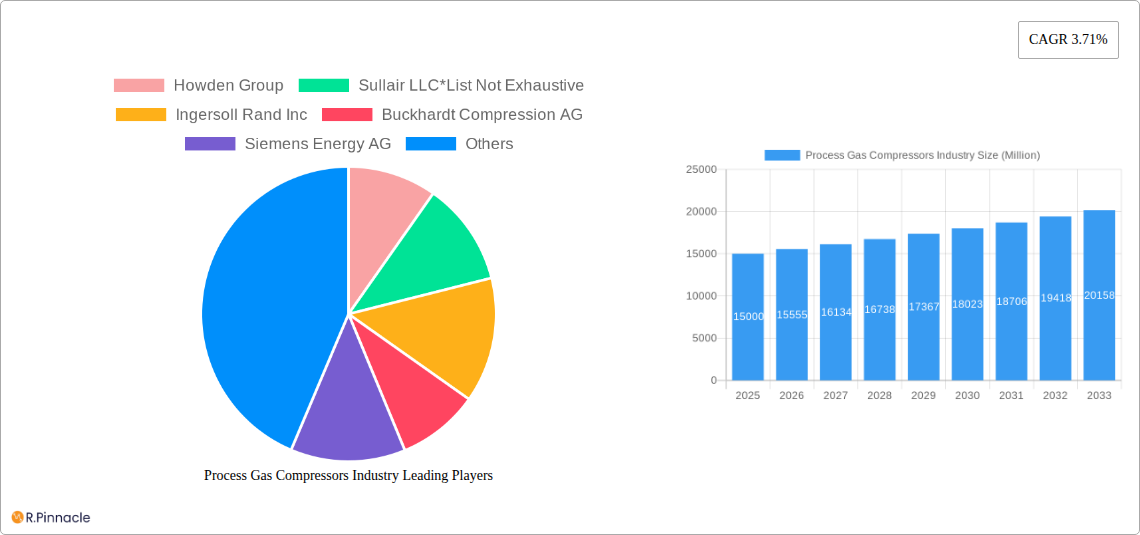
Process Gas Compressors Industry Company Market Share
This comprehensive report offers in-depth analysis of the Process Gas Compressors industry, providing valuable insights for industry professionals, investors, and strategic decision-makers. Examining the market from 2019 to 2033, with a specific focus on 2025, this report meticulously details market dynamics, segmentation, leading players, and future growth prospects. The market size was estimated at approximately $6.3 billion in 2025 and is projected to reach approximately $6.3 billion by 2033.
Process Gas Compressors Industry Market Structure & Innovation Trends
This section analyzes the competitive landscape of the Process Gas Compressor market, including market concentration, innovation drivers, regulatory influences, and significant M&A activities. The report assesses the market share held by key players such as Howden Group, Sullair LLC, Ingersoll Rand Inc, Burckhardt Compression AG, Siemens Energy AG, Sundyne LLC, Bauer Kompressoren GmbH, Borsig ZM GmbH, and Atlas Copco Group. While the exact market share for each company isn't specified, the report explores the competitive dynamics and strategies employed by these industry giants.
- Market Concentration: The market exhibits a moderately concentrated structure with a few major players holding significant shares. The report quantifies this concentration using appropriate metrics such as the Herfindahl-Hirschman Index (HHI) or concentration ratios.
- Innovation Drivers: Key drivers include the need for higher efficiency compressors, stricter environmental regulations, and the growing demand for process gas compression in various end-use sectors. The report identifies specific technological advancements fueling innovation.
- Regulatory Framework: The impact of global and regional environmental regulations on the industry is analyzed, focusing on emission standards and energy efficiency requirements.
- Product Substitutes: The report explores potential substitutes for process gas compressors and assesses their impact on market share and technological advancements.
- End-User Demographics: The report provides a detailed breakdown of end-user segments, including their specific needs and preferences, influencing the demand for process gas compressors.
- M&A Activities: The report examines major mergers and acquisitions (M&A) within the industry during the study period, providing insights into deal values and their strategic implications. Examples include analyzing the strategic rationale and impacts of deals worth potentially hundreds of Millions.
Process Gas Compressors Industry Market Dynamics & Trends
This section explores the key factors driving market growth, including technological advancements, shifting consumer preferences, and competitive dynamics. The report uses a detailed analysis of historical data (2019-2024) and projections (2025-2033) to establish trends. The Compound Annual Growth Rate (CAGR) is calculated and presented to illustrate the expected growth trajectory. Market penetration of various compressor types and technologies is also assessed.
The report thoroughly analyzes the influence of technological advancements, such as the development of more energy-efficient compressors and the integration of digital technologies, on market growth. It further examines the impact of evolving consumer preferences towards sustainability and the adoption of stringent environmental regulations on the industry's dynamics. A comprehensive competitive analysis explores the market strategies and activities of key players, including pricing strategies, product launches, and partnerships.
Dominant Regions & Segments in Process Gas Compressors Industry
This section identifies the leading geographical regions and market segments for process gas compressors. The analysis considers both type (Oil Injected, Oil Free) and end-user (Oil & Gas, Chemicals, Power Generation, Industrial Gases, Others). Key drivers for each dominant region and segment are detailed using bullet points, while paragraphs provide in-depth dominance analyses.
- Leading Region/Country: [The report will specify the leading region and country based on market size and growth rate.] Reasons for dominance include:
- [Specific economic policies impacting the region's growth.]
- [Development and investment in relevant infrastructure.]
- [Strong presence of key industry players within the region.]
- Leading Segment (Type): [The report will specify either Oil Injected or Oil Free based on market data, and provide reasons for its dominance.]
- Leading Segment (End-User): [The report will specify the leading end-user segment (e.g., Oil & Gas, Chemicals, etc.) and explain the drivers for its dominance, based on market analysis].
Process Gas Compressors Industry Product Innovations
This section summarizes recent product developments, highlighting technological trends, key features, and competitive advantages of new compressors. This includes advancements in efficiency, reliability, and sustainability. The report assesses the market fit of these innovations and their potential impact on the industry's future.
Report Scope & Segmentation Analysis
This report segments the process gas compressor market by type (Oil Injected, Oil Free) and end-user (Oil & Gas, Chemicals, Power Generation, Industrial Gases, Others). Each segment's growth projections, market size, and competitive dynamics are analyzed. Growth rates and market size are projected for each segment for the forecast period (2025-2033).
Key Drivers of Process Gas Compressors Industry Growth
Several factors drive the growth of the process gas compressor market. Technological advancements leading to higher efficiency and lower emissions are key. Economic growth in various end-use sectors, particularly in developing economies, significantly boosts demand. Stringent environmental regulations necessitate the adoption of cleaner and more efficient compression technologies, further propelling market growth.
Challenges in the Process Gas Compressors Industry Sector
The industry faces challenges such as stringent environmental regulations requiring substantial investment in emission control technologies. Supply chain disruptions and fluctuations in raw material prices impact production costs and profitability. Intense competition among established players and the emergence of new entrants create competitive pressures.
Emerging Opportunities in Process Gas Compressors Industry
Emerging opportunities include the growth of renewable energy sectors (e.g., hydrogen production) demanding specialized compression technologies. The development and adoption of digital technologies (IoT, AI) present opportunities for enhancing compressor efficiency and predictive maintenance. Expansion into new geographical markets, particularly in developing economies, presents further growth potential.
Leading Players in the Process Gas Compressors Industry Market
- Howden Group
- Sullair LLC
- Ingersoll Rand Inc
- Burckhardt Compression AG
- Siemens Energy AG
- Sundyne LLC
- Bauer Kompressoren GmbH
- Borsig ZM GmbH
- Atlas Copco Group
Key Developments in Process Gas Compressors Industry Industry
- August 2020: Vericor power systems announced a strategic partnership with Atlas Copco Gas and Process.
- February 2020: Burckhardt Compression signed a JV agreement with GRZ Technologies for hydrogen compression technology.
Future Outlook for Process Gas Compressors Industry Market
The future of the process gas compressor market is promising, driven by increasing demand from various end-use industries, technological advancements towards energy efficiency and sustainability, and expansion into new geographic markets. Strategic partnerships and investments in research and development will play a crucial role in shaping the industry's trajectory. The market is poised for significant growth in the coming years, presenting substantial opportunities for industry players.
Process Gas Compressors Industry Segmentation
-
1. Type
- 1.1. Oil Injected
- 1.2. Oil Free
-
2. End User
- 2.1. Oil & Gas
- 2.2. Chemicals
- 2.3. Power Generation
- 2.4. Industrial Gases
- 2.5. Others (Manufacturing, Healthcare, etc.)
Process Gas Compressors Industry Segmentation By Geography
- 1. North America
- 2. Europe
- 3. Asia Pacific
- 4. South America
- 5. Middle East
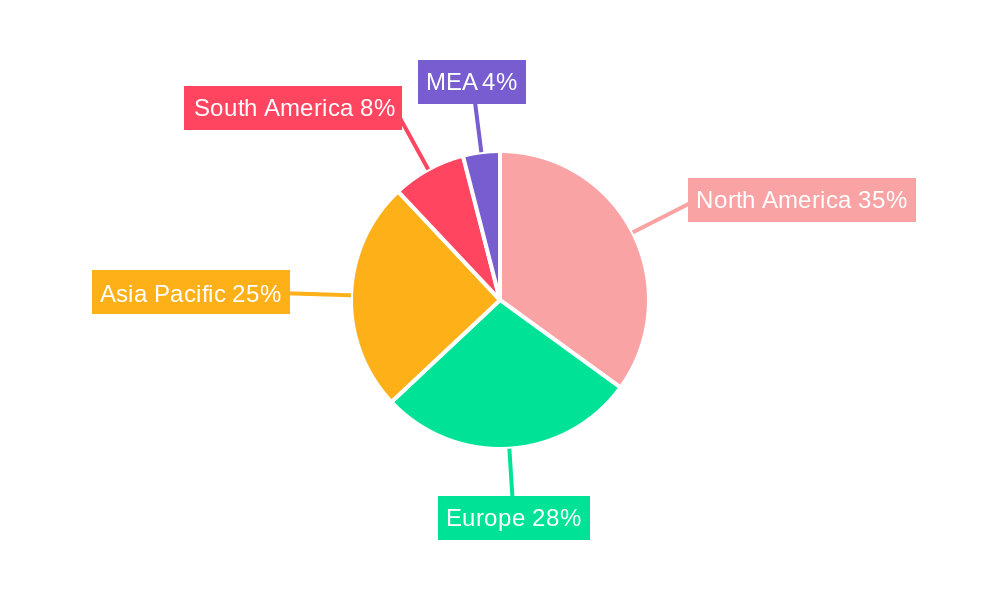
Process Gas Compressors Industry Regional Market Share
Geographic Coverage of Process Gas Compressors Industry
Process Gas Compressors Industry REPORT HIGHLIGHTS
| Aspects | Details |
|---|---|
| Study Period | 2020-2034 |
| Base Year | 2025 |
| Estimated Year | 2026 |
| Forecast Period | 2026-2034 |
| Historical Period | 2020-2025 |
| Growth Rate | CAGR of 5.7% from 2020-2034 |
| Segmentation |
|
Table of Contents
- 1. Introduction
- 1.1. Research Scope
- 1.2. Market Segmentation
- 1.3. Research Objective
- 1.4. Definitions and Assumptions
- 2. Executive Summary
- 2.1. Market Snapshot
- 3. Market Dynamics
- 3.1. Market Drivers
- 3.2. Market Restrains
- 3.3. Market Trends
- 3.4. Market Opportunities
- 4. Market Factor Analysis
- 4.1. Porters Five Forces
- 4.1.1. Bargaining Power of Suppliers
- 4.1.2. Bargaining Power of Buyers
- 4.1.3. Threat of New Entrants
- 4.1.4. Threat of Substitutes
- 4.1.5. Competitive Rivalry
- 4.2. PESTEL analysis
- 4.3. BCG Analysis
- 4.3.1. Stars (High Growth, High Market Share)
- 4.3.2. Cash Cows (Low Growth, High Market Share)
- 4.3.3. Question Mark (High Growth, Low Market Share)
- 4.3.4. Dogs (Low Growth, Low Market Share)
- 4.4. Ansoff Matrix Analysis
- 4.5. Supply Chain Analysis
- 4.6. Regulatory Landscape
- 4.7. Current Market Potential and Opportunity Assessment (TAM–SAM–SOM Framework)
- 4.8. PRI Analyst Note
- 4.1. Porters Five Forces
- 5. Market Analysis, Insights and Forecast 2021-2033
- 5.1. Market Analysis, Insights and Forecast - by Type
- 5.1.1. Oil Injected
- 5.1.2. Oil Free
- 5.2. Market Analysis, Insights and Forecast - by End User
- 5.2.1. Oil & Gas
- 5.2.2. Chemicals
- 5.2.3. Power Generation
- 5.2.4. Industrial Gases
- 5.2.5. Others (Manufacturing, Healthcare, etc.)
- 5.3. Market Analysis, Insights and Forecast - by Region
- 5.3.1. North America
- 5.3.2. Europe
- 5.3.3. Asia Pacific
- 5.3.4. South America
- 5.3.5. Middle East
- 5.1. Market Analysis, Insights and Forecast - by Type
- 6. Global Process Gas Compressors Industry Analysis, Insights and Forecast, 2021-2033
- 6.1. Market Analysis, Insights and Forecast - by Type
- 6.1.1. Oil Injected
- 6.1.2. Oil Free
- 6.2. Market Analysis, Insights and Forecast - by End User
- 6.2.1. Oil & Gas
- 6.2.2. Chemicals
- 6.2.3. Power Generation
- 6.2.4. Industrial Gases
- 6.2.5. Others (Manufacturing, Healthcare, etc.)
- 6.1. Market Analysis, Insights and Forecast - by Type
- 7. North America Process Gas Compressors Industry Analysis, Insights and Forecast, 2020-2032
- 7.1. Market Analysis, Insights and Forecast - by Type
- 7.1.1. Oil Injected
- 7.1.2. Oil Free
- 7.2. Market Analysis, Insights and Forecast - by End User
- 7.2.1. Oil & Gas
- 7.2.2. Chemicals
- 7.2.3. Power Generation
- 7.2.4. Industrial Gases
- 7.2.5. Others (Manufacturing, Healthcare, etc.)
- 7.1. Market Analysis, Insights and Forecast - by Type
- 8. Europe Process Gas Compressors Industry Analysis, Insights and Forecast, 2020-2032
- 8.1. Market Analysis, Insights and Forecast - by Type
- 8.1.1. Oil Injected
- 8.1.2. Oil Free
- 8.2. Market Analysis, Insights and Forecast - by End User
- 8.2.1. Oil & Gas
- 8.2.2. Chemicals
- 8.2.3. Power Generation
- 8.2.4. Industrial Gases
- 8.2.5. Others (Manufacturing, Healthcare, etc.)
- 8.1. Market Analysis, Insights and Forecast - by Type
- 9. Asia Pacific Process Gas Compressors Industry Analysis, Insights and Forecast, 2020-2032
- 9.1. Market Analysis, Insights and Forecast - by Type
- 9.1.1. Oil Injected
- 9.1.2. Oil Free
- 9.2. Market Analysis, Insights and Forecast - by End User
- 9.2.1. Oil & Gas
- 9.2.2. Chemicals
- 9.2.3. Power Generation
- 9.2.4. Industrial Gases
- 9.2.5. Others (Manufacturing, Healthcare, etc.)
- 9.1. Market Analysis, Insights and Forecast - by Type
- 10. South America Process Gas Compressors Industry Analysis, Insights and Forecast, 2020-2032
- 10.1. Market Analysis, Insights and Forecast - by Type
- 10.1.1. Oil Injected
- 10.1.2. Oil Free
- 10.2. Market Analysis, Insights and Forecast - by End User
- 10.2.1. Oil & Gas
- 10.2.2. Chemicals
- 10.2.3. Power Generation
- 10.2.4. Industrial Gases
- 10.2.5. Others (Manufacturing, Healthcare, etc.)
- 10.1. Market Analysis, Insights and Forecast - by Type
- 11. Middle East Process Gas Compressors Industry Analysis, Insights and Forecast, 2020-2032
- 11.1. Market Analysis, Insights and Forecast - by Type
- 11.1.1. Oil Injected
- 11.1.2. Oil Free
- 11.2. Market Analysis, Insights and Forecast - by End User
- 11.2.1. Oil & Gas
- 11.2.2. Chemicals
- 11.2.3. Power Generation
- 11.2.4. Industrial Gases
- 11.2.5. Others (Manufacturing, Healthcare, etc.)
- 11.1. Market Analysis, Insights and Forecast - by Type
- 12. Competitive Analysis
- 12.1. Company Profiles
- 12.1.1 Howden Group
- 12.1.1.1. Company Overview
- 12.1.1.2. Products
- 12.1.1.3. Company Financials
- 12.1.1.4. SWOT Analysis
- 12.1.2 Sullair LLC*List Not Exhaustive
- 12.1.2.1. Company Overview
- 12.1.2.2. Products
- 12.1.2.3. Company Financials
- 12.1.2.4. SWOT Analysis
- 12.1.3 Ingersoll Rand Inc
- 12.1.3.1. Company Overview
- 12.1.3.2. Products
- 12.1.3.3. Company Financials
- 12.1.3.4. SWOT Analysis
- 12.1.4 Buckhardt Compression AG
- 12.1.4.1. Company Overview
- 12.1.4.2. Products
- 12.1.4.3. Company Financials
- 12.1.4.4. SWOT Analysis
- 12.1.5 Siemens Energy AG
- 12.1.5.1. Company Overview
- 12.1.5.2. Products
- 12.1.5.3. Company Financials
- 12.1.5.4. SWOT Analysis
- 12.1.6 Sundyne LLC
- 12.1.6.1. Company Overview
- 12.1.6.2. Products
- 12.1.6.3. Company Financials
- 12.1.6.4. SWOT Analysis
- 12.1.7 Bauer Kompressoren GmbH
- 12.1.7.1. Company Overview
- 12.1.7.2. Products
- 12.1.7.3. Company Financials
- 12.1.7.4. SWOT Analysis
- 12.1.8 Borsig ZM GmbH
- 12.1.8.1. Company Overview
- 12.1.8.2. Products
- 12.1.8.3. Company Financials
- 12.1.8.4. SWOT Analysis
- 12.1.9 Atlas Copco Group
- 12.1.9.1. Company Overview
- 12.1.9.2. Products
- 12.1.9.3. Company Financials
- 12.1.9.4. SWOT Analysis
- 12.1.1 Howden Group
- 12.2. Market Entropy
- 12.2.1 Company's Key Areas Served
- 12.2.2 Recent Developments
- 12.3. Company Market Share Analysis 2025
- 12.3.1 Top 5 Companies Market Share Analysis
- 12.3.2 Top 3 Companies Market Share Analysis
- 12.4. List of Potential Customers
- 13. Research Methodology
List of Figures
- Figure 1: Global Process Gas Compressors Industry Revenue Breakdown (billion, %) by Region 2025 & 2033
- Figure 2: North America Process Gas Compressors Industry Revenue (billion), by Type 2025 & 2033
- Figure 3: North America Process Gas Compressors Industry Revenue Share (%), by Type 2025 & 2033
- Figure 4: North America Process Gas Compressors Industry Revenue (billion), by End User 2025 & 2033
- Figure 5: North America Process Gas Compressors Industry Revenue Share (%), by End User 2025 & 2033
- Figure 6: North America Process Gas Compressors Industry Revenue (billion), by Country 2025 & 2033
- Figure 7: North America Process Gas Compressors Industry Revenue Share (%), by Country 2025 & 2033
- Figure 8: Europe Process Gas Compressors Industry Revenue (billion), by Type 2025 & 2033
- Figure 9: Europe Process Gas Compressors Industry Revenue Share (%), by Type 2025 & 2033
- Figure 10: Europe Process Gas Compressors Industry Revenue (billion), by End User 2025 & 2033
- Figure 11: Europe Process Gas Compressors Industry Revenue Share (%), by End User 2025 & 2033
- Figure 12: Europe Process Gas Compressors Industry Revenue (billion), by Country 2025 & 2033
- Figure 13: Europe Process Gas Compressors Industry Revenue Share (%), by Country 2025 & 2033
- Figure 14: Asia Pacific Process Gas Compressors Industry Revenue (billion), by Type 2025 & 2033
- Figure 15: Asia Pacific Process Gas Compressors Industry Revenue Share (%), by Type 2025 & 2033
- Figure 16: Asia Pacific Process Gas Compressors Industry Revenue (billion), by End User 2025 & 2033
- Figure 17: Asia Pacific Process Gas Compressors Industry Revenue Share (%), by End User 2025 & 2033
- Figure 18: Asia Pacific Process Gas Compressors Industry Revenue (billion), by Country 2025 & 2033
- Figure 19: Asia Pacific Process Gas Compressors Industry Revenue Share (%), by Country 2025 & 2033
- Figure 20: South America Process Gas Compressors Industry Revenue (billion), by Type 2025 & 2033
- Figure 21: South America Process Gas Compressors Industry Revenue Share (%), by Type 2025 & 2033
- Figure 22: South America Process Gas Compressors Industry Revenue (billion), by End User 2025 & 2033
- Figure 23: South America Process Gas Compressors Industry Revenue Share (%), by End User 2025 & 2033
- Figure 24: South America Process Gas Compressors Industry Revenue (billion), by Country 2025 & 2033
- Figure 25: South America Process Gas Compressors Industry Revenue Share (%), by Country 2025 & 2033
- Figure 26: Middle East Process Gas Compressors Industry Revenue (billion), by Type 2025 & 2033
- Figure 27: Middle East Process Gas Compressors Industry Revenue Share (%), by Type 2025 & 2033
- Figure 28: Middle East Process Gas Compressors Industry Revenue (billion), by End User 2025 & 2033
- Figure 29: Middle East Process Gas Compressors Industry Revenue Share (%), by End User 2025 & 2033
- Figure 30: Middle East Process Gas Compressors Industry Revenue (billion), by Country 2025 & 2033
- Figure 31: Middle East Process Gas Compressors Industry Revenue Share (%), by Country 2025 & 2033
List of Tables
- Table 1: Global Process Gas Compressors Industry Revenue billion Forecast, by Type 2020 & 2033
- Table 2: Global Process Gas Compressors Industry Revenue billion Forecast, by End User 2020 & 2033
- Table 3: Global Process Gas Compressors Industry Revenue billion Forecast, by Region 2020 & 2033
- Table 4: Global Process Gas Compressors Industry Revenue billion Forecast, by Type 2020 & 2033
- Table 5: Global Process Gas Compressors Industry Revenue billion Forecast, by End User 2020 & 2033
- Table 6: Global Process Gas Compressors Industry Revenue billion Forecast, by Country 2020 & 2033
- Table 7: Global Process Gas Compressors Industry Revenue billion Forecast, by Type 2020 & 2033
- Table 8: Global Process Gas Compressors Industry Revenue billion Forecast, by End User 2020 & 2033
- Table 9: Global Process Gas Compressors Industry Revenue billion Forecast, by Country 2020 & 2033
- Table 10: Global Process Gas Compressors Industry Revenue billion Forecast, by Type 2020 & 2033
- Table 11: Global Process Gas Compressors Industry Revenue billion Forecast, by End User 2020 & 2033
- Table 12: Global Process Gas Compressors Industry Revenue billion Forecast, by Country 2020 & 2033
- Table 13: Global Process Gas Compressors Industry Revenue billion Forecast, by Type 2020 & 2033
- Table 14: Global Process Gas Compressors Industry Revenue billion Forecast, by End User 2020 & 2033
- Table 15: Global Process Gas Compressors Industry Revenue billion Forecast, by Country 2020 & 2033
- Table 16: Global Process Gas Compressors Industry Revenue billion Forecast, by Type 2020 & 2033
- Table 17: Global Process Gas Compressors Industry Revenue billion Forecast, by End User 2020 & 2033
- Table 18: Global Process Gas Compressors Industry Revenue billion Forecast, by Country 2020 & 2033
Frequently Asked Questions
1. What is the projected Compound Annual Growth Rate (CAGR) of the Process Gas Compressors Industry?
The projected CAGR is approximately 5.7%.
2. Which companies are prominent players in the Process Gas Compressors Industry?
Key companies in the market include Howden Group, Sullair LLC*List Not Exhaustive, Ingersoll Rand Inc, Buckhardt Compression AG, Siemens Energy AG, Sundyne LLC, Bauer Kompressoren GmbH, Borsig ZM GmbH, Atlas Copco Group.
3. What are the main segments of the Process Gas Compressors Industry?
The market segments include Type, End User.
4. Can you provide details about the market size?
The market size is estimated to be USD 6.3 billion as of 2022.
5. What are some drivers contributing to market growth?
4.; Soaring Demand From Natural Gas Sector4.; Increasing Demand From The Refinery And Petrochemical Sector.
6. What are the notable trends driving market growth?
Oil-injected Compressors to Dominate the Market.
7. Are there any restraints impacting market growth?
4.; Higher Capital Cost Compared To Traditional Internal Combustion Engines.
8. Can you provide examples of recent developments in the market?
In August 2020, Vericor power systems announced a strategic partnership with Atlas Copco Gas and process to power integrally geared centrifugal compressors and companders with Vericor gas-driven turbines.
9. What pricing options are available for accessing the report?
Pricing options include single-user, multi-user, and enterprise licenses priced at USD 4750, USD 5250, and USD 8750 respectively.
10. Is the market size provided in terms of value or volume?
The market size is provided in terms of value, measured in billion.
11. Are there any specific market keywords associated with the report?
Yes, the market keyword associated with the report is "Process Gas Compressors Industry," which aids in identifying and referencing the specific market segment covered.
12. How do I determine which pricing option suits my needs best?
The pricing options vary based on user requirements and access needs. Individual users may opt for single-user licenses, while businesses requiring broader access may choose multi-user or enterprise licenses for cost-effective access to the report.
13. Are there any additional resources or data provided in the Process Gas Compressors Industry report?
While the report offers comprehensive insights, it's advisable to review the specific contents or supplementary materials provided to ascertain if additional resources or data are available.
14. How can I stay updated on further developments or reports in the Process Gas Compressors Industry?
To stay informed about further developments, trends, and reports in the Process Gas Compressors Industry, consider subscribing to industry newsletters, following relevant companies and organizations, or regularly checking reputable industry news sources and publications.
Methodology
Step 1 - Identification of Relevant Samples Size from Population Database


Step 2 - Approaches for Defining Global Market Size (Value, Volume* & Price*)

Note*: In applicable scenarios
Step 3 - Data Sources
Primary Research
- Web Analytics
- Survey Reports
- Research Institute
- Latest Research Reports
- Opinion Leaders
Secondary Research
- Annual Reports
- White Paper
- Latest Press Release
- Industry Association
- Paid Database
- Investor Presentations

Step 4 - Data Triangulation
Involves using different sources of information in order to increase the validity of a study
These sources are likely to be stakeholders in a program - participants, other researchers, program staff, other community members, and so on.
Then we put all data in single framework & apply various statistical tools to find out the dynamic on the market.
During the analysis stage, feedback from the stakeholder groups would be compared to determine areas of agreement as well as areas of divergence