

Key Insights
The process visualization software market is experiencing robust growth, driven by the increasing demand for enhanced operational efficiency and improved decision-making across various industries. The market's expansion is fueled by the rising adoption of Industry 4.0 technologies, including the Industrial Internet of Things (IIoT) and advanced analytics. These technologies generate massive amounts of process data, necessitating sophisticated software solutions for visualization and interpretation. Furthermore, the growing need for real-time monitoring and control of industrial processes, particularly in sectors like manufacturing, energy, and pharmaceuticals, is significantly contributing to market growth. Companies are increasingly investing in process visualization software to optimize production, reduce downtime, and improve overall productivity. The competitive landscape is characterized by a mix of established players and emerging technology providers, leading to innovation and the development of advanced features such as augmented reality (AR) and virtual reality (VR) integration for enhanced visualization and operator training. This competitive environment is pushing down prices and increasing the accessibility of the technology for small and medium-sized enterprises (SMEs).
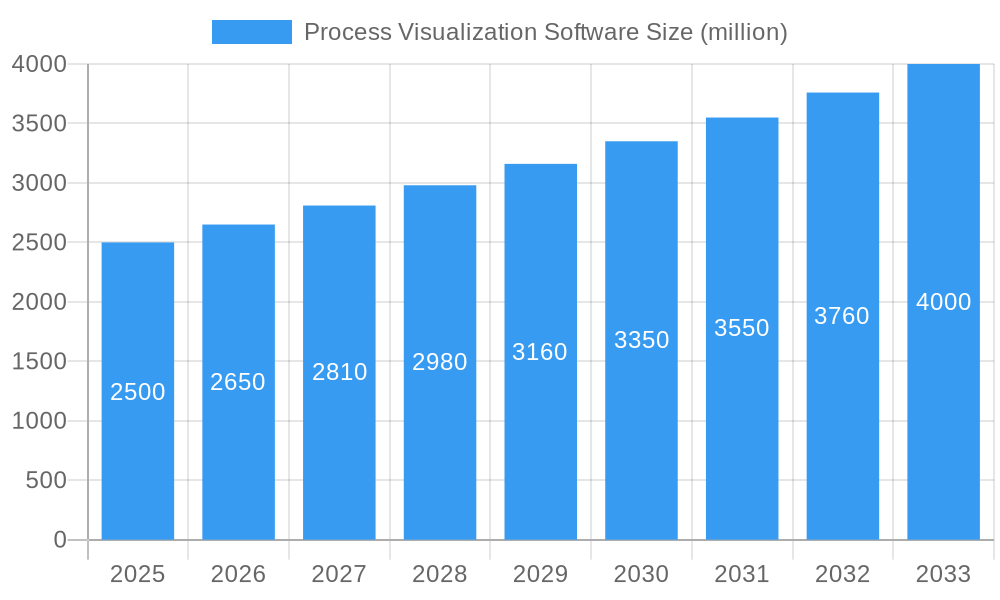
Process Visualization Software Market Size (In Billion)
The market is segmented based on various factors, including deployment type (cloud-based and on-premise), industry (manufacturing, energy, etc.), and functionality (historical data analysis, real-time monitoring, predictive maintenance). While the cloud-based deployment is witnessing faster growth due to its scalability and cost-effectiveness, on-premise solutions remain prevalent in industries with stringent security requirements. Future growth will be significantly influenced by advancements in artificial intelligence (AI) and machine learning (ML) for predictive analytics and automated decision-making capabilities within the visualization software. The integration of these technologies will transform process visualization from a purely monitoring tool to a proactive and predictive system, further driving market expansion. We estimate the market to reach a value of $5 billion by 2033, demonstrating substantial growth potential.
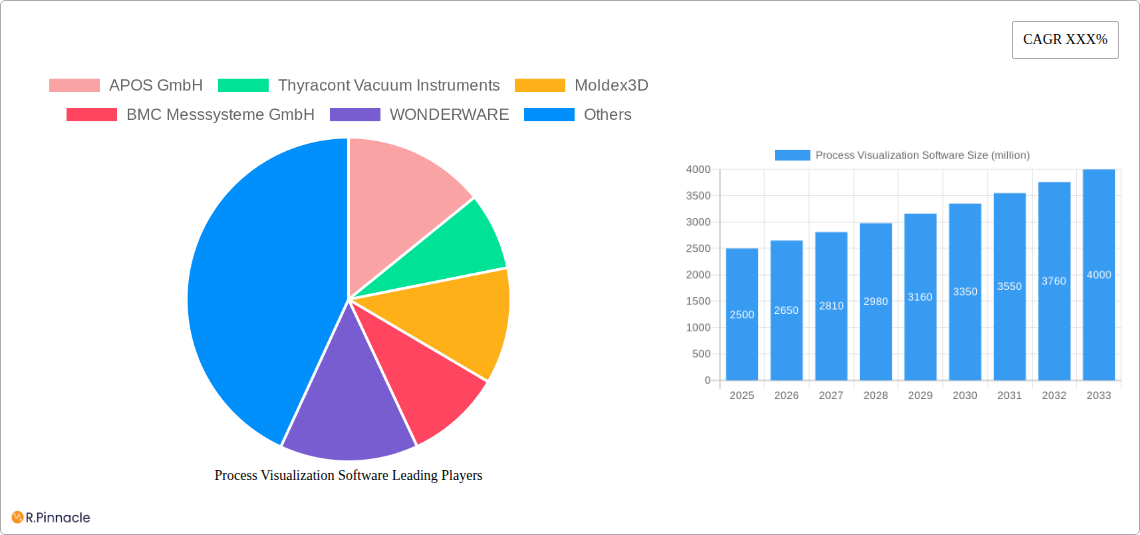
Process Visualization Software Company Market Share
Process Visualization Software Market Report: 2019-2033
This comprehensive report provides an in-depth analysis of the global Process Visualization Software market, offering invaluable insights for industry professionals, investors, and strategic decision-makers. With a focus on market structure, innovation trends, dominant regions, and leading players, this report projects a market valuation exceeding $XX million by 2033. The study period covers 2019-2033, with 2025 serving as the base and estimated year. The forecast period spans 2025-2033, while the historical period encompasses 2019-2024.
Process Visualization Software Market Structure & Innovation Trends
The global Process Visualization Software market exhibits a moderately concentrated structure, with a few major players holding significant market share. In 2025, the top five companies are estimated to collectively control approximately XX% of the market. Innovation is driven by the increasing need for real-time process monitoring, enhanced data analytics, and improved operational efficiency across various industries. Regulatory frameworks, particularly those related to data security and industrial safety, are shaping product development and deployment strategies. Significant M&A activity, with total deal values exceeding $XX million in the last five years, indicates ongoing consolidation within the market. Key players are focusing on expanding their product portfolios through strategic acquisitions and partnerships. Product substitutes, such as traditional control systems and manual monitoring methods, are gradually losing ground due to the superior capabilities and efficiency offered by process visualization software. The end-user demographics are diverse, encompassing manufacturing, energy, healthcare, and various other sectors.
- Market Share (2025): Top 5 players – XX%
- M&A Deal Value (2019-2024): >$XX million
- Key Innovation Drivers: Real-time monitoring, data analytics, improved efficiency, regulatory compliance.
Process Visualization Software Market Dynamics & Trends
The Process Visualization Software market is experiencing robust growth, driven by the increasing adoption of Industry 4.0 technologies, the rising demand for data-driven decision-making, and the need for improved operational efficiency. The Compound Annual Growth Rate (CAGR) for the forecast period (2025-2033) is estimated to be XX%. Technological disruptions, including the emergence of advanced analytics, artificial intelligence (AI), and cloud-based solutions, are significantly impacting market dynamics. Consumer preferences are shifting towards user-friendly interfaces, seamless integration with existing systems, and enhanced security features. Competitive dynamics are characterized by intense rivalry among established players and the emergence of innovative startups. Market penetration is increasing across various industries, driven by the proven ROI of process visualization software.
Dominant Regions & Segments in Process Visualization Software
The North American region currently holds the largest market share in Process Visualization Software, driven by factors such as high technology adoption rates, robust industrial infrastructure, and strong government support for digital transformation initiatives.
- Key Drivers in North America:
- Strong industrial base and early adoption of Industry 4.0.
- Advanced technological infrastructure and skilled workforce.
- Favorable regulatory environment and government incentives.
Europe and Asia-Pacific are also significant markets, exhibiting strong growth potential. Within the segments, the manufacturing sector demonstrates the highest demand for Process Visualization Software, followed by energy and healthcare.
Process Visualization Software Product Innovations
Recent product innovations include advanced analytics capabilities, AI-powered predictive maintenance features, and seamless integration with cloud platforms. These innovations enhance the value proposition for users by improving efficiency, reducing downtime, and facilitating data-driven decision-making. The focus is on creating user-friendly interfaces and improving compatibility with various industrial systems, driving wider market adoption.
Report Scope & Segmentation Analysis
This report provides a comprehensive segmentation of the Process Visualization Software market based on deployment type (cloud-based, on-premise), component (software, services), industry (manufacturing, energy, healthcare, etc.), and region (North America, Europe, Asia-Pacific, etc.). Each segment's growth projection, market size, and competitive landscape are analyzed in detail.
Key Drivers of Process Visualization Software Growth
Several factors drive the growth of the Process Visualization Software market, including increasing automation in industrial processes, the growing need for real-time data analysis, and rising demand for improved operational efficiency. Government initiatives promoting digital transformation in various sectors also contribute to market growth. The cost-effectiveness and scalability of cloud-based solutions are further accelerating market expansion.
Challenges in the Process Visualization Software Sector
Key challenges include the high initial investment costs associated with implementing process visualization software, ensuring data security and compliance with regulatory frameworks, and integrating with legacy systems. The complexity of implementing and maintaining these systems, along with the need for skilled personnel, also pose challenges for some organizations. Competitive pressure from both established players and new entrants adds another layer of complexity.
Emerging Opportunities in Process Visualization Software
The market offers numerous opportunities in areas such as the integration of augmented reality (AR) and virtual reality (VR) technologies for enhanced process visualization, the development of AI-powered predictive maintenance solutions, and expanding into new and emerging markets like smart cities and the Internet of Things (IoT).
Leading Players in the Process Visualization Software Market
- APOS GmbH
- Thyracont Vacuum Instruments
- Moldex3D
- BMC Messsysteme GmbH
- WONDERWARE
- IBM
- EUROTHERM PROCESS
- ESI GROUP
- SourceCode Technology Holdings
- LUMEL
- ARC Informatique
- INTRAVIS GmbH
- Beckhoff Automation
- Adcon Telemetry
- NDC Technologies
- AUTODESK
- The MathWorks
- SIMULIA
- Hexagon PPM
- Lucid Software
- iba AG
Key Developments in Process Visualization Software Industry
- 2022-Q4: Company X launches a new cloud-based process visualization platform.
- 2023-Q1: Company Y acquires Company Z, expanding its market reach.
- 2023-Q3: A significant regulatory update impacts data security requirements for process visualization software. (Further developments can be added here).
Future Outlook for Process Visualization Software Market
The Process Visualization Software market is poised for continued growth, driven by ongoing technological advancements, increasing industrial automation, and the growing demand for improved operational efficiency across various industries. Strategic partnerships, product innovation, and expansion into emerging markets will be key to success for market players in the years to come. The potential for integrating advanced technologies like AI, IoT, and AR/VR offers significant opportunities for growth and value creation.
Process Visualization Software Segmentation
-
1. Application
- 1.1. Building
- 1.2. Engineering Drawing
- 1.3. Processing
- 1.4. Other
-
2. Type
- 2.1. Windows System
- 2.2. Linux System
- 2.3. Other
Process Visualization Software Segmentation By Geography
-
1. North America
- 1.1. United States
- 1.2. Canada
- 1.3. Mexico
-
2. South America
- 2.1. Brazil
- 2.2. Argentina
- 2.3. Rest of South America
-
3. Europe
- 3.1. United Kingdom
- 3.2. Germany
- 3.3. France
- 3.4. Italy
- 3.5. Spain
- 3.6. Russia
- 3.7. Benelux
- 3.8. Nordics
- 3.9. Rest of Europe
-
4. Middle East & Africa
- 4.1. Turkey
- 4.2. Israel
- 4.3. GCC
- 4.4. North Africa
- 4.5. South Africa
- 4.6. Rest of Middle East & Africa
-
5. Asia Pacific
- 5.1. China
- 5.2. India
- 5.3. Japan
- 5.4. South Korea
- 5.5. ASEAN
- 5.6. Oceania
- 5.7. Rest of Asia Pacific

Process Visualization Software Regional Market Share
Geographic Coverage of Process Visualization Software
Process Visualization Software REPORT HIGHLIGHTS
| Aspects | Details |
|---|---|
| Study Period | 2020-2034 |
| Base Year | 2025 |
| Estimated Year | 2026 |
| Forecast Period | 2026-2034 |
| Historical Period | 2020-2025 |
| Growth Rate | CAGR of 9.67% from 2020-2034 |
| Segmentation |
|
Table of Contents
- 1. Introduction
- 1.1. Research Scope
- 1.2. Market Segmentation
- 1.3. Research Objective
- 1.4. Definitions and Assumptions
- 2. Executive Summary
- 2.1. Market Snapshot
- 3. Market Dynamics
- 3.1. Market Drivers
- 3.2. Market Restrains
- 3.3. Market Trends
- 3.4. Market Opportunities
- 4. Market Factor Analysis
- 4.1. Porters Five Forces
- 4.1.1. Bargaining Power of Suppliers
- 4.1.2. Bargaining Power of Buyers
- 4.1.3. Threat of New Entrants
- 4.1.4. Threat of Substitutes
- 4.1.5. Competitive Rivalry
- 4.2. PESTEL analysis
- 4.3. BCG Analysis
- 4.3.1. Stars (High Growth, High Market Share)
- 4.3.2. Cash Cows (Low Growth, High Market Share)
- 4.3.3. Question Mark (High Growth, Low Market Share)
- 4.3.4. Dogs (Low Growth, Low Market Share)
- 4.4. Ansoff Matrix Analysis
- 4.5. Supply Chain Analysis
- 4.6. Regulatory Landscape
- 4.7. Current Market Potential and Opportunity Assessment (TAM–SAM–SOM Framework)
- 4.8. PRI Analyst Note
- 4.1. Porters Five Forces
- 5. Market Analysis, Insights and Forecast 2021-2033
- 5.1. Market Analysis, Insights and Forecast - by Application
- 5.1.1. Building
- 5.1.2. Engineering Drawing
- 5.1.3. Processing
- 5.1.4. Other
- 5.2. Market Analysis, Insights and Forecast - by Type
- 5.2.1. Windows System
- 5.2.2. Linux System
- 5.2.3. Other
- 5.3. Market Analysis, Insights and Forecast - by Region
- 5.3.1. North America
- 5.3.2. South America
- 5.3.3. Europe
- 5.3.4. Middle East & Africa
- 5.3.5. Asia Pacific
- 5.1. Market Analysis, Insights and Forecast - by Application
- 6. Global Process Visualization Software Analysis, Insights and Forecast, 2021-2033
- 6.1. Market Analysis, Insights and Forecast - by Application
- 6.1.1. Building
- 6.1.2. Engineering Drawing
- 6.1.3. Processing
- 6.1.4. Other
- 6.2. Market Analysis, Insights and Forecast - by Type
- 6.2.1. Windows System
- 6.2.2. Linux System
- 6.2.3. Other
- 6.1. Market Analysis, Insights and Forecast - by Application
- 7. North America Process Visualization Software Analysis, Insights and Forecast, 2020-2032
- 7.1. Market Analysis, Insights and Forecast - by Application
- 7.1.1. Building
- 7.1.2. Engineering Drawing
- 7.1.3. Processing
- 7.1.4. Other
- 7.2. Market Analysis, Insights and Forecast - by Type
- 7.2.1. Windows System
- 7.2.2. Linux System
- 7.2.3. Other
- 7.1. Market Analysis, Insights and Forecast - by Application
- 8. South America Process Visualization Software Analysis, Insights and Forecast, 2020-2032
- 8.1. Market Analysis, Insights and Forecast - by Application
- 8.1.1. Building
- 8.1.2. Engineering Drawing
- 8.1.3. Processing
- 8.1.4. Other
- 8.2. Market Analysis, Insights and Forecast - by Type
- 8.2.1. Windows System
- 8.2.2. Linux System
- 8.2.3. Other
- 8.1. Market Analysis, Insights and Forecast - by Application
- 9. Europe Process Visualization Software Analysis, Insights and Forecast, 2020-2032
- 9.1. Market Analysis, Insights and Forecast - by Application
- 9.1.1. Building
- 9.1.2. Engineering Drawing
- 9.1.3. Processing
- 9.1.4. Other
- 9.2. Market Analysis, Insights and Forecast - by Type
- 9.2.1. Windows System
- 9.2.2. Linux System
- 9.2.3. Other
- 9.1. Market Analysis, Insights and Forecast - by Application
- 10. Middle East & Africa Process Visualization Software Analysis, Insights and Forecast, 2020-2032
- 10.1. Market Analysis, Insights and Forecast - by Application
- 10.1.1. Building
- 10.1.2. Engineering Drawing
- 10.1.3. Processing
- 10.1.4. Other
- 10.2. Market Analysis, Insights and Forecast - by Type
- 10.2.1. Windows System
- 10.2.2. Linux System
- 10.2.3. Other
- 10.1. Market Analysis, Insights and Forecast - by Application
- 11. Asia Pacific Process Visualization Software Analysis, Insights and Forecast, 2020-2032
- 11.1. Market Analysis, Insights and Forecast - by Application
- 11.1.1. Building
- 11.1.2. Engineering Drawing
- 11.1.3. Processing
- 11.1.4. Other
- 11.2. Market Analysis, Insights and Forecast - by Type
- 11.2.1. Windows System
- 11.2.2. Linux System
- 11.2.3. Other
- 11.1. Market Analysis, Insights and Forecast - by Application
- 12. Competitive Analysis
- 12.1. Company Profiles
- 12.1.1 APOS GmbH
- 12.1.1.1. Company Overview
- 12.1.1.2. Products
- 12.1.1.3. Company Financials
- 12.1.1.4. SWOT Analysis
- 12.1.2 Thyracont Vacuum Instruments
- 12.1.2.1. Company Overview
- 12.1.2.2. Products
- 12.1.2.3. Company Financials
- 12.1.2.4. SWOT Analysis
- 12.1.3 Moldex3D
- 12.1.3.1. Company Overview
- 12.1.3.2. Products
- 12.1.3.3. Company Financials
- 12.1.3.4. SWOT Analysis
- 12.1.4 BMC Messsysteme GmbH
- 12.1.4.1. Company Overview
- 12.1.4.2. Products
- 12.1.4.3. Company Financials
- 12.1.4.4. SWOT Analysis
- 12.1.5 WONDERWARE
- 12.1.5.1. Company Overview
- 12.1.5.2. Products
- 12.1.5.3. Company Financials
- 12.1.5.4. SWOT Analysis
- 12.1.6 IBM
- 12.1.6.1. Company Overview
- 12.1.6.2. Products
- 12.1.6.3. Company Financials
- 12.1.6.4. SWOT Analysis
- 12.1.7 EUROTHERM PROCESS
- 12.1.7.1. Company Overview
- 12.1.7.2. Products
- 12.1.7.3. Company Financials
- 12.1.7.4. SWOT Analysis
- 12.1.8 ESI GROUP
- 12.1.8.1. Company Overview
- 12.1.8.2. Products
- 12.1.8.3. Company Financials
- 12.1.8.4. SWOT Analysis
- 12.1.9 SourceCode Technology Holdings
- 12.1.9.1. Company Overview
- 12.1.9.2. Products
- 12.1.9.3. Company Financials
- 12.1.9.4. SWOT Analysis
- 12.1.10 LUMEL
- 12.1.10.1. Company Overview
- 12.1.10.2. Products
- 12.1.10.3. Company Financials
- 12.1.10.4. SWOT Analysis
- 12.1.11 ARC Informatique
- 12.1.11.1. Company Overview
- 12.1.11.2. Products
- 12.1.11.3. Company Financials
- 12.1.11.4. SWOT Analysis
- 12.1.12 INTRAVIS GmbH
- 12.1.12.1. Company Overview
- 12.1.12.2. Products
- 12.1.12.3. Company Financials
- 12.1.12.4. SWOT Analysis
- 12.1.13 Beckhoff Automation
- 12.1.13.1. Company Overview
- 12.1.13.2. Products
- 12.1.13.3. Company Financials
- 12.1.13.4. SWOT Analysis
- 12.1.14 Adcon Telemetry
- 12.1.14.1. Company Overview
- 12.1.14.2. Products
- 12.1.14.3. Company Financials
- 12.1.14.4. SWOT Analysis
- 12.1.15 NDC Technologies
- 12.1.15.1. Company Overview
- 12.1.15.2. Products
- 12.1.15.3. Company Financials
- 12.1.15.4. SWOT Analysis
- 12.1.16 AUTODESK
- 12.1.16.1. Company Overview
- 12.1.16.2. Products
- 12.1.16.3. Company Financials
- 12.1.16.4. SWOT Analysis
- 12.1.17 The MathWorks
- 12.1.17.1. Company Overview
- 12.1.17.2. Products
- 12.1.17.3. Company Financials
- 12.1.17.4. SWOT Analysis
- 12.1.18 SIMULIA
- 12.1.18.1. Company Overview
- 12.1.18.2. Products
- 12.1.18.3. Company Financials
- 12.1.18.4. SWOT Analysis
- 12.1.19 Hexagon PPM
- 12.1.19.1. Company Overview
- 12.1.19.2. Products
- 12.1.19.3. Company Financials
- 12.1.19.4. SWOT Analysis
- 12.1.20 Lucid Software
- 12.1.20.1. Company Overview
- 12.1.20.2. Products
- 12.1.20.3. Company Financials
- 12.1.20.4. SWOT Analysis
- 12.1.21 iba AG
- 12.1.21.1. Company Overview
- 12.1.21.2. Products
- 12.1.21.3. Company Financials
- 12.1.21.4. SWOT Analysis
- 12.1.1 APOS GmbH
- 12.2. Market Entropy
- 12.2.1 Company's Key Areas Served
- 12.2.2 Recent Developments
- 12.3. Company Market Share Analysis 2025
- 12.3.1 Top 5 Companies Market Share Analysis
- 12.3.2 Top 3 Companies Market Share Analysis
- 12.4. List of Potential Customers
- 13. Research Methodology
List of Figures
- Figure 1: Global Process Visualization Software Revenue Breakdown (undefined, %) by Region 2025 & 2033
- Figure 2: North America Process Visualization Software Revenue (undefined), by Application 2025 & 2033
- Figure 3: North America Process Visualization Software Revenue Share (%), by Application 2025 & 2033
- Figure 4: North America Process Visualization Software Revenue (undefined), by Type 2025 & 2033
- Figure 5: North America Process Visualization Software Revenue Share (%), by Type 2025 & 2033
- Figure 6: North America Process Visualization Software Revenue (undefined), by Country 2025 & 2033
- Figure 7: North America Process Visualization Software Revenue Share (%), by Country 2025 & 2033
- Figure 8: South America Process Visualization Software Revenue (undefined), by Application 2025 & 2033
- Figure 9: South America Process Visualization Software Revenue Share (%), by Application 2025 & 2033
- Figure 10: South America Process Visualization Software Revenue (undefined), by Type 2025 & 2033
- Figure 11: South America Process Visualization Software Revenue Share (%), by Type 2025 & 2033
- Figure 12: South America Process Visualization Software Revenue (undefined), by Country 2025 & 2033
- Figure 13: South America Process Visualization Software Revenue Share (%), by Country 2025 & 2033
- Figure 14: Europe Process Visualization Software Revenue (undefined), by Application 2025 & 2033
- Figure 15: Europe Process Visualization Software Revenue Share (%), by Application 2025 & 2033
- Figure 16: Europe Process Visualization Software Revenue (undefined), by Type 2025 & 2033
- Figure 17: Europe Process Visualization Software Revenue Share (%), by Type 2025 & 2033
- Figure 18: Europe Process Visualization Software Revenue (undefined), by Country 2025 & 2033
- Figure 19: Europe Process Visualization Software Revenue Share (%), by Country 2025 & 2033
- Figure 20: Middle East & Africa Process Visualization Software Revenue (undefined), by Application 2025 & 2033
- Figure 21: Middle East & Africa Process Visualization Software Revenue Share (%), by Application 2025 & 2033
- Figure 22: Middle East & Africa Process Visualization Software Revenue (undefined), by Type 2025 & 2033
- Figure 23: Middle East & Africa Process Visualization Software Revenue Share (%), by Type 2025 & 2033
- Figure 24: Middle East & Africa Process Visualization Software Revenue (undefined), by Country 2025 & 2033
- Figure 25: Middle East & Africa Process Visualization Software Revenue Share (%), by Country 2025 & 2033
- Figure 26: Asia Pacific Process Visualization Software Revenue (undefined), by Application 2025 & 2033
- Figure 27: Asia Pacific Process Visualization Software Revenue Share (%), by Application 2025 & 2033
- Figure 28: Asia Pacific Process Visualization Software Revenue (undefined), by Type 2025 & 2033
- Figure 29: Asia Pacific Process Visualization Software Revenue Share (%), by Type 2025 & 2033
- Figure 30: Asia Pacific Process Visualization Software Revenue (undefined), by Country 2025 & 2033
- Figure 31: Asia Pacific Process Visualization Software Revenue Share (%), by Country 2025 & 2033
List of Tables
- Table 1: Global Process Visualization Software Revenue undefined Forecast, by Application 2020 & 2033
- Table 2: Global Process Visualization Software Revenue undefined Forecast, by Type 2020 & 2033
- Table 3: Global Process Visualization Software Revenue undefined Forecast, by Region 2020 & 2033
- Table 4: Global Process Visualization Software Revenue undefined Forecast, by Application 2020 & 2033
- Table 5: Global Process Visualization Software Revenue undefined Forecast, by Type 2020 & 2033
- Table 6: Global Process Visualization Software Revenue undefined Forecast, by Country 2020 & 2033
- Table 7: United States Process Visualization Software Revenue (undefined) Forecast, by Application 2020 & 2033
- Table 8: Canada Process Visualization Software Revenue (undefined) Forecast, by Application 2020 & 2033
- Table 9: Mexico Process Visualization Software Revenue (undefined) Forecast, by Application 2020 & 2033
- Table 10: Global Process Visualization Software Revenue undefined Forecast, by Application 2020 & 2033
- Table 11: Global Process Visualization Software Revenue undefined Forecast, by Type 2020 & 2033
- Table 12: Global Process Visualization Software Revenue undefined Forecast, by Country 2020 & 2033
- Table 13: Brazil Process Visualization Software Revenue (undefined) Forecast, by Application 2020 & 2033
- Table 14: Argentina Process Visualization Software Revenue (undefined) Forecast, by Application 2020 & 2033
- Table 15: Rest of South America Process Visualization Software Revenue (undefined) Forecast, by Application 2020 & 2033
- Table 16: Global Process Visualization Software Revenue undefined Forecast, by Application 2020 & 2033
- Table 17: Global Process Visualization Software Revenue undefined Forecast, by Type 2020 & 2033
- Table 18: Global Process Visualization Software Revenue undefined Forecast, by Country 2020 & 2033
- Table 19: United Kingdom Process Visualization Software Revenue (undefined) Forecast, by Application 2020 & 2033
- Table 20: Germany Process Visualization Software Revenue (undefined) Forecast, by Application 2020 & 2033
- Table 21: France Process Visualization Software Revenue (undefined) Forecast, by Application 2020 & 2033
- Table 22: Italy Process Visualization Software Revenue (undefined) Forecast, by Application 2020 & 2033
- Table 23: Spain Process Visualization Software Revenue (undefined) Forecast, by Application 2020 & 2033
- Table 24: Russia Process Visualization Software Revenue (undefined) Forecast, by Application 2020 & 2033
- Table 25: Benelux Process Visualization Software Revenue (undefined) Forecast, by Application 2020 & 2033
- Table 26: Nordics Process Visualization Software Revenue (undefined) Forecast, by Application 2020 & 2033
- Table 27: Rest of Europe Process Visualization Software Revenue (undefined) Forecast, by Application 2020 & 2033
- Table 28: Global Process Visualization Software Revenue undefined Forecast, by Application 2020 & 2033
- Table 29: Global Process Visualization Software Revenue undefined Forecast, by Type 2020 & 2033
- Table 30: Global Process Visualization Software Revenue undefined Forecast, by Country 2020 & 2033
- Table 31: Turkey Process Visualization Software Revenue (undefined) Forecast, by Application 2020 & 2033
- Table 32: Israel Process Visualization Software Revenue (undefined) Forecast, by Application 2020 & 2033
- Table 33: GCC Process Visualization Software Revenue (undefined) Forecast, by Application 2020 & 2033
- Table 34: North Africa Process Visualization Software Revenue (undefined) Forecast, by Application 2020 & 2033
- Table 35: South Africa Process Visualization Software Revenue (undefined) Forecast, by Application 2020 & 2033
- Table 36: Rest of Middle East & Africa Process Visualization Software Revenue (undefined) Forecast, by Application 2020 & 2033
- Table 37: Global Process Visualization Software Revenue undefined Forecast, by Application 2020 & 2033
- Table 38: Global Process Visualization Software Revenue undefined Forecast, by Type 2020 & 2033
- Table 39: Global Process Visualization Software Revenue undefined Forecast, by Country 2020 & 2033
- Table 40: China Process Visualization Software Revenue (undefined) Forecast, by Application 2020 & 2033
- Table 41: India Process Visualization Software Revenue (undefined) Forecast, by Application 2020 & 2033
- Table 42: Japan Process Visualization Software Revenue (undefined) Forecast, by Application 2020 & 2033
- Table 43: South Korea Process Visualization Software Revenue (undefined) Forecast, by Application 2020 & 2033
- Table 44: ASEAN Process Visualization Software Revenue (undefined) Forecast, by Application 2020 & 2033
- Table 45: Oceania Process Visualization Software Revenue (undefined) Forecast, by Application 2020 & 2033
- Table 46: Rest of Asia Pacific Process Visualization Software Revenue (undefined) Forecast, by Application 2020 & 2033
Frequently Asked Questions
1. What is the projected Compound Annual Growth Rate (CAGR) of the Process Visualization Software?
The projected CAGR is approximately 9.67%.
2. Which companies are prominent players in the Process Visualization Software?
Key companies in the market include APOS GmbH, Thyracont Vacuum Instruments, Moldex3D, BMC Messsysteme GmbH, WONDERWARE, IBM, EUROTHERM PROCESS, ESI GROUP, SourceCode Technology Holdings, LUMEL, ARC Informatique, INTRAVIS GmbH, Beckhoff Automation, Adcon Telemetry, NDC Technologies, AUTODESK, The MathWorks, SIMULIA, Hexagon PPM, Lucid Software, iba AG.
3. What are the main segments of the Process Visualization Software?
The market segments include Application, Type.
4. Can you provide details about the market size?
The market size is estimated to be USD XXX N/A as of 2022.
5. What are some drivers contributing to market growth?
N/A
6. What are the notable trends driving market growth?
N/A
7. Are there any restraints impacting market growth?
N/A
8. Can you provide examples of recent developments in the market?
N/A
9. What pricing options are available for accessing the report?
Pricing options include single-user, multi-user, and enterprise licenses priced at USD 3950.00, USD 5925.00, and USD 7900.00 respectively.
10. Is the market size provided in terms of value or volume?
The market size is provided in terms of value, measured in N/A.
11. Are there any specific market keywords associated with the report?
Yes, the market keyword associated with the report is "Process Visualization Software," which aids in identifying and referencing the specific market segment covered.
12. How do I determine which pricing option suits my needs best?
The pricing options vary based on user requirements and access needs. Individual users may opt for single-user licenses, while businesses requiring broader access may choose multi-user or enterprise licenses for cost-effective access to the report.
13. Are there any additional resources or data provided in the Process Visualization Software report?
While the report offers comprehensive insights, it's advisable to review the specific contents or supplementary materials provided to ascertain if additional resources or data are available.
14. How can I stay updated on further developments or reports in the Process Visualization Software?
To stay informed about further developments, trends, and reports in the Process Visualization Software, consider subscribing to industry newsletters, following relevant companies and organizations, or regularly checking reputable industry news sources and publications.
Methodology
Step 1 - Identification of Relevant Samples Size from Population Database


Step 2 - Approaches for Defining Global Market Size (Value, Volume* & Price*)

Note*: In applicable scenarios
Step 3 - Data Sources
Primary Research
- Web Analytics
- Survey Reports
- Research Institute
- Latest Research Reports
- Opinion Leaders
Secondary Research
- Annual Reports
- White Paper
- Latest Press Release
- Industry Association
- Paid Database
- Investor Presentations

Step 4 - Data Triangulation
Involves using different sources of information in order to increase the validity of a study
These sources are likely to be stakeholders in a program - participants, other researchers, program staff, other community members, and so on.
Then we put all data in single framework & apply various statistical tools to find out the dynamic on the market.
During the analysis stage, feedback from the stakeholder groups would be compared to determine areas of agreement as well as areas of divergence