

Key Insights
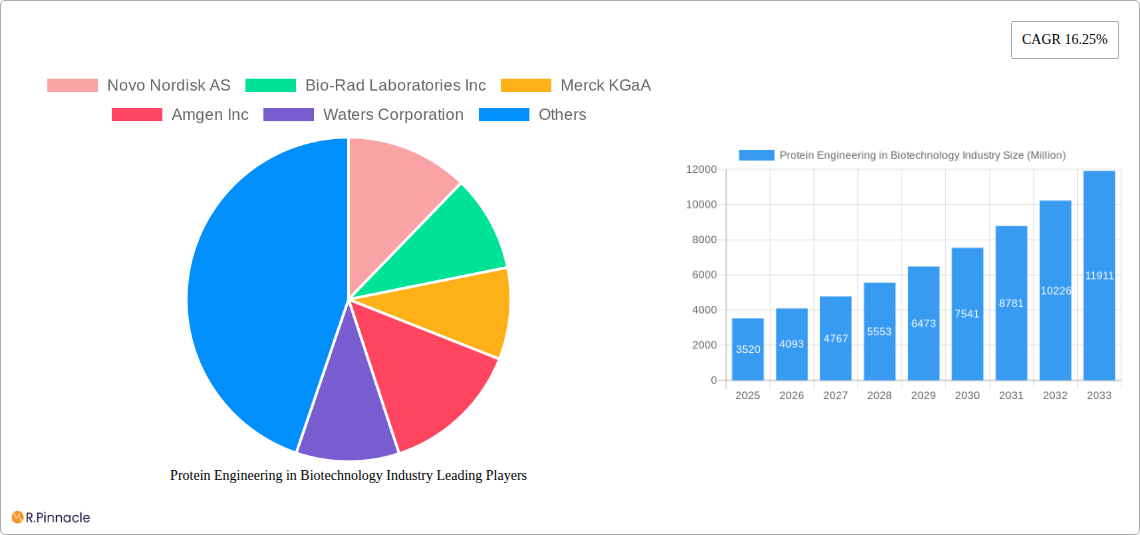
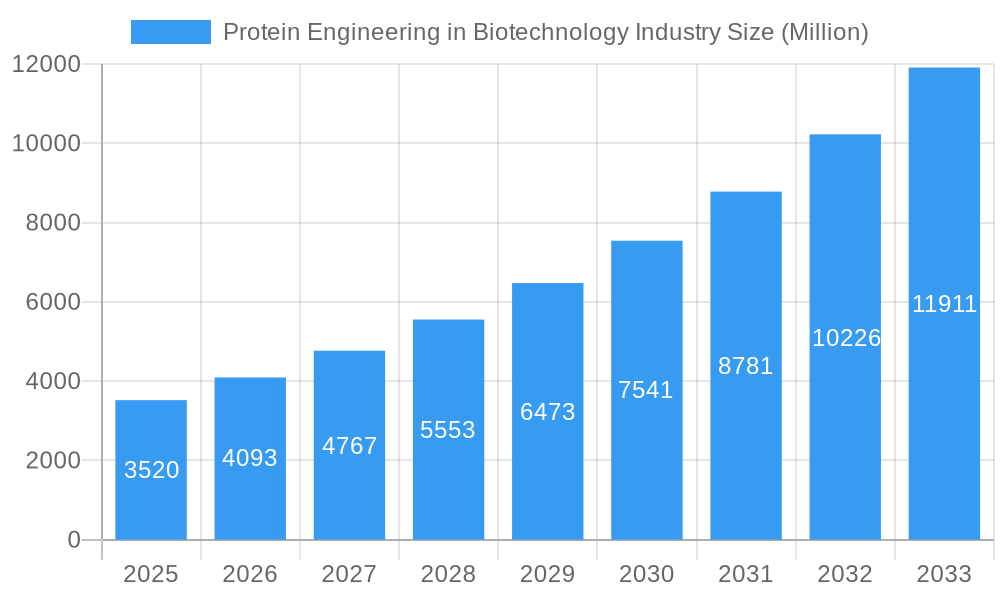
The global Protein Engineering in Biotechnology market is poised for significant expansion, driven by its pivotal role in developing advanced therapeutics, diagnostics, and industrial applications. With a current estimated market size of $3,520 million in the base year of 2025, the industry is projected to experience a robust compound annual growth rate (CAGR) of 16.25% during the forecast period of 2025-2033. This remarkable growth is fueled by the increasing demand for biopharmaceuticals, including insulin, monoclonal antibodies, and vaccines, which rely heavily on sophisticated protein engineering techniques for their development and optimization. The intricate process of designing and producing proteins with novel or enhanced functions is at the heart of breakthroughs in treating chronic diseases, infectious diseases, and genetic disorders. Furthermore, advancements in irrational and rational protein design technologies are continually expanding the capabilities and applications of protein engineering, making it an indispensable tool for innovation across the biotechnology sector.
Protein Engineering in Biotechnology Industry Market Size (In Billion)
The market's expansion is also propelled by a surge in research and development activities undertaken by pharmaceutical and biotechnology companies, academic institutions, and contract research organizations. These entities are leveraging protein engineering to create more effective and targeted therapies, leading to improved patient outcomes and a growing demand for specialized protein-based products. Key market drivers include the escalating prevalence of chronic diseases globally, the continuous pursuit of novel drug discovery, and the growing adoption of personalized medicine approaches. While the protein engineering landscape is characterized by rapid innovation and a strong growth trajectory, potential restraints may emerge from the complex regulatory pathways for novel protein-based products and the high costs associated with cutting-edge research and development. Nevertheless, the overarching trend points towards a dynamic and flourishing market, with substantial investment and a clear path for sustained growth driven by scientific advancement and therapeutic needs.
Protein Engineering in Biotechnology Industry Company Market Share
This comprehensive report provides an in-depth analysis of the Protein Engineering in Biotechnology Industry market, crucial for stakeholders seeking to understand its current landscape and future trajectory. Leveraging advanced data analytics and expert insights, this report covers market structure, dynamics, regional dominance, product innovations, key drivers, challenges, emerging opportunities, leading players, and recent developments. The study encompasses the historical period from 2019 to 2024, a base year of 2025, and a forecast period extending to 2033, offering a robust outlook for strategic decision-making. The market is projected to reach $XX Million by 2025 and grow at a Compound Annual Growth Rate (CAGR) of XX% from 2025 to 2033.
Protein Engineering in Biotechnology Industry Market Structure & Innovation Trends
The protein engineering market exhibits a moderate concentration, with key players like Novo Nordisk AS, Amgen Inc., Eli Lilly and Company, and Thermo Fisher Scientific Inc. holding significant market shares, estimated to be around XX% combined. Innovation is primarily driven by advancements in computational protein design, synthetic biology, and high-throughput screening techniques. The regulatory framework, overseen by bodies like the FDA and EMA, plays a critical role in shaping product development and market entry. Product substitutes, while present in some therapeutic areas, are increasingly being challenged by the specificity and efficacy of engineered proteins. The end-user demographic is predominantly Pharmaceutical and Biotechnology Companies (XX% market share), followed by Academic Institutions and Contract Research Organizations. Mergers and acquisitions (M&A) activities are a significant feature, with recent deals valued at over $XX Million aimed at consolidating market positions and acquiring novel technologies.
Protein Engineering in Biotechnology Industry Market Dynamics & Trends
The Protein Engineering in Biotechnology Industry is experiencing robust growth, propelled by an increasing demand for targeted therapeutics and novel biomaterials. Market growth drivers include the rising prevalence of chronic diseases such as diabetes, cancer, and autoimmune disorders, necessitating the development of advanced protein-based drugs. Technological disruptions, particularly in artificial intelligence (AI) and machine learning (ML) for protein design and optimization, are accelerating the discovery and development pipelines. Consumer preferences are shifting towards personalized medicine and highly effective treatments, which protein engineering is uniquely positioned to deliver. Competitive dynamics are characterized by intense R&D efforts, strategic collaborations, and a focus on intellectual property protection. The market penetration of protein-engineered products is steadily increasing, with an estimated XX% penetration in key therapeutic areas by 2025. The market is projected to grow from an estimated $XX Million in 2025 to $XX Million by 2033, exhibiting a CAGR of XX% during the forecast period. The increasing investment in biotechnology research and development, coupled with favorable government initiatives, further fuels this expansion. The development of novel protein-based vaccines and enzyme therapies also contributes significantly to the market's upward trajectory.
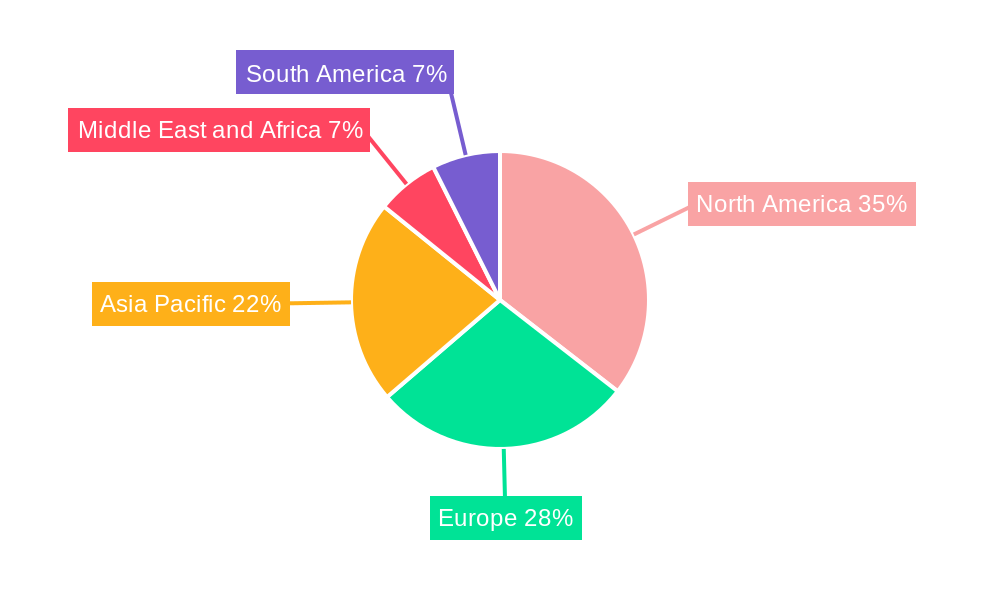
Dominant Regions & Segments in Protein Engineering in Biotechnology Industry
North America currently dominates the Protein Engineering in Biotechnology Industry market, driven by its strong presence of leading pharmaceutical and biotechnology companies, extensive R&D infrastructure, and significant venture capital investments. The United States, in particular, plays a pivotal role due to its supportive regulatory environment and a high concentration of academic institutions at the forefront of scientific innovation.
- Product Type Dominance: Monoclonal Antibodies represent the largest segment, accounting for an estimated XX% of the market share. This dominance is fueled by their widespread application in treating cancer, autoimmune diseases, and infectious diseases. Insulin is another substantial segment, driven by the global rise in diabetes prevalence. Vaccines are also witnessing significant growth due to advancements in protein-based vaccine development for emerging infectious diseases.
- Technology Dominance: Rational Protein Design holds a larger market share, estimated at XX%, due to its precision and predictability in engineering proteins with desired functions. However, Irrational Protein Design, employing directed evolution and high-throughput screening, is rapidly gaining traction and is expected to show higher growth rates as computational tools become more sophisticated.
- End User Dominance: Pharmaceutical and Biotechnology Companies are the primary end-users, comprising approximately XX% of the market. Their extensive research and development capabilities and the commercialization of protein-engineered therapeutics drive this segment. Academic Institutions are crucial for fundamental research and early-stage innovation, while Contract Research Organizations (CROs) provide specialized services and support the R&D efforts of larger companies.
The Asia Pacific region is emerging as a significant growth market, owing to increasing investments in biotechnology, a growing domestic demand for advanced therapeutics, and the presence of emerging players like GenScript Biotech Corporation. Key drivers for regional dominance include economic policies supporting biotech innovation, robust intellectual property protection, and advancements in manufacturing capabilities.
Protein Engineering in Biotechnology Industry Product Innovations
Product innovations in protein engineering are revolutionizing therapeutic development and industrial applications. The creation of highly specific monoclonal antibodies with enhanced efficacy and reduced side effects, such as those used in oncology and immunology, is a prime example. Advancements in designing novel enzymes for industrial processes, like biofuel production and waste degradation, are expanding the market's reach beyond healthcare. The development of self-assembling protein-based nanomaterials for drug delivery systems offers new avenues for targeted therapy. These innovations leverage cutting-edge technologies like AI-driven design and directed evolution, providing significant competitive advantages by improving protein stability, activity, and specificity.
Report Scope & Segmentation Analysis
This report meticulously segments the Protein Engineering in Biotechnology Industry market across key categories for a comprehensive understanding.
- Product Type: The analysis covers Insulin, Monoclonal Antibodies, Coagulation Factors, Vaccines, Growth Factors, and Other Product Types. Monoclonal Antibodies are projected to maintain a leading market position with a growth rate of XX% during the forecast period.
- Technology: Segmentation includes Irrational Protein Design and Rational Protein Design. Rational Protein Design is expected to hold a larger market share, while Irrational Protein Design is anticipated to exhibit a higher CAGR of XX%, driven by advancements in AI and machine learning.
- End User: The market is segmented into Pharmaceutical and Biotechnology Companies, Academic Institutions, and Contract Research Organizations. Pharmaceutical and Biotechnology Companies are expected to remain the dominant end-users, with a projected market share of XX% and a CAGR of XX%.
Key Drivers of Protein Engineering in Biotechnology Industry Growth
The growth of the protein engineering market is significantly influenced by several key factors. The escalating burden of chronic and genetic diseases worldwide creates a persistent demand for advanced, targeted protein-based therapeutics. Rapid advancements in biotechnology, particularly in areas like genomics, proteomics, and computational biology, are enabling more precise and efficient protein design. Furthermore, substantial investments in research and development by both public and private entities, coupled with favorable government policies promoting biopharmaceutical innovation, are accelerating market expansion. The increasing adoption of personalized medicine approaches further amplifies the need for customized protein therapies.
Challenges in the Protein Engineering in Biotechnology Industry Sector
Despite its promising growth, the protein engineering sector faces several challenges. The complex and lengthy regulatory approval processes for novel protein-based drugs can be a significant barrier, increasing development costs and time-to-market. Supply chain complexities for specialized reagents and manufacturing processes can also pose logistical hurdles. Intense competition among established players and emerging startups, along with the high cost of research and development, puts pressure on profitability. Furthermore, challenges in protein expression, purification, and stability for certain applications require continuous innovation.
Emerging Opportunities in Protein Engineering in Biotechnology Industry
The protein engineering landscape is ripe with emerging opportunities. The development of protein-based bioplastics and bio-based chemicals presents a sustainable alternative to traditional petrochemical products. Advances in protein engineering for agricultural applications, such as enhancing crop resilience and developing bio-pesticides, offer significant growth potential. The use of engineered proteins in diagnostics, particularly for early disease detection and personalized monitoring, is another rapidly expanding area. Furthermore, the growing interest in enzyme engineering for environmental remediation, including the breakdown of pollutants and plastic waste, opens up new markets.
Leading Players in the Protein Engineering in Biotechnology Industry Market
- Novo Nordisk AS
- Bio-Rad Laboratories Inc
- Merck KGaA
- Amgen Inc
- Waters Corporation
- Thermo Fisher Scientific Inc
- Eli Lilly and Company
- GenScript Biotech Corporation
- Agilent Technologies Inc
- PerkinElmer Inc
- Bruker Corporation
- GE HealthCare
Key Developments in Protein Engineering in Biotechnology Industry Industry
- April 2024: Northpond-funded Laboratory for Bioengineering Research and Innovation made an investment with the Wyss Institute for the AmnioX project to facilitate the development of protein-based drugs, thus improving the accessibility of medicines to patients.
- March 2023: Arzeda collaborated with Takeda to leverage artificial intelligence-based protein design technology to boost the optimization of protein biologics. This collaboration is likely to enhance therapeutic protein development and its products.
Future Outlook for Protein Engineering in Biotechnology Industry Market
The future outlook for the Protein Engineering in Biotechnology Industry market is exceptionally bright. Continued advancements in AI and machine learning will further accelerate the design and discovery of novel protein therapeutics and industrial enzymes, leading to faster development cycles and reduced costs. The increasing focus on personalized medicine will drive demand for highly specific and tailored protein-based treatments. Expansion into new application areas, such as regenerative medicine, advanced biomaterials, and sustainable industrial processes, will unlock significant market potential. Strategic collaborations and partnerships between research institutions and industry players will foster innovation and market penetration, solidifying protein engineering's role as a cornerstone of the modern biotechnology landscape. The market is poised for sustained growth, driven by its ability to address unmet medical needs and contribute to a more sustainable future.
Protein Engineering in Biotechnology Industry Segmentation
-
1. Product Type
- 1.1. Insulin
- 1.2. Monoclonal Antibodies
- 1.3. Coagulation Factors
- 1.4. Vaccines
- 1.5. Growth Factors
- 1.6. Other Product Types
-
2. Technology
- 2.1. Irrational Protein Design
- 2.2. Rational Protein Design
-
3. End User
- 3.1. Pharmaceutical and Biotechnology Companies
- 3.2. Academic Institutions
- 3.3. Contract Research Organizations
Protein Engineering in Biotechnology Industry Segmentation By Geography
-
1. North America
- 1.1. United States
- 1.2. Canada
- 1.3. Mexico
-
2. Europe
- 2.1. Germany
- 2.2. United Kingdom
- 2.3. France
- 2.4. Italy
- 2.5. Spain
- 2.6. Rest of Europe
-
3. Asia Pacific
- 3.1. China
- 3.2. Japan
- 3.3. India
- 3.4. Australia
- 3.5. South Korea
- 3.6. Rest of Asia Pacific
-
4. Middle East and Africa
- 4.1. GCC
- 4.2. South Africa
- 4.3. Rest of Middle East and Africa
-
5. South America
- 5.1. Brazil
- 5.2. Argentina
- 5.3. Rest of South America
Protein Engineering in Biotechnology Industry Regional Market Share
Geographic Coverage of Protein Engineering in Biotechnology Industry
Protein Engineering in Biotechnology Industry REPORT HIGHLIGHTS
| Aspects | Details |
|---|---|
| Study Period | 2020-2034 |
| Base Year | 2025 |
| Estimated Year | 2026 |
| Forecast Period | 2026-2034 |
| Historical Period | 2020-2025 |
| Growth Rate | CAGR of 16.25% from 2020-2034 |
| Segmentation |
|
Table of Contents
- 1. Introduction
- 1.1. Research Scope
- 1.2. Market Segmentation
- 1.3. Research Objective
- 1.4. Definitions and Assumptions
- 2. Executive Summary
- 2.1. Market Snapshot
- 3. Market Dynamics
- 3.1. Market Drivers
- 3.2. Market Restrains
- 3.3. Market Trends
- 3.4. Market Opportunities
- 4. Market Factor Analysis
- 4.1. Porters Five Forces
- 4.1.1. Bargaining Power of Suppliers
- 4.1.2. Bargaining Power of Buyers
- 4.1.3. Threat of New Entrants
- 4.1.4. Threat of Substitutes
- 4.1.5. Competitive Rivalry
- 4.2. PESTEL analysis
- 4.3. BCG Analysis
- 4.3.1. Stars (High Growth, High Market Share)
- 4.3.2. Cash Cows (Low Growth, High Market Share)
- 4.3.3. Question Mark (High Growth, Low Market Share)
- 4.3.4. Dogs (Low Growth, Low Market Share)
- 4.4. Ansoff Matrix Analysis
- 4.5. Supply Chain Analysis
- 4.6. Regulatory Landscape
- 4.7. Current Market Potential and Opportunity Assessment (TAM–SAM–SOM Framework)
- 4.8. PRI Analyst Note
- 4.1. Porters Five Forces
- 5. Market Analysis, Insights and Forecast 2021-2033
- 5.1. Market Analysis, Insights and Forecast - by Product Type
- 5.1.1. Insulin
- 5.1.2. Monoclonal Antibodies
- 5.1.3. Coagulation Factors
- 5.1.4. Vaccines
- 5.1.5. Growth Factors
- 5.1.6. Other Product Types
- 5.2. Market Analysis, Insights and Forecast - by Technology
- 5.2.1. Irrational Protein Design
- 5.2.2. Rational Protein Design
- 5.3. Market Analysis, Insights and Forecast - by End User
- 5.3.1. Pharmaceutical and Biotechnology Companies
- 5.3.2. Academic Institutions
- 5.3.3. Contract Research Organizations
- 5.4. Market Analysis, Insights and Forecast - by Region
- 5.4.1. North America
- 5.4.2. Europe
- 5.4.3. Asia Pacific
- 5.4.4. Middle East and Africa
- 5.4.5. South America
- 5.1. Market Analysis, Insights and Forecast - by Product Type
- 6. Global Protein Engineering in Biotechnology Industry Analysis, Insights and Forecast, 2021-2033
- 6.1. Market Analysis, Insights and Forecast - by Product Type
- 6.1.1. Insulin
- 6.1.2. Monoclonal Antibodies
- 6.1.3. Coagulation Factors
- 6.1.4. Vaccines
- 6.1.5. Growth Factors
- 6.1.6. Other Product Types
- 6.2. Market Analysis, Insights and Forecast - by Technology
- 6.2.1. Irrational Protein Design
- 6.2.2. Rational Protein Design
- 6.3. Market Analysis, Insights and Forecast - by End User
- 6.3.1. Pharmaceutical and Biotechnology Companies
- 6.3.2. Academic Institutions
- 6.3.3. Contract Research Organizations
- 6.1. Market Analysis, Insights and Forecast - by Product Type
- 7. North America Protein Engineering in Biotechnology Industry Analysis, Insights and Forecast, 2020-2032
- 7.1. Market Analysis, Insights and Forecast - by Product Type
- 7.1.1. Insulin
- 7.1.2. Monoclonal Antibodies
- 7.1.3. Coagulation Factors
- 7.1.4. Vaccines
- 7.1.5. Growth Factors
- 7.1.6. Other Product Types
- 7.2. Market Analysis, Insights and Forecast - by Technology
- 7.2.1. Irrational Protein Design
- 7.2.2. Rational Protein Design
- 7.3. Market Analysis, Insights and Forecast - by End User
- 7.3.1. Pharmaceutical and Biotechnology Companies
- 7.3.2. Academic Institutions
- 7.3.3. Contract Research Organizations
- 7.1. Market Analysis, Insights and Forecast - by Product Type
- 8. Europe Protein Engineering in Biotechnology Industry Analysis, Insights and Forecast, 2020-2032
- 8.1. Market Analysis, Insights and Forecast - by Product Type
- 8.1.1. Insulin
- 8.1.2. Monoclonal Antibodies
- 8.1.3. Coagulation Factors
- 8.1.4. Vaccines
- 8.1.5. Growth Factors
- 8.1.6. Other Product Types
- 8.2. Market Analysis, Insights and Forecast - by Technology
- 8.2.1. Irrational Protein Design
- 8.2.2. Rational Protein Design
- 8.3. Market Analysis, Insights and Forecast - by End User
- 8.3.1. Pharmaceutical and Biotechnology Companies
- 8.3.2. Academic Institutions
- 8.3.3. Contract Research Organizations
- 8.1. Market Analysis, Insights and Forecast - by Product Type
- 9. Asia Pacific Protein Engineering in Biotechnology Industry Analysis, Insights and Forecast, 2020-2032
- 9.1. Market Analysis, Insights and Forecast - by Product Type
- 9.1.1. Insulin
- 9.1.2. Monoclonal Antibodies
- 9.1.3. Coagulation Factors
- 9.1.4. Vaccines
- 9.1.5. Growth Factors
- 9.1.6. Other Product Types
- 9.2. Market Analysis, Insights and Forecast - by Technology
- 9.2.1. Irrational Protein Design
- 9.2.2. Rational Protein Design
- 9.3. Market Analysis, Insights and Forecast - by End User
- 9.3.1. Pharmaceutical and Biotechnology Companies
- 9.3.2. Academic Institutions
- 9.3.3. Contract Research Organizations
- 9.1. Market Analysis, Insights and Forecast - by Product Type
- 10. Middle East and Africa Protein Engineering in Biotechnology Industry Analysis, Insights and Forecast, 2020-2032
- 10.1. Market Analysis, Insights and Forecast - by Product Type
- 10.1.1. Insulin
- 10.1.2. Monoclonal Antibodies
- 10.1.3. Coagulation Factors
- 10.1.4. Vaccines
- 10.1.5. Growth Factors
- 10.1.6. Other Product Types
- 10.2. Market Analysis, Insights and Forecast - by Technology
- 10.2.1. Irrational Protein Design
- 10.2.2. Rational Protein Design
- 10.3. Market Analysis, Insights and Forecast - by End User
- 10.3.1. Pharmaceutical and Biotechnology Companies
- 10.3.2. Academic Institutions
- 10.3.3. Contract Research Organizations
- 10.1. Market Analysis, Insights and Forecast - by Product Type
- 11. South America Protein Engineering in Biotechnology Industry Analysis, Insights and Forecast, 2020-2032
- 11.1. Market Analysis, Insights and Forecast - by Product Type
- 11.1.1. Insulin
- 11.1.2. Monoclonal Antibodies
- 11.1.3. Coagulation Factors
- 11.1.4. Vaccines
- 11.1.5. Growth Factors
- 11.1.6. Other Product Types
- 11.2. Market Analysis, Insights and Forecast - by Technology
- 11.2.1. Irrational Protein Design
- 11.2.2. Rational Protein Design
- 11.3. Market Analysis, Insights and Forecast - by End User
- 11.3.1. Pharmaceutical and Biotechnology Companies
- 11.3.2. Academic Institutions
- 11.3.3. Contract Research Organizations
- 11.1. Market Analysis, Insights and Forecast - by Product Type
- 12. Competitive Analysis
- 12.1. Company Profiles
- 12.1.1 Novo Nordisk AS
- 12.1.1.1. Company Overview
- 12.1.1.2. Products
- 12.1.1.3. Company Financials
- 12.1.1.4. SWOT Analysis
- 12.1.2 Bio-Rad Laboratories Inc
- 12.1.2.1. Company Overview
- 12.1.2.2. Products
- 12.1.2.3. Company Financials
- 12.1.2.4. SWOT Analysis
- 12.1.3 Merck KGaA
- 12.1.3.1. Company Overview
- 12.1.3.2. Products
- 12.1.3.3. Company Financials
- 12.1.3.4. SWOT Analysis
- 12.1.4 Amgen Inc
- 12.1.4.1. Company Overview
- 12.1.4.2. Products
- 12.1.4.3. Company Financials
- 12.1.4.4. SWOT Analysis
- 12.1.5 Waters Corporation
- 12.1.5.1. Company Overview
- 12.1.5.2. Products
- 12.1.5.3. Company Financials
- 12.1.5.4. SWOT Analysis
- 12.1.6 Thermo Fisher Scientific Inc
- 12.1.6.1. Company Overview
- 12.1.6.2. Products
- 12.1.6.3. Company Financials
- 12.1.6.4. SWOT Analysis
- 12.1.7 Eli Lilly and Company
- 12.1.7.1. Company Overview
- 12.1.7.2. Products
- 12.1.7.3. Company Financials
- 12.1.7.4. SWOT Analysis
- 12.1.8 GenScript Biotech Corporation
- 12.1.8.1. Company Overview
- 12.1.8.2. Products
- 12.1.8.3. Company Financials
- 12.1.8.4. SWOT Analysis
- 12.1.9 Agilent Technologies Inc
- 12.1.9.1. Company Overview
- 12.1.9.2. Products
- 12.1.9.3. Company Financials
- 12.1.9.4. SWOT Analysis
- 12.1.10 PerkinElmer Inc
- 12.1.10.1. Company Overview
- 12.1.10.2. Products
- 12.1.10.3. Company Financials
- 12.1.10.4. SWOT Analysis
- 12.1.11 Bruker Corporation
- 12.1.11.1. Company Overview
- 12.1.11.2. Products
- 12.1.11.3. Company Financials
- 12.1.11.4. SWOT Analysis
- 12.1.12 GE HealthCare
- 12.1.12.1. Company Overview
- 12.1.12.2. Products
- 12.1.12.3. Company Financials
- 12.1.12.4. SWOT Analysis
- 12.1.1 Novo Nordisk AS
- 12.2. Market Entropy
- 12.2.1 Company's Key Areas Served
- 12.2.2 Recent Developments
- 12.3. Company Market Share Analysis 2025
- 12.3.1 Top 5 Companies Market Share Analysis
- 12.3.2 Top 3 Companies Market Share Analysis
- 12.4. List of Potential Customers
- 13. Research Methodology
List of Figures
- Figure 1: Global Protein Engineering in Biotechnology Industry Revenue Breakdown (Million, %) by Region 2025 & 2033
- Figure 2: Global Protein Engineering in Biotechnology Industry Volume Breakdown (K Unit, %) by Region 2025 & 2033
- Figure 3: North America Protein Engineering in Biotechnology Industry Revenue (Million), by Product Type 2025 & 2033
- Figure 4: North America Protein Engineering in Biotechnology Industry Volume (K Unit), by Product Type 2025 & 2033
- Figure 5: North America Protein Engineering in Biotechnology Industry Revenue Share (%), by Product Type 2025 & 2033
- Figure 6: North America Protein Engineering in Biotechnology Industry Volume Share (%), by Product Type 2025 & 2033
- Figure 7: North America Protein Engineering in Biotechnology Industry Revenue (Million), by Technology 2025 & 2033
- Figure 8: North America Protein Engineering in Biotechnology Industry Volume (K Unit), by Technology 2025 & 2033
- Figure 9: North America Protein Engineering in Biotechnology Industry Revenue Share (%), by Technology 2025 & 2033
- Figure 10: North America Protein Engineering in Biotechnology Industry Volume Share (%), by Technology 2025 & 2033
- Figure 11: North America Protein Engineering in Biotechnology Industry Revenue (Million), by End User 2025 & 2033
- Figure 12: North America Protein Engineering in Biotechnology Industry Volume (K Unit), by End User 2025 & 2033
- Figure 13: North America Protein Engineering in Biotechnology Industry Revenue Share (%), by End User 2025 & 2033
- Figure 14: North America Protein Engineering in Biotechnology Industry Volume Share (%), by End User 2025 & 2033
- Figure 15: North America Protein Engineering in Biotechnology Industry Revenue (Million), by Country 2025 & 2033
- Figure 16: North America Protein Engineering in Biotechnology Industry Volume (K Unit), by Country 2025 & 2033
- Figure 17: North America Protein Engineering in Biotechnology Industry Revenue Share (%), by Country 2025 & 2033
- Figure 18: North America Protein Engineering in Biotechnology Industry Volume Share (%), by Country 2025 & 2033
- Figure 19: Europe Protein Engineering in Biotechnology Industry Revenue (Million), by Product Type 2025 & 2033
- Figure 20: Europe Protein Engineering in Biotechnology Industry Volume (K Unit), by Product Type 2025 & 2033
- Figure 21: Europe Protein Engineering in Biotechnology Industry Revenue Share (%), by Product Type 2025 & 2033
- Figure 22: Europe Protein Engineering in Biotechnology Industry Volume Share (%), by Product Type 2025 & 2033
- Figure 23: Europe Protein Engineering in Biotechnology Industry Revenue (Million), by Technology 2025 & 2033
- Figure 24: Europe Protein Engineering in Biotechnology Industry Volume (K Unit), by Technology 2025 & 2033
- Figure 25: Europe Protein Engineering in Biotechnology Industry Revenue Share (%), by Technology 2025 & 2033
- Figure 26: Europe Protein Engineering in Biotechnology Industry Volume Share (%), by Technology 2025 & 2033
- Figure 27: Europe Protein Engineering in Biotechnology Industry Revenue (Million), by End User 2025 & 2033
- Figure 28: Europe Protein Engineering in Biotechnology Industry Volume (K Unit), by End User 2025 & 2033
- Figure 29: Europe Protein Engineering in Biotechnology Industry Revenue Share (%), by End User 2025 & 2033
- Figure 30: Europe Protein Engineering in Biotechnology Industry Volume Share (%), by End User 2025 & 2033
- Figure 31: Europe Protein Engineering in Biotechnology Industry Revenue (Million), by Country 2025 & 2033
- Figure 32: Europe Protein Engineering in Biotechnology Industry Volume (K Unit), by Country 2025 & 2033
- Figure 33: Europe Protein Engineering in Biotechnology Industry Revenue Share (%), by Country 2025 & 2033
- Figure 34: Europe Protein Engineering in Biotechnology Industry Volume Share (%), by Country 2025 & 2033
- Figure 35: Asia Pacific Protein Engineering in Biotechnology Industry Revenue (Million), by Product Type 2025 & 2033
- Figure 36: Asia Pacific Protein Engineering in Biotechnology Industry Volume (K Unit), by Product Type 2025 & 2033
- Figure 37: Asia Pacific Protein Engineering in Biotechnology Industry Revenue Share (%), by Product Type 2025 & 2033
- Figure 38: Asia Pacific Protein Engineering in Biotechnology Industry Volume Share (%), by Product Type 2025 & 2033
- Figure 39: Asia Pacific Protein Engineering in Biotechnology Industry Revenue (Million), by Technology 2025 & 2033
- Figure 40: Asia Pacific Protein Engineering in Biotechnology Industry Volume (K Unit), by Technology 2025 & 2033
- Figure 41: Asia Pacific Protein Engineering in Biotechnology Industry Revenue Share (%), by Technology 2025 & 2033
- Figure 42: Asia Pacific Protein Engineering in Biotechnology Industry Volume Share (%), by Technology 2025 & 2033
- Figure 43: Asia Pacific Protein Engineering in Biotechnology Industry Revenue (Million), by End User 2025 & 2033
- Figure 44: Asia Pacific Protein Engineering in Biotechnology Industry Volume (K Unit), by End User 2025 & 2033
- Figure 45: Asia Pacific Protein Engineering in Biotechnology Industry Revenue Share (%), by End User 2025 & 2033
- Figure 46: Asia Pacific Protein Engineering in Biotechnology Industry Volume Share (%), by End User 2025 & 2033
- Figure 47: Asia Pacific Protein Engineering in Biotechnology Industry Revenue (Million), by Country 2025 & 2033
- Figure 48: Asia Pacific Protein Engineering in Biotechnology Industry Volume (K Unit), by Country 2025 & 2033
- Figure 49: Asia Pacific Protein Engineering in Biotechnology Industry Revenue Share (%), by Country 2025 & 2033
- Figure 50: Asia Pacific Protein Engineering in Biotechnology Industry Volume Share (%), by Country 2025 & 2033
- Figure 51: Middle East and Africa Protein Engineering in Biotechnology Industry Revenue (Million), by Product Type 2025 & 2033
- Figure 52: Middle East and Africa Protein Engineering in Biotechnology Industry Volume (K Unit), by Product Type 2025 & 2033
- Figure 53: Middle East and Africa Protein Engineering in Biotechnology Industry Revenue Share (%), by Product Type 2025 & 2033
- Figure 54: Middle East and Africa Protein Engineering in Biotechnology Industry Volume Share (%), by Product Type 2025 & 2033
- Figure 55: Middle East and Africa Protein Engineering in Biotechnology Industry Revenue (Million), by Technology 2025 & 2033
- Figure 56: Middle East and Africa Protein Engineering in Biotechnology Industry Volume (K Unit), by Technology 2025 & 2033
- Figure 57: Middle East and Africa Protein Engineering in Biotechnology Industry Revenue Share (%), by Technology 2025 & 2033
- Figure 58: Middle East and Africa Protein Engineering in Biotechnology Industry Volume Share (%), by Technology 2025 & 2033
- Figure 59: Middle East and Africa Protein Engineering in Biotechnology Industry Revenue (Million), by End User 2025 & 2033
- Figure 60: Middle East and Africa Protein Engineering in Biotechnology Industry Volume (K Unit), by End User 2025 & 2033
- Figure 61: Middle East and Africa Protein Engineering in Biotechnology Industry Revenue Share (%), by End User 2025 & 2033
- Figure 62: Middle East and Africa Protein Engineering in Biotechnology Industry Volume Share (%), by End User 2025 & 2033
- Figure 63: Middle East and Africa Protein Engineering in Biotechnology Industry Revenue (Million), by Country 2025 & 2033
- Figure 64: Middle East and Africa Protein Engineering in Biotechnology Industry Volume (K Unit), by Country 2025 & 2033
- Figure 65: Middle East and Africa Protein Engineering in Biotechnology Industry Revenue Share (%), by Country 2025 & 2033
- Figure 66: Middle East and Africa Protein Engineering in Biotechnology Industry Volume Share (%), by Country 2025 & 2033
- Figure 67: South America Protein Engineering in Biotechnology Industry Revenue (Million), by Product Type 2025 & 2033
- Figure 68: South America Protein Engineering in Biotechnology Industry Volume (K Unit), by Product Type 2025 & 2033
- Figure 69: South America Protein Engineering in Biotechnology Industry Revenue Share (%), by Product Type 2025 & 2033
- Figure 70: South America Protein Engineering in Biotechnology Industry Volume Share (%), by Product Type 2025 & 2033
- Figure 71: South America Protein Engineering in Biotechnology Industry Revenue (Million), by Technology 2025 & 2033
- Figure 72: South America Protein Engineering in Biotechnology Industry Volume (K Unit), by Technology 2025 & 2033
- Figure 73: South America Protein Engineering in Biotechnology Industry Revenue Share (%), by Technology 2025 & 2033
- Figure 74: South America Protein Engineering in Biotechnology Industry Volume Share (%), by Technology 2025 & 2033
- Figure 75: South America Protein Engineering in Biotechnology Industry Revenue (Million), by End User 2025 & 2033
- Figure 76: South America Protein Engineering in Biotechnology Industry Volume (K Unit), by End User 2025 & 2033
- Figure 77: South America Protein Engineering in Biotechnology Industry Revenue Share (%), by End User 2025 & 2033
- Figure 78: South America Protein Engineering in Biotechnology Industry Volume Share (%), by End User 2025 & 2033
- Figure 79: South America Protein Engineering in Biotechnology Industry Revenue (Million), by Country 2025 & 2033
- Figure 80: South America Protein Engineering in Biotechnology Industry Volume (K Unit), by Country 2025 & 2033
- Figure 81: South America Protein Engineering in Biotechnology Industry Revenue Share (%), by Country 2025 & 2033
- Figure 82: South America Protein Engineering in Biotechnology Industry Volume Share (%), by Country 2025 & 2033
List of Tables
- Table 1: Global Protein Engineering in Biotechnology Industry Revenue Million Forecast, by Product Type 2020 & 2033
- Table 2: Global Protein Engineering in Biotechnology Industry Volume K Unit Forecast, by Product Type 2020 & 2033
- Table 3: Global Protein Engineering in Biotechnology Industry Revenue Million Forecast, by Technology 2020 & 2033
- Table 4: Global Protein Engineering in Biotechnology Industry Volume K Unit Forecast, by Technology 2020 & 2033
- Table 5: Global Protein Engineering in Biotechnology Industry Revenue Million Forecast, by End User 2020 & 2033
- Table 6: Global Protein Engineering in Biotechnology Industry Volume K Unit Forecast, by End User 2020 & 2033
- Table 7: Global Protein Engineering in Biotechnology Industry Revenue Million Forecast, by Region 2020 & 2033
- Table 8: Global Protein Engineering in Biotechnology Industry Volume K Unit Forecast, by Region 2020 & 2033
- Table 9: Global Protein Engineering in Biotechnology Industry Revenue Million Forecast, by Product Type 2020 & 2033
- Table 10: Global Protein Engineering in Biotechnology Industry Volume K Unit Forecast, by Product Type 2020 & 2033
- Table 11: Global Protein Engineering in Biotechnology Industry Revenue Million Forecast, by Technology 2020 & 2033
- Table 12: Global Protein Engineering in Biotechnology Industry Volume K Unit Forecast, by Technology 2020 & 2033
- Table 13: Global Protein Engineering in Biotechnology Industry Revenue Million Forecast, by End User 2020 & 2033
- Table 14: Global Protein Engineering in Biotechnology Industry Volume K Unit Forecast, by End User 2020 & 2033
- Table 15: Global Protein Engineering in Biotechnology Industry Revenue Million Forecast, by Country 2020 & 2033
- Table 16: Global Protein Engineering in Biotechnology Industry Volume K Unit Forecast, by Country 2020 & 2033
- Table 17: United States Protein Engineering in Biotechnology Industry Revenue (Million) Forecast, by Application 2020 & 2033
- Table 18: United States Protein Engineering in Biotechnology Industry Volume (K Unit) Forecast, by Application 2020 & 2033
- Table 19: Canada Protein Engineering in Biotechnology Industry Revenue (Million) Forecast, by Application 2020 & 2033
- Table 20: Canada Protein Engineering in Biotechnology Industry Volume (K Unit) Forecast, by Application 2020 & 2033
- Table 21: Mexico Protein Engineering in Biotechnology Industry Revenue (Million) Forecast, by Application 2020 & 2033
- Table 22: Mexico Protein Engineering in Biotechnology Industry Volume (K Unit) Forecast, by Application 2020 & 2033
- Table 23: Global Protein Engineering in Biotechnology Industry Revenue Million Forecast, by Product Type 2020 & 2033
- Table 24: Global Protein Engineering in Biotechnology Industry Volume K Unit Forecast, by Product Type 2020 & 2033
- Table 25: Global Protein Engineering in Biotechnology Industry Revenue Million Forecast, by Technology 2020 & 2033
- Table 26: Global Protein Engineering in Biotechnology Industry Volume K Unit Forecast, by Technology 2020 & 2033
- Table 27: Global Protein Engineering in Biotechnology Industry Revenue Million Forecast, by End User 2020 & 2033
- Table 28: Global Protein Engineering in Biotechnology Industry Volume K Unit Forecast, by End User 2020 & 2033
- Table 29: Global Protein Engineering in Biotechnology Industry Revenue Million Forecast, by Country 2020 & 2033
- Table 30: Global Protein Engineering in Biotechnology Industry Volume K Unit Forecast, by Country 2020 & 2033
- Table 31: Germany Protein Engineering in Biotechnology Industry Revenue (Million) Forecast, by Application 2020 & 2033
- Table 32: Germany Protein Engineering in Biotechnology Industry Volume (K Unit) Forecast, by Application 2020 & 2033
- Table 33: United Kingdom Protein Engineering in Biotechnology Industry Revenue (Million) Forecast, by Application 2020 & 2033
- Table 34: United Kingdom Protein Engineering in Biotechnology Industry Volume (K Unit) Forecast, by Application 2020 & 2033
- Table 35: France Protein Engineering in Biotechnology Industry Revenue (Million) Forecast, by Application 2020 & 2033
- Table 36: France Protein Engineering in Biotechnology Industry Volume (K Unit) Forecast, by Application 2020 & 2033
- Table 37: Italy Protein Engineering in Biotechnology Industry Revenue (Million) Forecast, by Application 2020 & 2033
- Table 38: Italy Protein Engineering in Biotechnology Industry Volume (K Unit) Forecast, by Application 2020 & 2033
- Table 39: Spain Protein Engineering in Biotechnology Industry Revenue (Million) Forecast, by Application 2020 & 2033
- Table 40: Spain Protein Engineering in Biotechnology Industry Volume (K Unit) Forecast, by Application 2020 & 2033
- Table 41: Rest of Europe Protein Engineering in Biotechnology Industry Revenue (Million) Forecast, by Application 2020 & 2033
- Table 42: Rest of Europe Protein Engineering in Biotechnology Industry Volume (K Unit) Forecast, by Application 2020 & 2033
- Table 43: Global Protein Engineering in Biotechnology Industry Revenue Million Forecast, by Product Type 2020 & 2033
- Table 44: Global Protein Engineering in Biotechnology Industry Volume K Unit Forecast, by Product Type 2020 & 2033
- Table 45: Global Protein Engineering in Biotechnology Industry Revenue Million Forecast, by Technology 2020 & 2033
- Table 46: Global Protein Engineering in Biotechnology Industry Volume K Unit Forecast, by Technology 2020 & 2033
- Table 47: Global Protein Engineering in Biotechnology Industry Revenue Million Forecast, by End User 2020 & 2033
- Table 48: Global Protein Engineering in Biotechnology Industry Volume K Unit Forecast, by End User 2020 & 2033
- Table 49: Global Protein Engineering in Biotechnology Industry Revenue Million Forecast, by Country 2020 & 2033
- Table 50: Global Protein Engineering in Biotechnology Industry Volume K Unit Forecast, by Country 2020 & 2033
- Table 51: China Protein Engineering in Biotechnology Industry Revenue (Million) Forecast, by Application 2020 & 2033
- Table 52: China Protein Engineering in Biotechnology Industry Volume (K Unit) Forecast, by Application 2020 & 2033
- Table 53: Japan Protein Engineering in Biotechnology Industry Revenue (Million) Forecast, by Application 2020 & 2033
- Table 54: Japan Protein Engineering in Biotechnology Industry Volume (K Unit) Forecast, by Application 2020 & 2033
- Table 55: India Protein Engineering in Biotechnology Industry Revenue (Million) Forecast, by Application 2020 & 2033
- Table 56: India Protein Engineering in Biotechnology Industry Volume (K Unit) Forecast, by Application 2020 & 2033
- Table 57: Australia Protein Engineering in Biotechnology Industry Revenue (Million) Forecast, by Application 2020 & 2033
- Table 58: Australia Protein Engineering in Biotechnology Industry Volume (K Unit) Forecast, by Application 2020 & 2033
- Table 59: South Korea Protein Engineering in Biotechnology Industry Revenue (Million) Forecast, by Application 2020 & 2033
- Table 60: South Korea Protein Engineering in Biotechnology Industry Volume (K Unit) Forecast, by Application 2020 & 2033
- Table 61: Rest of Asia Pacific Protein Engineering in Biotechnology Industry Revenue (Million) Forecast, by Application 2020 & 2033
- Table 62: Rest of Asia Pacific Protein Engineering in Biotechnology Industry Volume (K Unit) Forecast, by Application 2020 & 2033
- Table 63: Global Protein Engineering in Biotechnology Industry Revenue Million Forecast, by Product Type 2020 & 2033
- Table 64: Global Protein Engineering in Biotechnology Industry Volume K Unit Forecast, by Product Type 2020 & 2033
- Table 65: Global Protein Engineering in Biotechnology Industry Revenue Million Forecast, by Technology 2020 & 2033
- Table 66: Global Protein Engineering in Biotechnology Industry Volume K Unit Forecast, by Technology 2020 & 2033
- Table 67: Global Protein Engineering in Biotechnology Industry Revenue Million Forecast, by End User 2020 & 2033
- Table 68: Global Protein Engineering in Biotechnology Industry Volume K Unit Forecast, by End User 2020 & 2033
- Table 69: Global Protein Engineering in Biotechnology Industry Revenue Million Forecast, by Country 2020 & 2033
- Table 70: Global Protein Engineering in Biotechnology Industry Volume K Unit Forecast, by Country 2020 & 2033
- Table 71: GCC Protein Engineering in Biotechnology Industry Revenue (Million) Forecast, by Application 2020 & 2033
- Table 72: GCC Protein Engineering in Biotechnology Industry Volume (K Unit) Forecast, by Application 2020 & 2033
- Table 73: South Africa Protein Engineering in Biotechnology Industry Revenue (Million) Forecast, by Application 2020 & 2033
- Table 74: South Africa Protein Engineering in Biotechnology Industry Volume (K Unit) Forecast, by Application 2020 & 2033
- Table 75: Rest of Middle East and Africa Protein Engineering in Biotechnology Industry Revenue (Million) Forecast, by Application 2020 & 2033
- Table 76: Rest of Middle East and Africa Protein Engineering in Biotechnology Industry Volume (K Unit) Forecast, by Application 2020 & 2033
- Table 77: Global Protein Engineering in Biotechnology Industry Revenue Million Forecast, by Product Type 2020 & 2033
- Table 78: Global Protein Engineering in Biotechnology Industry Volume K Unit Forecast, by Product Type 2020 & 2033
- Table 79: Global Protein Engineering in Biotechnology Industry Revenue Million Forecast, by Technology 2020 & 2033
- Table 80: Global Protein Engineering in Biotechnology Industry Volume K Unit Forecast, by Technology 2020 & 2033
- Table 81: Global Protein Engineering in Biotechnology Industry Revenue Million Forecast, by End User 2020 & 2033
- Table 82: Global Protein Engineering in Biotechnology Industry Volume K Unit Forecast, by End User 2020 & 2033
- Table 83: Global Protein Engineering in Biotechnology Industry Revenue Million Forecast, by Country 2020 & 2033
- Table 84: Global Protein Engineering in Biotechnology Industry Volume K Unit Forecast, by Country 2020 & 2033
- Table 85: Brazil Protein Engineering in Biotechnology Industry Revenue (Million) Forecast, by Application 2020 & 2033
- Table 86: Brazil Protein Engineering in Biotechnology Industry Volume (K Unit) Forecast, by Application 2020 & 2033
- Table 87: Argentina Protein Engineering in Biotechnology Industry Revenue (Million) Forecast, by Application 2020 & 2033
- Table 88: Argentina Protein Engineering in Biotechnology Industry Volume (K Unit) Forecast, by Application 2020 & 2033
- Table 89: Rest of South America Protein Engineering in Biotechnology Industry Revenue (Million) Forecast, by Application 2020 & 2033
- Table 90: Rest of South America Protein Engineering in Biotechnology Industry Volume (K Unit) Forecast, by Application 2020 & 2033
Frequently Asked Questions
1. What is the projected Compound Annual Growth Rate (CAGR) of the Protein Engineering in Biotechnology Industry?
The projected CAGR is approximately 16.25%.
2. Which companies are prominent players in the Protein Engineering in Biotechnology Industry?
Key companies in the market include Novo Nordisk AS, Bio-Rad Laboratories Inc, Merck KGaA, Amgen Inc, Waters Corporation, Thermo Fisher Scientific Inc, Eli Lilly and Company, GenScript Biotech Corporation, Agilent Technologies Inc, PerkinElmer Inc, Bruker Corporation, GE HealthCare.
3. What are the main segments of the Protein Engineering in Biotechnology Industry?
The market segments include Product Type, Technology, End User.
4. Can you provide details about the market size?
The market size is estimated to be USD 3.52 Million as of 2022.
5. What are some drivers contributing to market growth?
Increasing Prevalence of Chronic Diseases and Rise in Demand for Targeted Therapies; Rising Government Funding for Protein Engineering Studies.
6. What are the notable trends driving market growth?
The Monoclonal Antibodies Segment is Anticipated to Witness Notable Growth Over the Forecast Period.
7. Are there any restraints impacting market growth?
High Costs of Protein Engineering Techniques.
8. Can you provide examples of recent developments in the market?
April 2024: Northpond-funded Laboratory for Bioengineering Research and Innovation made an investment with the Wyss Institute for the AmnioX project to facilitate the development of protein-based drugs, thus improving the accessibility of medicines to patients.
9. What pricing options are available for accessing the report?
Pricing options include single-user, multi-user, and enterprise licenses priced at USD 4750, USD 5250, and USD 8750 respectively.
10. Is the market size provided in terms of value or volume?
The market size is provided in terms of value, measured in Million and volume, measured in K Unit.
11. Are there any specific market keywords associated with the report?
Yes, the market keyword associated with the report is "Protein Engineering in Biotechnology Industry," which aids in identifying and referencing the specific market segment covered.
12. How do I determine which pricing option suits my needs best?
The pricing options vary based on user requirements and access needs. Individual users may opt for single-user licenses, while businesses requiring broader access may choose multi-user or enterprise licenses for cost-effective access to the report.
13. Are there any additional resources or data provided in the Protein Engineering in Biotechnology Industry report?
While the report offers comprehensive insights, it's advisable to review the specific contents or supplementary materials provided to ascertain if additional resources or data are available.
14. How can I stay updated on further developments or reports in the Protein Engineering in Biotechnology Industry?
To stay informed about further developments, trends, and reports in the Protein Engineering in Biotechnology Industry, consider subscribing to industry newsletters, following relevant companies and organizations, or regularly checking reputable industry news sources and publications.
Methodology
Step 1 - Identification of Relevant Samples Size from Population Database


Step 2 - Approaches for Defining Global Market Size (Value, Volume* & Price*)

Note*: In applicable scenarios
Step 3 - Data Sources
Primary Research
- Web Analytics
- Survey Reports
- Research Institute
- Latest Research Reports
- Opinion Leaders
Secondary Research
- Annual Reports
- White Paper
- Latest Press Release
- Industry Association
- Paid Database
- Investor Presentations

Step 4 - Data Triangulation
Involves using different sources of information in order to increase the validity of a study
These sources are likely to be stakeholders in a program - participants, other researchers, program staff, other community members, and so on.
Then we put all data in single framework & apply various statistical tools to find out the dynamic on the market.
During the analysis stage, feedback from the stakeholder groups would be compared to determine areas of agreement as well as areas of divergence