
Key Insights
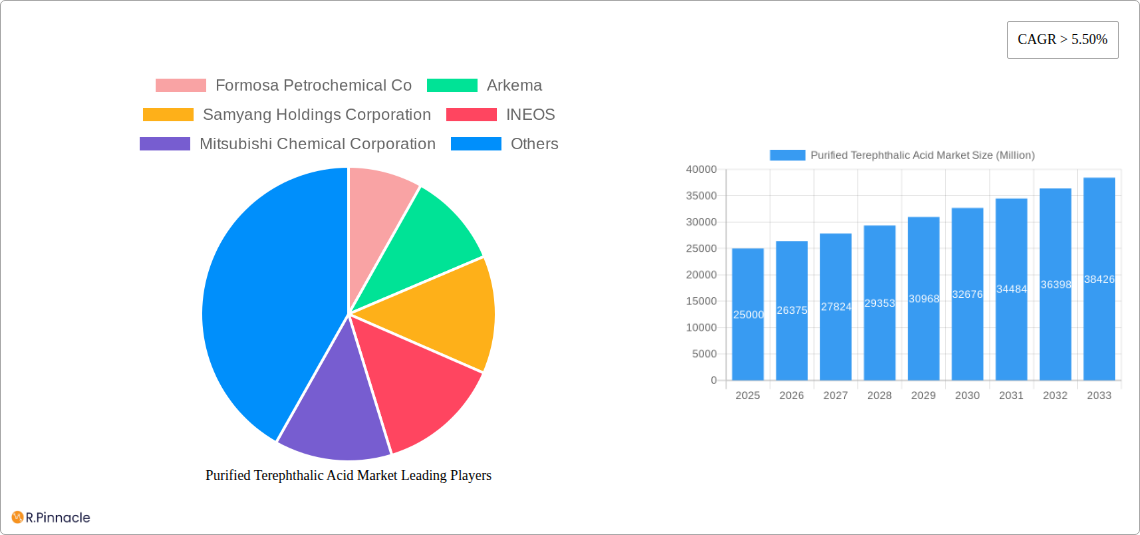
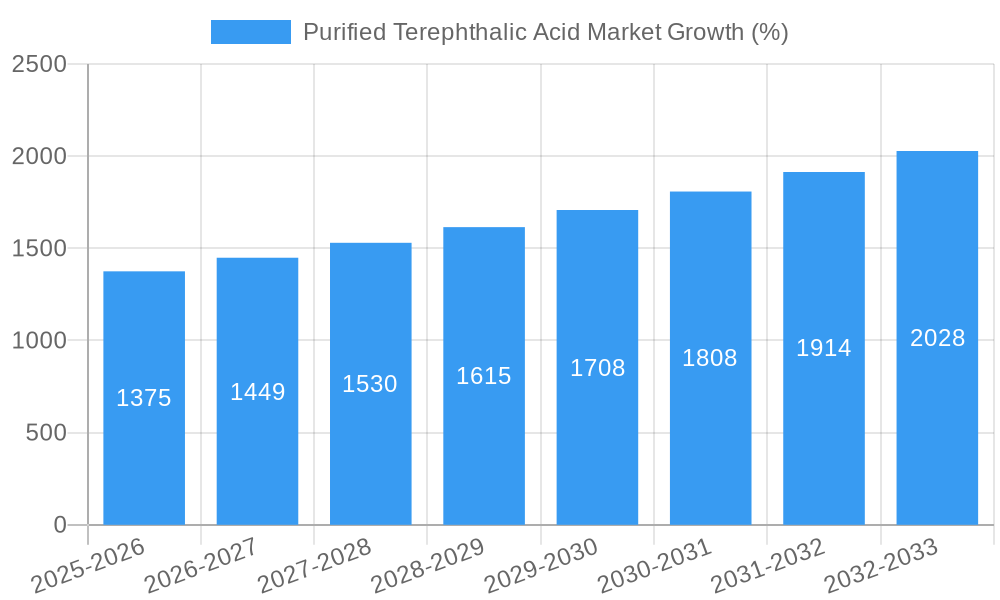
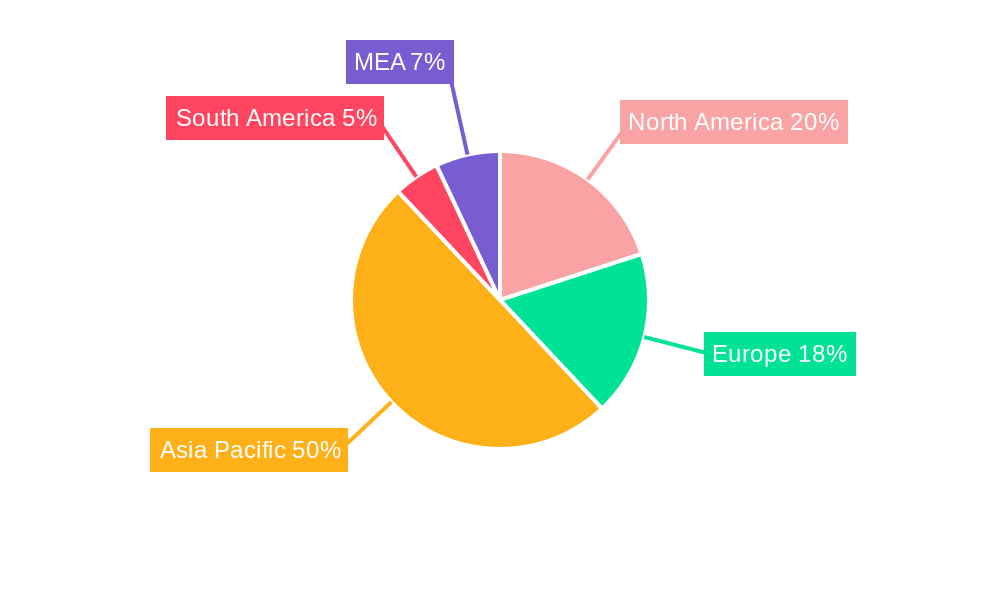
The Purified Terephthalic Acid (PTA) market is experiencing robust growth, driven by the expanding demand for polyethylene terephthalate (PET) in the packaging sector, particularly in the food and beverage industry. The market's Compound Annual Growth Rate (CAGR) exceeding 5.50% signifies a consistently positive trajectory. Key drivers include the increasing global population, rising disposable incomes, and a consequent surge in consumer demand for packaged goods. Furthermore, technological advancements in PTA production processes are leading to enhanced efficiency and reduced costs, contributing to market expansion. While the market faces restraints such as fluctuating raw material prices and environmental concerns related to PET waste management, the overall outlook remains optimistic. The PET derivative segment currently dominates the PTA market due to its widespread application in packaging, while the fibers segment shows significant potential for future growth fueled by the textile and apparel industries. Geographically, the Asia-Pacific region, particularly China and India, represents a substantial market share due to rapid industrialization and increasing consumption. North America and Europe also maintain significant market presence driven by established industries and mature consumer markets. Competition among major players like Formosa Petrochemical, Arkema, and Indorama Ventures is intense, fostering innovation and driving price competitiveness. The forecast period (2025-2033) projects sustained growth, although the precise rate may fluctuate depending on economic conditions and evolving consumer preferences. This market will likely see a shift towards sustainable and recycled PTA solutions as environmental awareness and regulatory pressures increase.
The segmentation of the PTA market reveals distinct growth patterns across applications. While packaging remains the dominant application, witnessing substantial growth fueled by rising demand for bottled beverages and food packaging, other segments like fibers and paints & coatings also contribute significantly to market expansion. The increasing use of PTA in specialized applications, such as pharmaceuticals and chemical intermediates, is a notable emerging trend. The competitive landscape is characterized by both established multinational corporations and regional players, with ongoing investments in capacity expansion and technological improvements. Strategic partnerships, mergers, and acquisitions are expected to further shape the competitive dynamics. The regional variations in market growth are primarily influenced by factors like economic development, industrialization rates, and government policies regarding plastic waste management. Future market growth will be influenced by the success of sustainability initiatives, technological advancements in PTA production, and changes in consumer behavior.
Purified Terephthalic Acid (PTA) Market Report: 2019-2033
This comprehensive report provides a detailed analysis of the Purified Terephthalic Acid (PTA) market, offering invaluable insights for industry professionals, investors, and strategic decision-makers. With a study period spanning 2019-2033, a base year of 2025, and a forecast period of 2025-2033, this report delivers actionable intelligence on market dynamics, key players, and future trends. The report utilizes data from the historical period of 2019-2024 to provide a strong foundation for future projections. Expect detailed segmentation analysis, competitive landscapes, and growth projections in Million USD.
Purified Terephthalic Acid Market Market Structure & Innovation Trends
This section analyzes the competitive landscape of the PTA market, encompassing market concentration, innovation drivers, regulatory frameworks, product substitutes, end-user demographics, and mergers and acquisitions (M&A) activities. We examine the market share held by key players such as Formosa Petrochemical Co, Arkema, Samyang Holdings Corporation, INEOS, Mitsubishi Chemical Corporation, Indorama Ventures Public Company Limited, Reliance Industries Limited, PetroChina Company Limited, Lotte Chemical Corporation, China Petroleum & Chemical Corporation, SABIC, Eastman Chemical Company, Indian Oil Corporation Ltd, and BP plc. The analysis includes an assessment of market concentration using metrics like the Herfindahl-Hirschman Index (HHI) (xx) and the market share of the top five players (xx%). We also explore M&A activities, evaluating the deal values and their impact on market consolidation (xx Million USD in total M&A deals during the historical period). The report further investigates innovation drivers, including advancements in production technologies and the development of new PTA applications, and the influence of regulatory frameworks on market growth and sustainability. Finally, we analyze the impact of substitute products and evolving end-user demographics on market demand.
Purified Terephthalic Acid Market Market Dynamics & Trends
This section delves into the key drivers and trends shaping the PTA market. We analyze market growth drivers, including increasing demand from downstream industries (Packaging, Fibers, etc.), technological advancements improving efficiency and sustainability, and shifting consumer preferences towards sustainable and recyclable products. We will also assess the impact of technological disruptions, such as the adoption of new production processes and the use of renewable resources. The competitive dynamics, including pricing strategies, capacity expansion plans, and the entry of new players, are thoroughly examined. The report provides quantitative insights, including the compound annual growth rate (CAGR) (xx%) for the forecast period, market penetration rates (xx%), and detailed analysis of the factors influencing these metrics. The impact of macroeconomic factors like global economic growth and commodity prices on market demand will also be evaluated.
Dominant Regions & Segments in Purified Terephthalic Acid Market
This section identifies the leading regions and segments within the PTA market. We analyze dominance across different geographical locations and across derivatives (Polyethylene Terephthalate (PET), Polybutylene Terephthalate (PBT), Polytrimethylene Terephthalate (PTT), Dimethyl Terephthalate) and applications (Packaging, Fibers, Paints and Coatings, Adhesives, Other Applications (Pharmaceuticals, Chemical Intermediates)).
Key Drivers (examples):
- Packaging: Growth driven by increasing demand for PET bottles in the food and beverage industry.
- Fibers: Expansion driven by growth in the textile and apparel sector.
- Asia: Dominance due to strong economic growth, rapid industrialization, and a large manufacturing base.
Detailed analysis will showcase the market size, growth rate, and market share for each segment and region, outlining the specific factors contributing to their dominance. This will include evaluating the influence of economic policies, infrastructure development, and consumer behavior in each region and for each application segment.
Purified Terephthalic Acid Market Product Innovations
This section summarizes recent product developments and advancements within the PTA market. We discuss the introduction of new PTA grades tailored to specific applications, emphasizing improvements in purity, performance, and sustainability. The focus is on innovations that enhance the competitive advantages of PTA producers, including enhanced production processes that reduce costs and environmental impact. We assess the market fit of new products and technologies and their potential to drive market growth.
Report Scope & Segmentation Analysis
This report segments the PTA market by derivative and application.
Derivatives:
- Polyethylene Terephthalate (PET): Analysis of market size, growth projections, and competitive dynamics in the PET segment. (xx Million USD in 2025, xx% CAGR)
- Polybutylene Terephthalate (PBT): Similar analysis for PBT, focusing on specific applications and market trends. (xx Million USD in 2025, xx% CAGR)
- Polytrimethylene Terephthalate (PTT): Market size, growth projections, and competitive landscape for PTT. (xx Million USD in 2025, xx% CAGR)
- Dimethyl Terephthalate (DMT): Analysis of market size, growth projections, and competitive dynamics for DMT. (xx Million USD in 2025, xx% CAGR)
Applications:
- Packaging: Market size, growth rate and competitive landscape for PTA used in packaging applications. (xx Million USD in 2025, xx% CAGR)
- Fibers: Market analysis of PTA used in fiber production, including growth projections and competitive dynamics. (xx Million USD in 2025, xx% CAGR)
- Paints and Coatings: Market analysis for PTA in paints and coatings. (xx Million USD in 2025, xx% CAGR)
- Adhesives: Market size, growth rate and competitive dynamics for PTA used in adhesives. (xx Million USD in 2025, xx% CAGR)
- Other Applications (Pharmaceuticals, Chemical Intermediates): Market analysis of PTA in other niche applications. (xx Million USD in 2025, xx% CAGR)
Key Drivers of Purified Terephthalic Acid Market Growth
The PTA market's growth is driven by several factors: the expanding global demand for PET bottles fueled by the growth of the beverage industry, increasing usage of PTA in textiles and apparel owing to the rise in disposable income in developing economies, and the growing adoption of PTA in various other applications, including paints and coatings, and automotive components. Technological advancements leading to more efficient and sustainable production processes further contribute to market growth. Favorable government policies and regulations promoting sustainable packaging solutions also play a significant role.
Challenges in the Purified Terephthalic Acid Market Sector
The PTA market faces challenges such as fluctuating raw material prices, intense competition among major players leading to price wars, and environmental concerns related to PTA production and waste management. Stricter environmental regulations and increasing energy costs pose significant hurdles, impacting production costs and profitability. Supply chain disruptions and geopolitical instability further exacerbate these challenges. These factors can collectively impact market growth by xx% over the forecast period.
Emerging Opportunities in Purified Terephthalic Acid Market
Emerging opportunities include the growing demand for biodegradable and recyclable PTA-based products, spurred by increasing environmental concerns and the rising popularity of sustainable packaging. The development of new applications for PTA in advanced materials and composites also presents significant potential. Expansion into new and emerging markets, especially in developing economies, is another avenue for growth. Furthermore, technological advancements leading to the development of more efficient and sustainable production processes offer significant potential for cost reduction and profitability enhancement.
Leading Players in the Purified Terephthalic Acid Market Market
- Formosa Petrochemical Co
- Arkema
- Samyang Holdings Corporation
- INEOS
- Mitsubishi Chemical Corporation
- Indorama Ventures Public Company Limited
- Reliance Industries Limited
- PetroChina Company Limited
- Lotte Chemical Corporation
- China Petroleum & Chemical Corporation
- SABIC
- Eastman Chemical Company
- Indian Oil Corporation Ltd
- BP plc
Key Developments in Purified Terephthalic Acid Market Industry
August 2022: Reliance Industries Ltd. announced plans to build the world's largest single-train PTA plant (3 MMTPA capacity) in Dahej, Gujarat, significantly expanding its polyester value chain capacity. This development indicates a strong positive outlook for PTA demand and future market growth.
March 2022: Ineos Aromatics upgraded its PTA plant in Merak, Indonesia, increasing capacity to 575,000 tons per annum and reducing carbon emissions. This showcases the industry's focus on sustainability and efficiency improvements.
Future Outlook for Purified Terephthalic Acid Market Market
The PTA market is poised for significant growth over the forecast period, driven by strong demand from downstream sectors, particularly packaging and textiles. The increasing focus on sustainability and the development of innovative PTA-based products will further propel market expansion. Strategic acquisitions and capacity expansions by major players will shape the competitive landscape and drive market consolidation. However, the market will remain susceptible to fluctuations in raw material prices and economic downturns. Nevertheless, the long-term outlook remains positive, with substantial growth potential in both developed and developing economies.
Purified Terephthalic Acid Market Segmentation
-
1. Derivative
- 1.1. Polyethylene Terephthalate (PET)
- 1.2. Polybutylene Terephthalate (PBT)
- 1.3. Polytrimethylene Terephthalate (PTT)
- 1.4. Dimethyl Terephthalate
-
2. Application
- 2.1. Packaging
- 2.2. Fibers
- 2.3. Paints and Coatings
- 2.4. Adhesives
- 2.5. Other Ap
Purified Terephthalic Acid Market Segmentation By Geography
-
1. Asia Pacific
- 1.1. China
- 1.2. India
- 1.3. Japan
- 1.4. South Korea
- 1.5. Rest of Asia Pacific
-
2. North America
- 2.1. United States
- 2.2. Canada
- 2.3. Mexico
-
3. Europe
- 3.1. Germany
- 3.2. United Kingdom
- 3.3. Italy
- 3.4. France
- 3.5. Rest of Europe
-
4. South America
- 4.1. Brazil
- 4.2. Argentina
- 4.3. Rest of South America
-
5. Middle East and Africa
- 5.1. Saudi Arabia
- 5.2. South Africa
- 5.3. Rest of Middle East and Africa
Purified Terephthalic Acid Market REPORT HIGHLIGHTS
| Aspects | Details |
|---|---|
| Study Period | 2019-2033 |
| Base Year | 2024 |
| Estimated Year | 2025 |
| Forecast Period | 2025-2033 |
| Historical Period | 2019-2024 |
| Growth Rate | CAGR of > 5.50% from 2019-2033 |
| Segmentation |
|
Table of Contents
- 1. Introduction
- 1.1. Research Scope
- 1.2. Market Segmentation
- 1.3. Research Methodology
- 1.4. Definitions and Assumptions
- 2. Executive Summary
- 2.1. Introduction
- 3. Market Dynamics
- 3.1. Introduction
- 3.2. Market Drivers
- 3.2.1. Growing Consumption for Polyethylene Terephthalate in the Packaging Sector; Significant Demand of Polyester Fibers from the Textile Sector in Asia Pacific
- 3.3. Market Restrains
- 3.3.1. Toxic Effects of Terephthalic Acid
- 3.4. Market Trends
- 3.4.1. Increasing Demand from Polyester Fibers
- 4. Market Factor Analysis
- 4.1. Porters Five Forces
- 4.2. Supply/Value Chain
- 4.3. PESTEL analysis
- 4.4. Market Entropy
- 4.5. Patent/Trademark Analysis
- 5. Global Purified Terephthalic Acid Market Analysis, Insights and Forecast, 2019-2031
- 5.1. Market Analysis, Insights and Forecast - by Derivative
- 5.1.1. Polyethylene Terephthalate (PET)
- 5.1.2. Polybutylene Terephthalate (PBT)
- 5.1.3. Polytrimethylene Terephthalate (PTT)
- 5.1.4. Dimethyl Terephthalate
- 5.2. Market Analysis, Insights and Forecast - by Application
- 5.2.1. Packaging
- 5.2.2. Fibers
- 5.2.3. Paints and Coatings
- 5.2.4. Adhesives
- 5.2.5. Other Ap
- 5.3. Market Analysis, Insights and Forecast - by Region
- 5.3.1. Asia Pacific
- 5.3.2. North America
- 5.3.3. Europe
- 5.3.4. South America
- 5.3.5. Middle East and Africa
- 5.1. Market Analysis, Insights and Forecast - by Derivative
- 6. Asia Pacific Purified Terephthalic Acid Market Analysis, Insights and Forecast, 2019-2031
- 6.1. Market Analysis, Insights and Forecast - by Derivative
- 6.1.1. Polyethylene Terephthalate (PET)
- 6.1.2. Polybutylene Terephthalate (PBT)
- 6.1.3. Polytrimethylene Terephthalate (PTT)
- 6.1.4. Dimethyl Terephthalate
- 6.2. Market Analysis, Insights and Forecast - by Application
- 6.2.1. Packaging
- 6.2.2. Fibers
- 6.2.3. Paints and Coatings
- 6.2.4. Adhesives
- 6.2.5. Other Ap
- 6.1. Market Analysis, Insights and Forecast - by Derivative
- 7. North America Purified Terephthalic Acid Market Analysis, Insights and Forecast, 2019-2031
- 7.1. Market Analysis, Insights and Forecast - by Derivative
- 7.1.1. Polyethylene Terephthalate (PET)
- 7.1.2. Polybutylene Terephthalate (PBT)
- 7.1.3. Polytrimethylene Terephthalate (PTT)
- 7.1.4. Dimethyl Terephthalate
- 7.2. Market Analysis, Insights and Forecast - by Application
- 7.2.1. Packaging
- 7.2.2. Fibers
- 7.2.3. Paints and Coatings
- 7.2.4. Adhesives
- 7.2.5. Other Ap
- 7.1. Market Analysis, Insights and Forecast - by Derivative
- 8. Europe Purified Terephthalic Acid Market Analysis, Insights and Forecast, 2019-2031
- 8.1. Market Analysis, Insights and Forecast - by Derivative
- 8.1.1. Polyethylene Terephthalate (PET)
- 8.1.2. Polybutylene Terephthalate (PBT)
- 8.1.3. Polytrimethylene Terephthalate (PTT)
- 8.1.4. Dimethyl Terephthalate
- 8.2. Market Analysis, Insights and Forecast - by Application
- 8.2.1. Packaging
- 8.2.2. Fibers
- 8.2.3. Paints and Coatings
- 8.2.4. Adhesives
- 8.2.5. Other Ap
- 8.1. Market Analysis, Insights and Forecast - by Derivative
- 9. South America Purified Terephthalic Acid Market Analysis, Insights and Forecast, 2019-2031
- 9.1. Market Analysis, Insights and Forecast - by Derivative
- 9.1.1. Polyethylene Terephthalate (PET)
- 9.1.2. Polybutylene Terephthalate (PBT)
- 9.1.3. Polytrimethylene Terephthalate (PTT)
- 9.1.4. Dimethyl Terephthalate
- 9.2. Market Analysis, Insights and Forecast - by Application
- 9.2.1. Packaging
- 9.2.2. Fibers
- 9.2.3. Paints and Coatings
- 9.2.4. Adhesives
- 9.2.5. Other Ap
- 9.1. Market Analysis, Insights and Forecast - by Derivative
- 10. Middle East and Africa Purified Terephthalic Acid Market Analysis, Insights and Forecast, 2019-2031
- 10.1. Market Analysis, Insights and Forecast - by Derivative
- 10.1.1. Polyethylene Terephthalate (PET)
- 10.1.2. Polybutylene Terephthalate (PBT)
- 10.1.3. Polytrimethylene Terephthalate (PTT)
- 10.1.4. Dimethyl Terephthalate
- 10.2. Market Analysis, Insights and Forecast - by Application
- 10.2.1. Packaging
- 10.2.2. Fibers
- 10.2.3. Paints and Coatings
- 10.2.4. Adhesives
- 10.2.5. Other Ap
- 10.1. Market Analysis, Insights and Forecast - by Derivative
- 11. North America Purified Terephthalic Acid Market Analysis, Insights and Forecast, 2019-2031
- 11.1. Market Analysis, Insights and Forecast - By Country/Sub-region
- 11.1.1 United States
- 11.1.2 Canada
- 11.1.3 Mexico
- 12. Europe Purified Terephthalic Acid Market Analysis, Insights and Forecast, 2019-2031
- 12.1. Market Analysis, Insights and Forecast - By Country/Sub-region
- 12.1.1 Germany
- 12.1.2 France
- 12.1.3 Italy
- 12.1.4 United Kingdom
- 12.1.5 Netherlands
- 12.1.6 Rest of Europe
- 13. Asia Pacific Purified Terephthalic Acid Market Analysis, Insights and Forecast, 2019-2031
- 13.1. Market Analysis, Insights and Forecast - By Country/Sub-region
- 13.1.1 China
- 13.1.2 Japan
- 13.1.3 India
- 13.1.4 South Korea
- 13.1.5 Taiwan
- 13.1.6 Australia
- 13.1.7 Rest of Asia-Pacific
- 14. South America Purified Terephthalic Acid Market Analysis, Insights and Forecast, 2019-2031
- 14.1. Market Analysis, Insights and Forecast - By Country/Sub-region
- 14.1.1 Brazil
- 14.1.2 Argentina
- 14.1.3 Rest of South America
- 15. MEA Purified Terephthalic Acid Market Analysis, Insights and Forecast, 2019-2031
- 15.1. Market Analysis, Insights and Forecast - By Country/Sub-region
- 15.1.1 Middle East
- 15.1.2 Africa
- 16. Competitive Analysis
- 16.1. Global Market Share Analysis 2024
- 16.2. Company Profiles
- 16.2.1 Formosa Petrochemical Co
- 16.2.1.1. Overview
- 16.2.1.2. Products
- 16.2.1.3. SWOT Analysis
- 16.2.1.4. Recent Developments
- 16.2.1.5. Financials (Based on Availability)
- 16.2.2 Arkema
- 16.2.2.1. Overview
- 16.2.2.2. Products
- 16.2.2.3. SWOT Analysis
- 16.2.2.4. Recent Developments
- 16.2.2.5. Financials (Based on Availability)
- 16.2.3 Samyang Holdings Corporation
- 16.2.3.1. Overview
- 16.2.3.2. Products
- 16.2.3.3. SWOT Analysis
- 16.2.3.4. Recent Developments
- 16.2.3.5. Financials (Based on Availability)
- 16.2.4 INEOS
- 16.2.4.1. Overview
- 16.2.4.2. Products
- 16.2.4.3. SWOT Analysis
- 16.2.4.4. Recent Developments
- 16.2.4.5. Financials (Based on Availability)
- 16.2.5 Mitsubishi Chemical Corporation
- 16.2.5.1. Overview
- 16.2.5.2. Products
- 16.2.5.3. SWOT Analysis
- 16.2.5.4. Recent Developments
- 16.2.5.5. Financials (Based on Availability)
- 16.2.6 Indorama Ventures Public Company Limited
- 16.2.6.1. Overview
- 16.2.6.2. Products
- 16.2.6.3. SWOT Analysis
- 16.2.6.4. Recent Developments
- 16.2.6.5. Financials (Based on Availability)
- 16.2.7 Reliance Industries Limited
- 16.2.7.1. Overview
- 16.2.7.2. Products
- 16.2.7.3. SWOT Analysis
- 16.2.7.4. Recent Developments
- 16.2.7.5. Financials (Based on Availability)
- 16.2.8 PetroChina Company Limited
- 16.2.8.1. Overview
- 16.2.8.2. Products
- 16.2.8.3. SWOT Analysis
- 16.2.8.4. Recent Developments
- 16.2.8.5. Financials (Based on Availability)
- 16.2.9 Lotte Chemical Corporation
- 16.2.9.1. Overview
- 16.2.9.2. Products
- 16.2.9.3. SWOT Analysis
- 16.2.9.4. Recent Developments
- 16.2.9.5. Financials (Based on Availability)
- 16.2.10 China Petroleum & Chemical Corporation
- 16.2.10.1. Overview
- 16.2.10.2. Products
- 16.2.10.3. SWOT Analysis
- 16.2.10.4. Recent Developments
- 16.2.10.5. Financials (Based on Availability)
- 16.2.11 SABIC
- 16.2.11.1. Overview
- 16.2.11.2. Products
- 16.2.11.3. SWOT Analysis
- 16.2.11.4. Recent Developments
- 16.2.11.5. Financials (Based on Availability)
- 16.2.12 Eastman Chemical Company
- 16.2.12.1. Overview
- 16.2.12.2. Products
- 16.2.12.3. SWOT Analysis
- 16.2.12.4. Recent Developments
- 16.2.12.5. Financials (Based on Availability)
- 16.2.13 Indian Oil Corporation Ltd
- 16.2.13.1. Overview
- 16.2.13.2. Products
- 16.2.13.3. SWOT Analysis
- 16.2.13.4. Recent Developments
- 16.2.13.5. Financials (Based on Availability)
- 16.2.14 BP p l c
- 16.2.14.1. Overview
- 16.2.14.2. Products
- 16.2.14.3. SWOT Analysis
- 16.2.14.4. Recent Developments
- 16.2.14.5. Financials (Based on Availability)
- 16.2.1 Formosa Petrochemical Co
List of Figures
- Figure 1: Global Purified Terephthalic Acid Market Revenue Breakdown (Million, %) by Region 2024 & 2032
- Figure 2: Global Purified Terephthalic Acid Market Volume Breakdown (K Tons, %) by Region 2024 & 2032
- Figure 3: North America Purified Terephthalic Acid Market Revenue (Million), by Country 2024 & 2032
- Figure 4: North America Purified Terephthalic Acid Market Volume (K Tons), by Country 2024 & 2032
- Figure 5: North America Purified Terephthalic Acid Market Revenue Share (%), by Country 2024 & 2032
- Figure 6: North America Purified Terephthalic Acid Market Volume Share (%), by Country 2024 & 2032
- Figure 7: Europe Purified Terephthalic Acid Market Revenue (Million), by Country 2024 & 2032
- Figure 8: Europe Purified Terephthalic Acid Market Volume (K Tons), by Country 2024 & 2032
- Figure 9: Europe Purified Terephthalic Acid Market Revenue Share (%), by Country 2024 & 2032
- Figure 10: Europe Purified Terephthalic Acid Market Volume Share (%), by Country 2024 & 2032
- Figure 11: Asia Pacific Purified Terephthalic Acid Market Revenue (Million), by Country 2024 & 2032
- Figure 12: Asia Pacific Purified Terephthalic Acid Market Volume (K Tons), by Country 2024 & 2032
- Figure 13: Asia Pacific Purified Terephthalic Acid Market Revenue Share (%), by Country 2024 & 2032
- Figure 14: Asia Pacific Purified Terephthalic Acid Market Volume Share (%), by Country 2024 & 2032
- Figure 15: South America Purified Terephthalic Acid Market Revenue (Million), by Country 2024 & 2032
- Figure 16: South America Purified Terephthalic Acid Market Volume (K Tons), by Country 2024 & 2032
- Figure 17: South America Purified Terephthalic Acid Market Revenue Share (%), by Country 2024 & 2032
- Figure 18: South America Purified Terephthalic Acid Market Volume Share (%), by Country 2024 & 2032
- Figure 19: MEA Purified Terephthalic Acid Market Revenue (Million), by Country 2024 & 2032
- Figure 20: MEA Purified Terephthalic Acid Market Volume (K Tons), by Country 2024 & 2032
- Figure 21: MEA Purified Terephthalic Acid Market Revenue Share (%), by Country 2024 & 2032
- Figure 22: MEA Purified Terephthalic Acid Market Volume Share (%), by Country 2024 & 2032
- Figure 23: Asia Pacific Purified Terephthalic Acid Market Revenue (Million), by Derivative 2024 & 2032
- Figure 24: Asia Pacific Purified Terephthalic Acid Market Volume (K Tons), by Derivative 2024 & 2032
- Figure 25: Asia Pacific Purified Terephthalic Acid Market Revenue Share (%), by Derivative 2024 & 2032
- Figure 26: Asia Pacific Purified Terephthalic Acid Market Volume Share (%), by Derivative 2024 & 2032
- Figure 27: Asia Pacific Purified Terephthalic Acid Market Revenue (Million), by Application 2024 & 2032
- Figure 28: Asia Pacific Purified Terephthalic Acid Market Volume (K Tons), by Application 2024 & 2032
- Figure 29: Asia Pacific Purified Terephthalic Acid Market Revenue Share (%), by Application 2024 & 2032
- Figure 30: Asia Pacific Purified Terephthalic Acid Market Volume Share (%), by Application 2024 & 2032
- Figure 31: Asia Pacific Purified Terephthalic Acid Market Revenue (Million), by Country 2024 & 2032
- Figure 32: Asia Pacific Purified Terephthalic Acid Market Volume (K Tons), by Country 2024 & 2032
- Figure 33: Asia Pacific Purified Terephthalic Acid Market Revenue Share (%), by Country 2024 & 2032
- Figure 34: Asia Pacific Purified Terephthalic Acid Market Volume Share (%), by Country 2024 & 2032
- Figure 35: North America Purified Terephthalic Acid Market Revenue (Million), by Derivative 2024 & 2032
- Figure 36: North America Purified Terephthalic Acid Market Volume (K Tons), by Derivative 2024 & 2032
- Figure 37: North America Purified Terephthalic Acid Market Revenue Share (%), by Derivative 2024 & 2032
- Figure 38: North America Purified Terephthalic Acid Market Volume Share (%), by Derivative 2024 & 2032
- Figure 39: North America Purified Terephthalic Acid Market Revenue (Million), by Application 2024 & 2032
- Figure 40: North America Purified Terephthalic Acid Market Volume (K Tons), by Application 2024 & 2032
- Figure 41: North America Purified Terephthalic Acid Market Revenue Share (%), by Application 2024 & 2032
- Figure 42: North America Purified Terephthalic Acid Market Volume Share (%), by Application 2024 & 2032
- Figure 43: North America Purified Terephthalic Acid Market Revenue (Million), by Country 2024 & 2032
- Figure 44: North America Purified Terephthalic Acid Market Volume (K Tons), by Country 2024 & 2032
- Figure 45: North America Purified Terephthalic Acid Market Revenue Share (%), by Country 2024 & 2032
- Figure 46: North America Purified Terephthalic Acid Market Volume Share (%), by Country 2024 & 2032
- Figure 47: Europe Purified Terephthalic Acid Market Revenue (Million), by Derivative 2024 & 2032
- Figure 48: Europe Purified Terephthalic Acid Market Volume (K Tons), by Derivative 2024 & 2032
- Figure 49: Europe Purified Terephthalic Acid Market Revenue Share (%), by Derivative 2024 & 2032
- Figure 50: Europe Purified Terephthalic Acid Market Volume Share (%), by Derivative 2024 & 2032
- Figure 51: Europe Purified Terephthalic Acid Market Revenue (Million), by Application 2024 & 2032
- Figure 52: Europe Purified Terephthalic Acid Market Volume (K Tons), by Application 2024 & 2032
- Figure 53: Europe Purified Terephthalic Acid Market Revenue Share (%), by Application 2024 & 2032
- Figure 54: Europe Purified Terephthalic Acid Market Volume Share (%), by Application 2024 & 2032
- Figure 55: Europe Purified Terephthalic Acid Market Revenue (Million), by Country 2024 & 2032
- Figure 56: Europe Purified Terephthalic Acid Market Volume (K Tons), by Country 2024 & 2032
- Figure 57: Europe Purified Terephthalic Acid Market Revenue Share (%), by Country 2024 & 2032
- Figure 58: Europe Purified Terephthalic Acid Market Volume Share (%), by Country 2024 & 2032
- Figure 59: South America Purified Terephthalic Acid Market Revenue (Million), by Derivative 2024 & 2032
- Figure 60: South America Purified Terephthalic Acid Market Volume (K Tons), by Derivative 2024 & 2032
- Figure 61: South America Purified Terephthalic Acid Market Revenue Share (%), by Derivative 2024 & 2032
- Figure 62: South America Purified Terephthalic Acid Market Volume Share (%), by Derivative 2024 & 2032
- Figure 63: South America Purified Terephthalic Acid Market Revenue (Million), by Application 2024 & 2032
- Figure 64: South America Purified Terephthalic Acid Market Volume (K Tons), by Application 2024 & 2032
- Figure 65: South America Purified Terephthalic Acid Market Revenue Share (%), by Application 2024 & 2032
- Figure 66: South America Purified Terephthalic Acid Market Volume Share (%), by Application 2024 & 2032
- Figure 67: South America Purified Terephthalic Acid Market Revenue (Million), by Country 2024 & 2032
- Figure 68: South America Purified Terephthalic Acid Market Volume (K Tons), by Country 2024 & 2032
- Figure 69: South America Purified Terephthalic Acid Market Revenue Share (%), by Country 2024 & 2032
- Figure 70: South America Purified Terephthalic Acid Market Volume Share (%), by Country 2024 & 2032
- Figure 71: Middle East and Africa Purified Terephthalic Acid Market Revenue (Million), by Derivative 2024 & 2032
- Figure 72: Middle East and Africa Purified Terephthalic Acid Market Volume (K Tons), by Derivative 2024 & 2032
- Figure 73: Middle East and Africa Purified Terephthalic Acid Market Revenue Share (%), by Derivative 2024 & 2032
- Figure 74: Middle East and Africa Purified Terephthalic Acid Market Volume Share (%), by Derivative 2024 & 2032
- Figure 75: Middle East and Africa Purified Terephthalic Acid Market Revenue (Million), by Application 2024 & 2032
- Figure 76: Middle East and Africa Purified Terephthalic Acid Market Volume (K Tons), by Application 2024 & 2032
- Figure 77: Middle East and Africa Purified Terephthalic Acid Market Revenue Share (%), by Application 2024 & 2032
- Figure 78: Middle East and Africa Purified Terephthalic Acid Market Volume Share (%), by Application 2024 & 2032
- Figure 79: Middle East and Africa Purified Terephthalic Acid Market Revenue (Million), by Country 2024 & 2032
- Figure 80: Middle East and Africa Purified Terephthalic Acid Market Volume (K Tons), by Country 2024 & 2032
- Figure 81: Middle East and Africa Purified Terephthalic Acid Market Revenue Share (%), by Country 2024 & 2032
- Figure 82: Middle East and Africa Purified Terephthalic Acid Market Volume Share (%), by Country 2024 & 2032
List of Tables
- Table 1: Global Purified Terephthalic Acid Market Revenue Million Forecast, by Region 2019 & 2032
- Table 2: Global Purified Terephthalic Acid Market Volume K Tons Forecast, by Region 2019 & 2032
- Table 3: Global Purified Terephthalic Acid Market Revenue Million Forecast, by Derivative 2019 & 2032
- Table 4: Global Purified Terephthalic Acid Market Volume K Tons Forecast, by Derivative 2019 & 2032
- Table 5: Global Purified Terephthalic Acid Market Revenue Million Forecast, by Application 2019 & 2032
- Table 6: Global Purified Terephthalic Acid Market Volume K Tons Forecast, by Application 2019 & 2032
- Table 7: Global Purified Terephthalic Acid Market Revenue Million Forecast, by Region 2019 & 2032
- Table 8: Global Purified Terephthalic Acid Market Volume K Tons Forecast, by Region 2019 & 2032
- Table 9: Global Purified Terephthalic Acid Market Revenue Million Forecast, by Country 2019 & 2032
- Table 10: Global Purified Terephthalic Acid Market Volume K Tons Forecast, by Country 2019 & 2032
- Table 11: United States Purified Terephthalic Acid Market Revenue (Million) Forecast, by Application 2019 & 2032
- Table 12: United States Purified Terephthalic Acid Market Volume (K Tons) Forecast, by Application 2019 & 2032
- Table 13: Canada Purified Terephthalic Acid Market Revenue (Million) Forecast, by Application 2019 & 2032
- Table 14: Canada Purified Terephthalic Acid Market Volume (K Tons) Forecast, by Application 2019 & 2032
- Table 15: Mexico Purified Terephthalic Acid Market Revenue (Million) Forecast, by Application 2019 & 2032
- Table 16: Mexico Purified Terephthalic Acid Market Volume (K Tons) Forecast, by Application 2019 & 2032
- Table 17: Global Purified Terephthalic Acid Market Revenue Million Forecast, by Country 2019 & 2032
- Table 18: Global Purified Terephthalic Acid Market Volume K Tons Forecast, by Country 2019 & 2032
- Table 19: Germany Purified Terephthalic Acid Market Revenue (Million) Forecast, by Application 2019 & 2032
- Table 20: Germany Purified Terephthalic Acid Market Volume (K Tons) Forecast, by Application 2019 & 2032
- Table 21: France Purified Terephthalic Acid Market Revenue (Million) Forecast, by Application 2019 & 2032
- Table 22: France Purified Terephthalic Acid Market Volume (K Tons) Forecast, by Application 2019 & 2032
- Table 23: Italy Purified Terephthalic Acid Market Revenue (Million) Forecast, by Application 2019 & 2032
- Table 24: Italy Purified Terephthalic Acid Market Volume (K Tons) Forecast, by Application 2019 & 2032
- Table 25: United Kingdom Purified Terephthalic Acid Market Revenue (Million) Forecast, by Application 2019 & 2032
- Table 26: United Kingdom Purified Terephthalic Acid Market Volume (K Tons) Forecast, by Application 2019 & 2032
- Table 27: Netherlands Purified Terephthalic Acid Market Revenue (Million) Forecast, by Application 2019 & 2032
- Table 28: Netherlands Purified Terephthalic Acid Market Volume (K Tons) Forecast, by Application 2019 & 2032
- Table 29: Rest of Europe Purified Terephthalic Acid Market Revenue (Million) Forecast, by Application 2019 & 2032
- Table 30: Rest of Europe Purified Terephthalic Acid Market Volume (K Tons) Forecast, by Application 2019 & 2032
- Table 31: Global Purified Terephthalic Acid Market Revenue Million Forecast, by Country 2019 & 2032
- Table 32: Global Purified Terephthalic Acid Market Volume K Tons Forecast, by Country 2019 & 2032
- Table 33: China Purified Terephthalic Acid Market Revenue (Million) Forecast, by Application 2019 & 2032
- Table 34: China Purified Terephthalic Acid Market Volume (K Tons) Forecast, by Application 2019 & 2032
- Table 35: Japan Purified Terephthalic Acid Market Revenue (Million) Forecast, by Application 2019 & 2032
- Table 36: Japan Purified Terephthalic Acid Market Volume (K Tons) Forecast, by Application 2019 & 2032
- Table 37: India Purified Terephthalic Acid Market Revenue (Million) Forecast, by Application 2019 & 2032
- Table 38: India Purified Terephthalic Acid Market Volume (K Tons) Forecast, by Application 2019 & 2032
- Table 39: South Korea Purified Terephthalic Acid Market Revenue (Million) Forecast, by Application 2019 & 2032
- Table 40: South Korea Purified Terephthalic Acid Market Volume (K Tons) Forecast, by Application 2019 & 2032
- Table 41: Taiwan Purified Terephthalic Acid Market Revenue (Million) Forecast, by Application 2019 & 2032
- Table 42: Taiwan Purified Terephthalic Acid Market Volume (K Tons) Forecast, by Application 2019 & 2032
- Table 43: Australia Purified Terephthalic Acid Market Revenue (Million) Forecast, by Application 2019 & 2032
- Table 44: Australia Purified Terephthalic Acid Market Volume (K Tons) Forecast, by Application 2019 & 2032
- Table 45: Rest of Asia-Pacific Purified Terephthalic Acid Market Revenue (Million) Forecast, by Application 2019 & 2032
- Table 46: Rest of Asia-Pacific Purified Terephthalic Acid Market Volume (K Tons) Forecast, by Application 2019 & 2032
- Table 47: Global Purified Terephthalic Acid Market Revenue Million Forecast, by Country 2019 & 2032
- Table 48: Global Purified Terephthalic Acid Market Volume K Tons Forecast, by Country 2019 & 2032
- Table 49: Brazil Purified Terephthalic Acid Market Revenue (Million) Forecast, by Application 2019 & 2032
- Table 50: Brazil Purified Terephthalic Acid Market Volume (K Tons) Forecast, by Application 2019 & 2032
- Table 51: Argentina Purified Terephthalic Acid Market Revenue (Million) Forecast, by Application 2019 & 2032
- Table 52: Argentina Purified Terephthalic Acid Market Volume (K Tons) Forecast, by Application 2019 & 2032
- Table 53: Rest of South America Purified Terephthalic Acid Market Revenue (Million) Forecast, by Application 2019 & 2032
- Table 54: Rest of South America Purified Terephthalic Acid Market Volume (K Tons) Forecast, by Application 2019 & 2032
- Table 55: Global Purified Terephthalic Acid Market Revenue Million Forecast, by Country 2019 & 2032
- Table 56: Global Purified Terephthalic Acid Market Volume K Tons Forecast, by Country 2019 & 2032
- Table 57: Middle East Purified Terephthalic Acid Market Revenue (Million) Forecast, by Application 2019 & 2032
- Table 58: Middle East Purified Terephthalic Acid Market Volume (K Tons) Forecast, by Application 2019 & 2032
- Table 59: Africa Purified Terephthalic Acid Market Revenue (Million) Forecast, by Application 2019 & 2032
- Table 60: Africa Purified Terephthalic Acid Market Volume (K Tons) Forecast, by Application 2019 & 2032
- Table 61: Global Purified Terephthalic Acid Market Revenue Million Forecast, by Derivative 2019 & 2032
- Table 62: Global Purified Terephthalic Acid Market Volume K Tons Forecast, by Derivative 2019 & 2032
- Table 63: Global Purified Terephthalic Acid Market Revenue Million Forecast, by Application 2019 & 2032
- Table 64: Global Purified Terephthalic Acid Market Volume K Tons Forecast, by Application 2019 & 2032
- Table 65: Global Purified Terephthalic Acid Market Revenue Million Forecast, by Country 2019 & 2032
- Table 66: Global Purified Terephthalic Acid Market Volume K Tons Forecast, by Country 2019 & 2032
- Table 67: China Purified Terephthalic Acid Market Revenue (Million) Forecast, by Application 2019 & 2032
- Table 68: China Purified Terephthalic Acid Market Volume (K Tons) Forecast, by Application 2019 & 2032
- Table 69: India Purified Terephthalic Acid Market Revenue (Million) Forecast, by Application 2019 & 2032
- Table 70: India Purified Terephthalic Acid Market Volume (K Tons) Forecast, by Application 2019 & 2032
- Table 71: Japan Purified Terephthalic Acid Market Revenue (Million) Forecast, by Application 2019 & 2032
- Table 72: Japan Purified Terephthalic Acid Market Volume (K Tons) Forecast, by Application 2019 & 2032
- Table 73: South Korea Purified Terephthalic Acid Market Revenue (Million) Forecast, by Application 2019 & 2032
- Table 74: South Korea Purified Terephthalic Acid Market Volume (K Tons) Forecast, by Application 2019 & 2032
- Table 75: Rest of Asia Pacific Purified Terephthalic Acid Market Revenue (Million) Forecast, by Application 2019 & 2032
- Table 76: Rest of Asia Pacific Purified Terephthalic Acid Market Volume (K Tons) Forecast, by Application 2019 & 2032
- Table 77: Global Purified Terephthalic Acid Market Revenue Million Forecast, by Derivative 2019 & 2032
- Table 78: Global Purified Terephthalic Acid Market Volume K Tons Forecast, by Derivative 2019 & 2032
- Table 79: Global Purified Terephthalic Acid Market Revenue Million Forecast, by Application 2019 & 2032
- Table 80: Global Purified Terephthalic Acid Market Volume K Tons Forecast, by Application 2019 & 2032
- Table 81: Global Purified Terephthalic Acid Market Revenue Million Forecast, by Country 2019 & 2032
- Table 82: Global Purified Terephthalic Acid Market Volume K Tons Forecast, by Country 2019 & 2032
- Table 83: United States Purified Terephthalic Acid Market Revenue (Million) Forecast, by Application 2019 & 2032
- Table 84: United States Purified Terephthalic Acid Market Volume (K Tons) Forecast, by Application 2019 & 2032
- Table 85: Canada Purified Terephthalic Acid Market Revenue (Million) Forecast, by Application 2019 & 2032
- Table 86: Canada Purified Terephthalic Acid Market Volume (K Tons) Forecast, by Application 2019 & 2032
- Table 87: Mexico Purified Terephthalic Acid Market Revenue (Million) Forecast, by Application 2019 & 2032
- Table 88: Mexico Purified Terephthalic Acid Market Volume (K Tons) Forecast, by Application 2019 & 2032
- Table 89: Global Purified Terephthalic Acid Market Revenue Million Forecast, by Derivative 2019 & 2032
- Table 90: Global Purified Terephthalic Acid Market Volume K Tons Forecast, by Derivative 2019 & 2032
- Table 91: Global Purified Terephthalic Acid Market Revenue Million Forecast, by Application 2019 & 2032
- Table 92: Global Purified Terephthalic Acid Market Volume K Tons Forecast, by Application 2019 & 2032
- Table 93: Global Purified Terephthalic Acid Market Revenue Million Forecast, by Country 2019 & 2032
- Table 94: Global Purified Terephthalic Acid Market Volume K Tons Forecast, by Country 2019 & 2032
- Table 95: Germany Purified Terephthalic Acid Market Revenue (Million) Forecast, by Application 2019 & 2032
- Table 96: Germany Purified Terephthalic Acid Market Volume (K Tons) Forecast, by Application 2019 & 2032
- Table 97: United Kingdom Purified Terephthalic Acid Market Revenue (Million) Forecast, by Application 2019 & 2032
- Table 98: United Kingdom Purified Terephthalic Acid Market Volume (K Tons) Forecast, by Application 2019 & 2032
- Table 99: Italy Purified Terephthalic Acid Market Revenue (Million) Forecast, by Application 2019 & 2032
- Table 100: Italy Purified Terephthalic Acid Market Volume (K Tons) Forecast, by Application 2019 & 2032
- Table 101: France Purified Terephthalic Acid Market Revenue (Million) Forecast, by Application 2019 & 2032
- Table 102: France Purified Terephthalic Acid Market Volume (K Tons) Forecast, by Application 2019 & 2032
- Table 103: Rest of Europe Purified Terephthalic Acid Market Revenue (Million) Forecast, by Application 2019 & 2032
- Table 104: Rest of Europe Purified Terephthalic Acid Market Volume (K Tons) Forecast, by Application 2019 & 2032
- Table 105: Global Purified Terephthalic Acid Market Revenue Million Forecast, by Derivative 2019 & 2032
- Table 106: Global Purified Terephthalic Acid Market Volume K Tons Forecast, by Derivative 2019 & 2032
- Table 107: Global Purified Terephthalic Acid Market Revenue Million Forecast, by Application 2019 & 2032
- Table 108: Global Purified Terephthalic Acid Market Volume K Tons Forecast, by Application 2019 & 2032
- Table 109: Global Purified Terephthalic Acid Market Revenue Million Forecast, by Country 2019 & 2032
- Table 110: Global Purified Terephthalic Acid Market Volume K Tons Forecast, by Country 2019 & 2032
- Table 111: Brazil Purified Terephthalic Acid Market Revenue (Million) Forecast, by Application 2019 & 2032
- Table 112: Brazil Purified Terephthalic Acid Market Volume (K Tons) Forecast, by Application 2019 & 2032
- Table 113: Argentina Purified Terephthalic Acid Market Revenue (Million) Forecast, by Application 2019 & 2032
- Table 114: Argentina Purified Terephthalic Acid Market Volume (K Tons) Forecast, by Application 2019 & 2032
- Table 115: Rest of South America Purified Terephthalic Acid Market Revenue (Million) Forecast, by Application 2019 & 2032
- Table 116: Rest of South America Purified Terephthalic Acid Market Volume (K Tons) Forecast, by Application 2019 & 2032
- Table 117: Global Purified Terephthalic Acid Market Revenue Million Forecast, by Derivative 2019 & 2032
- Table 118: Global Purified Terephthalic Acid Market Volume K Tons Forecast, by Derivative 2019 & 2032
- Table 119: Global Purified Terephthalic Acid Market Revenue Million Forecast, by Application 2019 & 2032
- Table 120: Global Purified Terephthalic Acid Market Volume K Tons Forecast, by Application 2019 & 2032
- Table 121: Global Purified Terephthalic Acid Market Revenue Million Forecast, by Country 2019 & 2032
- Table 122: Global Purified Terephthalic Acid Market Volume K Tons Forecast, by Country 2019 & 2032
- Table 123: Saudi Arabia Purified Terephthalic Acid Market Revenue (Million) Forecast, by Application 2019 & 2032
- Table 124: Saudi Arabia Purified Terephthalic Acid Market Volume (K Tons) Forecast, by Application 2019 & 2032
- Table 125: South Africa Purified Terephthalic Acid Market Revenue (Million) Forecast, by Application 2019 & 2032
- Table 126: South Africa Purified Terephthalic Acid Market Volume (K Tons) Forecast, by Application 2019 & 2032
- Table 127: Rest of Middle East and Africa Purified Terephthalic Acid Market Revenue (Million) Forecast, by Application 2019 & 2032
- Table 128: Rest of Middle East and Africa Purified Terephthalic Acid Market Volume (K Tons) Forecast, by Application 2019 & 2032
Frequently Asked Questions
1. What is the projected Compound Annual Growth Rate (CAGR) of the Purified Terephthalic Acid Market?
The projected CAGR is approximately > 5.50%.
2. Which companies are prominent players in the Purified Terephthalic Acid Market?
Key companies in the market include Formosa Petrochemical Co, Arkema, Samyang Holdings Corporation, INEOS, Mitsubishi Chemical Corporation, Indorama Ventures Public Company Limited, Reliance Industries Limited, PetroChina Company Limited, Lotte Chemical Corporation, China Petroleum & Chemical Corporation, SABIC, Eastman Chemical Company, Indian Oil Corporation Ltd, BP p l c.
3. What are the main segments of the Purified Terephthalic Acid Market?
The market segments include Derivative, Application.
4. Can you provide details about the market size?
The market size is estimated to be USD XX Million as of 2022.
5. What are some drivers contributing to market growth?
Growing Consumption for Polyethylene Terephthalate in the Packaging Sector; Significant Demand of Polyester Fibers from the Textile Sector in Asia Pacific.
6. What are the notable trends driving market growth?
Increasing Demand from Polyester Fibers.
7. Are there any restraints impacting market growth?
Toxic Effects of Terephthalic Acid.
8. Can you provide examples of recent developments in the market?
August 2022: The Indian multinational conglomerate company, Reliance Industries Ltd., revealed its plan to invest in expanding the capacity of the polyester value chain in the next five years. As a part of this strategy, the company will build the world's largest single-train PTA (purified terephthalic acid) plant of 3 MMTPA capacity at Dahej, Gujarat.
9. What pricing options are available for accessing the report?
Pricing options include single-user, multi-user, and enterprise licenses priced at USD 4750, USD 5250, and USD 8750 respectively.
10. Is the market size provided in terms of value or volume?
The market size is provided in terms of value, measured in Million and volume, measured in K Tons.
11. Are there any specific market keywords associated with the report?
Yes, the market keyword associated with the report is "Purified Terephthalic Acid Market," which aids in identifying and referencing the specific market segment covered.
12. How do I determine which pricing option suits my needs best?
The pricing options vary based on user requirements and access needs. Individual users may opt for single-user licenses, while businesses requiring broader access may choose multi-user or enterprise licenses for cost-effective access to the report.
13. Are there any additional resources or data provided in the Purified Terephthalic Acid Market report?
While the report offers comprehensive insights, it's advisable to review the specific contents or supplementary materials provided to ascertain if additional resources or data are available.
14. How can I stay updated on further developments or reports in the Purified Terephthalic Acid Market?
To stay informed about further developments, trends, and reports in the Purified Terephthalic Acid Market, consider subscribing to industry newsletters, following relevant companies and organizations, or regularly checking reputable industry news sources and publications.
Methodology
Step 1 - Identification of Relevant Samples Size from Population Database


Step 2 - Approaches for Defining Global Market Size (Value, Volume* & Price*)

Note*: In applicable scenarios
Step 3 - Data Sources
Primary Research
- Web Analytics
- Survey Reports
- Research Institute
- Latest Research Reports
- Opinion Leaders
Secondary Research
- Annual Reports
- White Paper
- Latest Press Release
- Industry Association
- Paid Database
- Investor Presentations

Step 4 - Data Triangulation
Involves using different sources of information in order to increase the validity of a study
These sources are likely to be stakeholders in a program - participants, other researchers, program staff, other community members, and so on.
Then we put all data in single framework & apply various statistical tools to find out the dynamic on the market.
During the analysis stage, feedback from the stakeholder groups would be compared to determine areas of agreement as well as areas of divergence


