
Key Insights
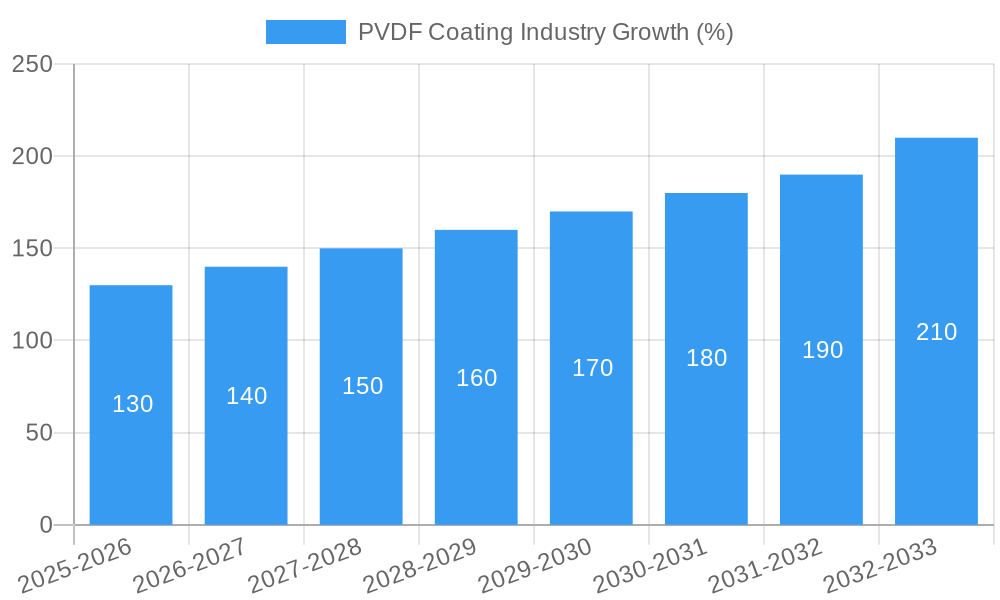
The global PVDF coating market, valued at $1.8 billion in 2025, is projected to experience robust growth, driven by a compound annual growth rate (CAGR) of 7.2% from 2025 to 2033. This expansion is fueled by several key factors. The increasing demand for corrosion-resistant and high-performance coatings across diverse industries, particularly in chemical processing, electronics manufacturing, and construction, is a major driver. Furthermore, the growing adoption of PVDF coatings in infrastructure projects, owing to their exceptional durability and longevity, contributes significantly to market growth. Stringent environmental regulations promoting sustainable and eco-friendly coating solutions further bolster the market. The market segmentation reveals a strong preference for PVDF copolymers due to their superior balance of properties and cost-effectiveness. Geographically, North America and Asia-Pacific are expected to dominate the market, driven by substantial infrastructure development and industrial activities in these regions. However, competitive pressures from alternative coating materials and fluctuating raw material prices represent potential challenges to market growth.
The competitive landscape is characterized by a mix of established global players and regional manufacturers. Companies like Solvay, Akzonobel, and BASF, with their extensive research and development capabilities, hold significant market shares. However, smaller, specialized coating providers are also gaining traction, particularly those focusing on niche applications and offering tailored solutions. Future growth will be influenced by technological advancements in PVDF coating formulations, leading to enhanced performance characteristics and expanded application areas. The increasing focus on sustainable manufacturing practices and the development of environmentally friendly PVDF coatings will further shape the market's trajectory in the coming years. Specific regional growth will be influenced by factors such as economic development, infrastructural investments, and the adoption of stringent environmental norms.

PVDF Coating Industry: A Comprehensive Market Report (2019-2033)
This comprehensive report provides a detailed analysis of the global PVDF coating industry, offering invaluable insights for industry professionals, investors, and strategic decision-makers. With a study period spanning 2019-2033, a base year of 2025, and a forecast period of 2025-2033, this report leverages extensive market research and data analysis to present a clear and actionable understanding of this dynamic sector. The global PVDF coating market is projected to reach a value of $XX Billion by 2033, exhibiting a robust CAGR of XX% during the forecast period.
PVDF Coating Industry Market Structure & Innovation Trends
The PVDF coating industry exhibits a moderately concentrated market structure, with several key players holding significant market share. Hitech Coatings, Metal Coatings Corp, Whitford Corporation, and Solvay are among the leading companies, collectively accounting for an estimated XX% of the global market in 2025. The market is characterized by intense competition, driven by innovation in PVDF copolymer and terpolymer formulations, along with advancements in application techniques. Regulatory frameworks, particularly those focused on environmental sustainability and VOC emissions, are playing a crucial role in shaping industry practices. Product substitutes, such as fluoropolymer coatings and other high-performance coatings, pose a competitive challenge. The industry has witnessed several significant M&A activities in recent years, with deal values exceeding $XX Billion since 2019. End-user demographics are shifting towards industries demanding superior durability and corrosion resistance, driving demand for specialized PVDF coatings.
- Market Share (2025): Top 5 players: XX%
- M&A Deal Value (2019-2024): >$XX Billion
- Key Innovation Drivers: Enhanced durability, corrosion resistance, improved aesthetics, sustainable formulations.
PVDF Coating Industry Market Dynamics & Trends
The PVDF coating market is experiencing robust growth, fueled by several key factors. Increased construction activity globally, particularly in developing economies, is a primary driver, alongside the growing demand for corrosion-resistant coatings in the chemical and aerospace & defense sectors. Technological advancements, such as the development of self-cleaning and anti-graffiti coatings, are enhancing the appeal of PVDF coatings. Consumer preferences are shifting towards environmentally friendly and sustainable products, pushing manufacturers to innovate in this area. Competitive dynamics are intensifying, with companies focusing on product differentiation, cost optimization, and expanding their geographical reach. The market penetration of PVDF coatings in emerging applications, such as renewable energy infrastructure, is steadily increasing. Overall, the market is expected to maintain a healthy CAGR of XX% from 2025 to 2033.
Dominant Regions & Segments in PVDF Coating Industry
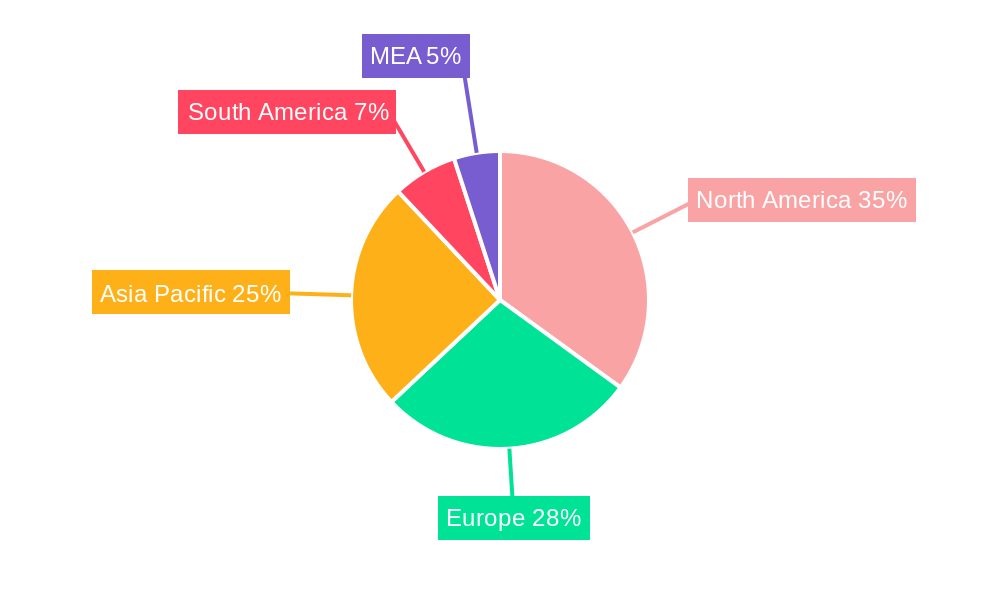
The North American region currently holds the largest share of the global PVDF coating market, driven by robust construction activity and a strong presence of major industry players. Within the market segments, the construction end-user industry accounts for the largest share of consumption, followed by the chemical and electrical & electronics sectors. Regarding coating types, PVDF copolymers dominate the market due to their cost-effectiveness and performance characteristics.
- Key Drivers in North America: Strong construction industry, robust infrastructure spending.
- Key Drivers in Asia Pacific: Rapid industrialization, rising infrastructure investments.
- Dominant End-User Segment: Construction (XX% of market share).
- Dominant Coating Type: PVDF Copolymers (XX% of market share).
PVDF Coating Industry Product Innovations
Recent years have witnessed significant advancements in PVDF coating technology. Manufacturers are focusing on developing coatings with enhanced durability, corrosion resistance, and self-cleaning properties. New application techniques, such as powder coating and electrostatic spraying, are improving the efficiency and cost-effectiveness of application. The integration of nanotechnology is leading to the development of coatings with enhanced UV resistance and improved aesthetic appeal. These innovations are expanding the applicability of PVDF coatings into new markets, providing a strong competitive advantage to manufacturers.
Report Scope & Segmentation Analysis
This report segments the PVDF coating market based on type (PVDF, PVDF Copolymers, PVDF Terpolymers) and end-user industry (Chemical, Electrical & Electronics, Construction, Aerospace & Defense, Others). Each segment is analyzed in detail, providing growth projections, market sizes, and competitive dynamics. The construction segment is projected to experience the highest growth rate, driven by ongoing infrastructure development globally. The aerospace & defense segment is expected to witness significant growth, propelled by the demand for high-performance coatings in aircraft and military applications. The chemical industry continues to be a key driver, demanding specialized PVDF coatings for corrosion protection in harsh environments.
Key Drivers of PVDF Coating Industry Growth
Several factors are driving the growth of the PVDF coating industry. Technological advancements leading to improved coating performance and efficiency are a significant contributor. Strong growth in the construction, chemical, and aerospace & defense sectors fuels market demand. Favorable government policies promoting sustainable building practices and infrastructure development provide additional support.
Challenges in the PVDF Coating Industry Sector
The PVDF coating industry faces several challenges. Fluctuations in raw material prices, particularly for PVDF resin, impact production costs. Stringent environmental regulations necessitate investments in cleaner production technologies. Intense competition among manufacturers necessitates a focus on product differentiation and cost optimization. Supply chain disruptions can also significantly impact production and market availability.
Emerging Opportunities in PVDF Coating Industry
The PVDF coating industry presents promising opportunities. The growing demand for sustainable and energy-efficient buildings creates a substantial market for high-performance, environmentally friendly PVDF coatings. Expansion into new applications, such as renewable energy infrastructure and advanced electronics, offers significant potential. The development of innovative coatings with specialized functionalities, such as anti-microbial and self-healing properties, presents new growth avenues.
Leading Players in the PVDF Coating Industry Market
- Hitech Coatings
- Metal Coatings Corp
- Whitford Corporation
- TIGER Coatings GmbH & Co KG
- Solvay
- Akzonobel N V
- DNT SINGAPORE PTE LTD
- KECO Coatings
- PPG Industries Inc
- BASF SE
- NIPPON PAINT
- The Sherwin-Williams Company
- Toefco Engineered Coating Systems
Key Developments in PVDF Coating Industry
- 2022 Q4: Solvay launched a new generation of sustainable PVDF coatings.
- 2023 Q1: Whitford Corporation acquired a smaller competitor, expanding its market share.
- 2023 Q3: BASF announced a significant investment in expanding its PVDF resin production capacity. (Further developments can be added here as they occur.)
Future Outlook for PVDF Coating Industry Market
The future of the PVDF coating industry appears bright. Continued growth in key end-user sectors, coupled with ongoing technological innovation, will fuel market expansion. The increasing focus on sustainability and the development of eco-friendly coatings will drive further demand. Strategic partnerships and mergers and acquisitions will shape the competitive landscape. The market is poised for continued growth, with significant opportunities for established players and new entrants alike.
PVDF Coating Industry Segmentation
-
1. Type
- 1.1. PVDF
- 1.2. Copolymers PVDF
- 1.3. Terpolymers PVDF
-
2. End-User Industry
- 2.1. Chemical
- 2.2. Electrical & Electronics
- 2.3. Construction
- 2.4. Aerospace & Defense
- 2.5. Others
PVDF Coating Industry Segmentation By Geography
-
1. Asia Pacific
- 1.1. China
- 1.2. India
- 1.3. Japan
- 1.4. South Korea
- 1.5. Rest of Asia Pacific
-
2. North America
- 2.1. United States
- 2.2. Canada
- 2.3. Mexico
-
3. Europe
- 3.1. Germany
- 3.2. United Kingdom
- 3.3. Italy
- 3.4. France
- 3.5. Rest of Europe
-
4. South America
- 4.1. Brazil
- 4.2. Argentina
- 4.3. Rest of South America
- 5. Middle East
-
6. Saudi Arabia
- 6.1. South Africa
- 6.2. Rest of Middle East
PVDF Coating Industry REPORT HIGHLIGHTS
| Aspects | Details |
|---|---|
| Study Period | 2019-2033 |
| Base Year | 2024 |
| Estimated Year | 2025 |
| Forecast Period | 2025-2033 |
| Historical Period | 2019-2024 |
| Growth Rate | CAGR of 7.2% from 2019-2033 |
| Segmentation |
|
Table of Contents
- 1. Introduction
- 1.1. Research Scope
- 1.2. Market Segmentation
- 1.3. Research Methodology
- 1.4. Definitions and Assumptions
- 2. Executive Summary
- 2.1. Introduction
- 3. Market Dynamics
- 3.1. Introduction
- 3.2. Market Drivers
- 3.2.1. ; Growing Infrastructure and Industrialization in Asia-Pacific; Others
- 3.3. Market Restrains
- 3.3.1. ; Threat of Substitutes
- 3.4. Market Trends
- 3.4.1. Construction Segment to Dominate the Market
- 4. Market Factor Analysis
- 4.1. Porters Five Forces
- 4.2. Supply/Value Chain
- 4.3. PESTEL analysis
- 4.4. Market Entropy
- 4.5. Patent/Trademark Analysis
- 5. Global PVDF Coating Industry Analysis, Insights and Forecast, 2019-2031
- 5.1. Market Analysis, Insights and Forecast - by Type
- 5.1.1. PVDF
- 5.1.2. Copolymers PVDF
- 5.1.3. Terpolymers PVDF
- 5.2. Market Analysis, Insights and Forecast - by End-User Industry
- 5.2.1. Chemical
- 5.2.2. Electrical & Electronics
- 5.2.3. Construction
- 5.2.4. Aerospace & Defense
- 5.2.5. Others
- 5.3. Market Analysis, Insights and Forecast - by Region
- 5.3.1. Asia Pacific
- 5.3.2. North America
- 5.3.3. Europe
- 5.3.4. South America
- 5.3.5. Middle East
- 5.3.6. Saudi Arabia
- 5.1. Market Analysis, Insights and Forecast - by Type
- 6. Asia Pacific PVDF Coating Industry Analysis, Insights and Forecast, 2019-2031
- 6.1. Market Analysis, Insights and Forecast - by Type
- 6.1.1. PVDF
- 6.1.2. Copolymers PVDF
- 6.1.3. Terpolymers PVDF
- 6.2. Market Analysis, Insights and Forecast - by End-User Industry
- 6.2.1. Chemical
- 6.2.2. Electrical & Electronics
- 6.2.3. Construction
- 6.2.4. Aerospace & Defense
- 6.2.5. Others
- 6.1. Market Analysis, Insights and Forecast - by Type
- 7. North America PVDF Coating Industry Analysis, Insights and Forecast, 2019-2031
- 7.1. Market Analysis, Insights and Forecast - by Type
- 7.1.1. PVDF
- 7.1.2. Copolymers PVDF
- 7.1.3. Terpolymers PVDF
- 7.2. Market Analysis, Insights and Forecast - by End-User Industry
- 7.2.1. Chemical
- 7.2.2. Electrical & Electronics
- 7.2.3. Construction
- 7.2.4. Aerospace & Defense
- 7.2.5. Others
- 7.1. Market Analysis, Insights and Forecast - by Type
- 8. Europe PVDF Coating Industry Analysis, Insights and Forecast, 2019-2031
- 8.1. Market Analysis, Insights and Forecast - by Type
- 8.1.1. PVDF
- 8.1.2. Copolymers PVDF
- 8.1.3. Terpolymers PVDF
- 8.2. Market Analysis, Insights and Forecast - by End-User Industry
- 8.2.1. Chemical
- 8.2.2. Electrical & Electronics
- 8.2.3. Construction
- 8.2.4. Aerospace & Defense
- 8.2.5. Others
- 8.1. Market Analysis, Insights and Forecast - by Type
- 9. South America PVDF Coating Industry Analysis, Insights and Forecast, 2019-2031
- 9.1. Market Analysis, Insights and Forecast - by Type
- 9.1.1. PVDF
- 9.1.2. Copolymers PVDF
- 9.1.3. Terpolymers PVDF
- 9.2. Market Analysis, Insights and Forecast - by End-User Industry
- 9.2.1. Chemical
- 9.2.2. Electrical & Electronics
- 9.2.3. Construction
- 9.2.4. Aerospace & Defense
- 9.2.5. Others
- 9.1. Market Analysis, Insights and Forecast - by Type
- 10. Middle East PVDF Coating Industry Analysis, Insights and Forecast, 2019-2031
- 10.1. Market Analysis, Insights and Forecast - by Type
- 10.1.1. PVDF
- 10.1.2. Copolymers PVDF
- 10.1.3. Terpolymers PVDF
- 10.2. Market Analysis, Insights and Forecast - by End-User Industry
- 10.2.1. Chemical
- 10.2.2. Electrical & Electronics
- 10.2.3. Construction
- 10.2.4. Aerospace & Defense
- 10.2.5. Others
- 10.1. Market Analysis, Insights and Forecast - by Type
- 11. Saudi Arabia PVDF Coating Industry Analysis, Insights and Forecast, 2019-2031
- 11.1. Market Analysis, Insights and Forecast - by Type
- 11.1.1. PVDF
- 11.1.2. Copolymers PVDF
- 11.1.3. Terpolymers PVDF
- 11.2. Market Analysis, Insights and Forecast - by End-User Industry
- 11.2.1. Chemical
- 11.2.2. Electrical & Electronics
- 11.2.3. Construction
- 11.2.4. Aerospace & Defense
- 11.2.5. Others
- 11.1. Market Analysis, Insights and Forecast - by Type
- 12. North America PVDF Coating Industry Analysis, Insights and Forecast, 2019-2031
- 12.1. Market Analysis, Insights and Forecast - By Country/Sub-region
- 12.1.1 United States
- 12.1.2 Canada
- 12.1.3 Mexico
- 13. Europe PVDF Coating Industry Analysis, Insights and Forecast, 2019-2031
- 13.1. Market Analysis, Insights and Forecast - By Country/Sub-region
- 13.1.1 Germany
- 13.1.2 France
- 13.1.3 Italy
- 13.1.4 United Kingdom
- 13.1.5 Netherlands
- 13.1.6 Rest of Europe
- 14. Asia Pacific PVDF Coating Industry Analysis, Insights and Forecast, 2019-2031
- 14.1. Market Analysis, Insights and Forecast - By Country/Sub-region
- 14.1.1 China
- 14.1.2 Japan
- 14.1.3 India
- 14.1.4 South Korea
- 14.1.5 Taiwan
- 14.1.6 Australia
- 14.1.7 Rest of Asia-Pacific
- 15. South America PVDF Coating Industry Analysis, Insights and Forecast, 2019-2031
- 15.1. Market Analysis, Insights and Forecast - By Country/Sub-region
- 15.1.1 Brazil
- 15.1.2 Argentina
- 15.1.3 Rest of South America
- 16. MEA PVDF Coating Industry Analysis, Insights and Forecast, 2019-2031
- 16.1. Market Analysis, Insights and Forecast - By Country/Sub-region
- 16.1.1 Middle East
- 16.1.2 Africa
- 17. Competitive Analysis
- 17.1. Global Market Share Analysis 2024
- 17.2. Company Profiles
- 17.2.1 Hitech Coatings
- 17.2.1.1. Overview
- 17.2.1.2. Products
- 17.2.1.3. SWOT Analysis
- 17.2.1.4. Recent Developments
- 17.2.1.5. Financials (Based on Availability)
- 17.2.2 Metal Coatings Corp
- 17.2.2.1. Overview
- 17.2.2.2. Products
- 17.2.2.3. SWOT Analysis
- 17.2.2.4. Recent Developments
- 17.2.2.5. Financials (Based on Availability)
- 17.2.3 Whitford Corporation
- 17.2.3.1. Overview
- 17.2.3.2. Products
- 17.2.3.3. SWOT Analysis
- 17.2.3.4. Recent Developments
- 17.2.3.5. Financials (Based on Availability)
- 17.2.4 TIGER Coatings GmbH & Co KG
- 17.2.4.1. Overview
- 17.2.4.2. Products
- 17.2.4.3. SWOT Analysis
- 17.2.4.4. Recent Developments
- 17.2.4.5. Financials (Based on Availability)
- 17.2.5 Solvay
- 17.2.5.1. Overview
- 17.2.5.2. Products
- 17.2.5.3. SWOT Analysis
- 17.2.5.4. Recent Developments
- 17.2.5.5. Financials (Based on Availability)
- 17.2.6 Akzonobel N V
- 17.2.6.1. Overview
- 17.2.6.2. Products
- 17.2.6.3. SWOT Analysis
- 17.2.6.4. Recent Developments
- 17.2.6.5. Financials (Based on Availability)
- 17.2.7 DNT SINGAPORE PTE LTD
- 17.2.7.1. Overview
- 17.2.7.2. Products
- 17.2.7.3. SWOT Analysis
- 17.2.7.4. Recent Developments
- 17.2.7.5. Financials (Based on Availability)
- 17.2.8 KECO Coatings
- 17.2.8.1. Overview
- 17.2.8.2. Products
- 17.2.8.3. SWOT Analysis
- 17.2.8.4. Recent Developments
- 17.2.8.5. Financials (Based on Availability)
- 17.2.9 PPG Industries Inc
- 17.2.9.1. Overview
- 17.2.9.2. Products
- 17.2.9.3. SWOT Analysis
- 17.2.9.4. Recent Developments
- 17.2.9.5. Financials (Based on Availability)
- 17.2.10 BASF SE
- 17.2.10.1. Overview
- 17.2.10.2. Products
- 17.2.10.3. SWOT Analysis
- 17.2.10.4. Recent Developments
- 17.2.10.5. Financials (Based on Availability)
- 17.2.11 NIPPON PAINT
- 17.2.11.1. Overview
- 17.2.11.2. Products
- 17.2.11.3. SWOT Analysis
- 17.2.11.4. Recent Developments
- 17.2.11.5. Financials (Based on Availability)
- 17.2.12 The Sherwin- Williams Company
- 17.2.12.1. Overview
- 17.2.12.2. Products
- 17.2.12.3. SWOT Analysis
- 17.2.12.4. Recent Developments
- 17.2.12.5. Financials (Based on Availability)
- 17.2.13 Toefco Engineered Coating Systems
- 17.2.13.1. Overview
- 17.2.13.2. Products
- 17.2.13.3. SWOT Analysis
- 17.2.13.4. Recent Developments
- 17.2.13.5. Financials (Based on Availability)
- 17.2.1 Hitech Coatings
List of Figures
- Figure 1: Global PVDF Coating Industry Revenue Breakdown (Billion, %) by Region 2024 & 2032
- Figure 2: Global PVDF Coating Industry Volume Breakdown (K Tons, %) by Region 2024 & 2032
- Figure 3: North America PVDF Coating Industry Revenue (Billion), by Country 2024 & 2032
- Figure 4: North America PVDF Coating Industry Volume (K Tons), by Country 2024 & 2032
- Figure 5: North America PVDF Coating Industry Revenue Share (%), by Country 2024 & 2032
- Figure 6: North America PVDF Coating Industry Volume Share (%), by Country 2024 & 2032
- Figure 7: Europe PVDF Coating Industry Revenue (Billion), by Country 2024 & 2032
- Figure 8: Europe PVDF Coating Industry Volume (K Tons), by Country 2024 & 2032
- Figure 9: Europe PVDF Coating Industry Revenue Share (%), by Country 2024 & 2032
- Figure 10: Europe PVDF Coating Industry Volume Share (%), by Country 2024 & 2032
- Figure 11: Asia Pacific PVDF Coating Industry Revenue (Billion), by Country 2024 & 2032
- Figure 12: Asia Pacific PVDF Coating Industry Volume (K Tons), by Country 2024 & 2032
- Figure 13: Asia Pacific PVDF Coating Industry Revenue Share (%), by Country 2024 & 2032
- Figure 14: Asia Pacific PVDF Coating Industry Volume Share (%), by Country 2024 & 2032
- Figure 15: South America PVDF Coating Industry Revenue (Billion), by Country 2024 & 2032
- Figure 16: South America PVDF Coating Industry Volume (K Tons), by Country 2024 & 2032
- Figure 17: South America PVDF Coating Industry Revenue Share (%), by Country 2024 & 2032
- Figure 18: South America PVDF Coating Industry Volume Share (%), by Country 2024 & 2032
- Figure 19: MEA PVDF Coating Industry Revenue (Billion), by Country 2024 & 2032
- Figure 20: MEA PVDF Coating Industry Volume (K Tons), by Country 2024 & 2032
- Figure 21: MEA PVDF Coating Industry Revenue Share (%), by Country 2024 & 2032
- Figure 22: MEA PVDF Coating Industry Volume Share (%), by Country 2024 & 2032
- Figure 23: Asia Pacific PVDF Coating Industry Revenue (Billion), by Type 2024 & 2032
- Figure 24: Asia Pacific PVDF Coating Industry Volume (K Tons), by Type 2024 & 2032
- Figure 25: Asia Pacific PVDF Coating Industry Revenue Share (%), by Type 2024 & 2032
- Figure 26: Asia Pacific PVDF Coating Industry Volume Share (%), by Type 2024 & 2032
- Figure 27: Asia Pacific PVDF Coating Industry Revenue (Billion), by End-User Industry 2024 & 2032
- Figure 28: Asia Pacific PVDF Coating Industry Volume (K Tons), by End-User Industry 2024 & 2032
- Figure 29: Asia Pacific PVDF Coating Industry Revenue Share (%), by End-User Industry 2024 & 2032
- Figure 30: Asia Pacific PVDF Coating Industry Volume Share (%), by End-User Industry 2024 & 2032
- Figure 31: Asia Pacific PVDF Coating Industry Revenue (Billion), by Country 2024 & 2032
- Figure 32: Asia Pacific PVDF Coating Industry Volume (K Tons), by Country 2024 & 2032
- Figure 33: Asia Pacific PVDF Coating Industry Revenue Share (%), by Country 2024 & 2032
- Figure 34: Asia Pacific PVDF Coating Industry Volume Share (%), by Country 2024 & 2032
- Figure 35: North America PVDF Coating Industry Revenue (Billion), by Type 2024 & 2032
- Figure 36: North America PVDF Coating Industry Volume (K Tons), by Type 2024 & 2032
- Figure 37: North America PVDF Coating Industry Revenue Share (%), by Type 2024 & 2032
- Figure 38: North America PVDF Coating Industry Volume Share (%), by Type 2024 & 2032
- Figure 39: North America PVDF Coating Industry Revenue (Billion), by End-User Industry 2024 & 2032
- Figure 40: North America PVDF Coating Industry Volume (K Tons), by End-User Industry 2024 & 2032
- Figure 41: North America PVDF Coating Industry Revenue Share (%), by End-User Industry 2024 & 2032
- Figure 42: North America PVDF Coating Industry Volume Share (%), by End-User Industry 2024 & 2032
- Figure 43: North America PVDF Coating Industry Revenue (Billion), by Country 2024 & 2032
- Figure 44: North America PVDF Coating Industry Volume (K Tons), by Country 2024 & 2032
- Figure 45: North America PVDF Coating Industry Revenue Share (%), by Country 2024 & 2032
- Figure 46: North America PVDF Coating Industry Volume Share (%), by Country 2024 & 2032
- Figure 47: Europe PVDF Coating Industry Revenue (Billion), by Type 2024 & 2032
- Figure 48: Europe PVDF Coating Industry Volume (K Tons), by Type 2024 & 2032
- Figure 49: Europe PVDF Coating Industry Revenue Share (%), by Type 2024 & 2032
- Figure 50: Europe PVDF Coating Industry Volume Share (%), by Type 2024 & 2032
- Figure 51: Europe PVDF Coating Industry Revenue (Billion), by End-User Industry 2024 & 2032
- Figure 52: Europe PVDF Coating Industry Volume (K Tons), by End-User Industry 2024 & 2032
- Figure 53: Europe PVDF Coating Industry Revenue Share (%), by End-User Industry 2024 & 2032
- Figure 54: Europe PVDF Coating Industry Volume Share (%), by End-User Industry 2024 & 2032
- Figure 55: Europe PVDF Coating Industry Revenue (Billion), by Country 2024 & 2032
- Figure 56: Europe PVDF Coating Industry Volume (K Tons), by Country 2024 & 2032
- Figure 57: Europe PVDF Coating Industry Revenue Share (%), by Country 2024 & 2032
- Figure 58: Europe PVDF Coating Industry Volume Share (%), by Country 2024 & 2032
- Figure 59: South America PVDF Coating Industry Revenue (Billion), by Type 2024 & 2032
- Figure 60: South America PVDF Coating Industry Volume (K Tons), by Type 2024 & 2032
- Figure 61: South America PVDF Coating Industry Revenue Share (%), by Type 2024 & 2032
- Figure 62: South America PVDF Coating Industry Volume Share (%), by Type 2024 & 2032
- Figure 63: South America PVDF Coating Industry Revenue (Billion), by End-User Industry 2024 & 2032
- Figure 64: South America PVDF Coating Industry Volume (K Tons), by End-User Industry 2024 & 2032
- Figure 65: South America PVDF Coating Industry Revenue Share (%), by End-User Industry 2024 & 2032
- Figure 66: South America PVDF Coating Industry Volume Share (%), by End-User Industry 2024 & 2032
- Figure 67: South America PVDF Coating Industry Revenue (Billion), by Country 2024 & 2032
- Figure 68: South America PVDF Coating Industry Volume (K Tons), by Country 2024 & 2032
- Figure 69: South America PVDF Coating Industry Revenue Share (%), by Country 2024 & 2032
- Figure 70: South America PVDF Coating Industry Volume Share (%), by Country 2024 & 2032
- Figure 71: Middle East PVDF Coating Industry Revenue (Billion), by Type 2024 & 2032
- Figure 72: Middle East PVDF Coating Industry Volume (K Tons), by Type 2024 & 2032
- Figure 73: Middle East PVDF Coating Industry Revenue Share (%), by Type 2024 & 2032
- Figure 74: Middle East PVDF Coating Industry Volume Share (%), by Type 2024 & 2032
- Figure 75: Middle East PVDF Coating Industry Revenue (Billion), by End-User Industry 2024 & 2032
- Figure 76: Middle East PVDF Coating Industry Volume (K Tons), by End-User Industry 2024 & 2032
- Figure 77: Middle East PVDF Coating Industry Revenue Share (%), by End-User Industry 2024 & 2032
- Figure 78: Middle East PVDF Coating Industry Volume Share (%), by End-User Industry 2024 & 2032
- Figure 79: Middle East PVDF Coating Industry Revenue (Billion), by Country 2024 & 2032
- Figure 80: Middle East PVDF Coating Industry Volume (K Tons), by Country 2024 & 2032
- Figure 81: Middle East PVDF Coating Industry Revenue Share (%), by Country 2024 & 2032
- Figure 82: Middle East PVDF Coating Industry Volume Share (%), by Country 2024 & 2032
- Figure 83: Saudi Arabia PVDF Coating Industry Revenue (Billion), by Type 2024 & 2032
- Figure 84: Saudi Arabia PVDF Coating Industry Volume (K Tons), by Type 2024 & 2032
- Figure 85: Saudi Arabia PVDF Coating Industry Revenue Share (%), by Type 2024 & 2032
- Figure 86: Saudi Arabia PVDF Coating Industry Volume Share (%), by Type 2024 & 2032
- Figure 87: Saudi Arabia PVDF Coating Industry Revenue (Billion), by End-User Industry 2024 & 2032
- Figure 88: Saudi Arabia PVDF Coating Industry Volume (K Tons), by End-User Industry 2024 & 2032
- Figure 89: Saudi Arabia PVDF Coating Industry Revenue Share (%), by End-User Industry 2024 & 2032
- Figure 90: Saudi Arabia PVDF Coating Industry Volume Share (%), by End-User Industry 2024 & 2032
- Figure 91: Saudi Arabia PVDF Coating Industry Revenue (Billion), by Country 2024 & 2032
- Figure 92: Saudi Arabia PVDF Coating Industry Volume (K Tons), by Country 2024 & 2032
- Figure 93: Saudi Arabia PVDF Coating Industry Revenue Share (%), by Country 2024 & 2032
- Figure 94: Saudi Arabia PVDF Coating Industry Volume Share (%), by Country 2024 & 2032
List of Tables
- Table 1: Global PVDF Coating Industry Revenue Billion Forecast, by Region 2019 & 2032
- Table 2: Global PVDF Coating Industry Volume K Tons Forecast, by Region 2019 & 2032
- Table 3: Global PVDF Coating Industry Revenue Billion Forecast, by Type 2019 & 2032
- Table 4: Global PVDF Coating Industry Volume K Tons Forecast, by Type 2019 & 2032
- Table 5: Global PVDF Coating Industry Revenue Billion Forecast, by End-User Industry 2019 & 2032
- Table 6: Global PVDF Coating Industry Volume K Tons Forecast, by End-User Industry 2019 & 2032
- Table 7: Global PVDF Coating Industry Revenue Billion Forecast, by Region 2019 & 2032
- Table 8: Global PVDF Coating Industry Volume K Tons Forecast, by Region 2019 & 2032
- Table 9: Global PVDF Coating Industry Revenue Billion Forecast, by Country 2019 & 2032
- Table 10: Global PVDF Coating Industry Volume K Tons Forecast, by Country 2019 & 2032
- Table 11: United States PVDF Coating Industry Revenue (Billion) Forecast, by Application 2019 & 2032
- Table 12: United States PVDF Coating Industry Volume (K Tons) Forecast, by Application 2019 & 2032
- Table 13: Canada PVDF Coating Industry Revenue (Billion) Forecast, by Application 2019 & 2032
- Table 14: Canada PVDF Coating Industry Volume (K Tons) Forecast, by Application 2019 & 2032
- Table 15: Mexico PVDF Coating Industry Revenue (Billion) Forecast, by Application 2019 & 2032
- Table 16: Mexico PVDF Coating Industry Volume (K Tons) Forecast, by Application 2019 & 2032
- Table 17: Global PVDF Coating Industry Revenue Billion Forecast, by Country 2019 & 2032
- Table 18: Global PVDF Coating Industry Volume K Tons Forecast, by Country 2019 & 2032
- Table 19: Germany PVDF Coating Industry Revenue (Billion) Forecast, by Application 2019 & 2032
- Table 20: Germany PVDF Coating Industry Volume (K Tons) Forecast, by Application 2019 & 2032
- Table 21: France PVDF Coating Industry Revenue (Billion) Forecast, by Application 2019 & 2032
- Table 22: France PVDF Coating Industry Volume (K Tons) Forecast, by Application 2019 & 2032
- Table 23: Italy PVDF Coating Industry Revenue (Billion) Forecast, by Application 2019 & 2032
- Table 24: Italy PVDF Coating Industry Volume (K Tons) Forecast, by Application 2019 & 2032
- Table 25: United Kingdom PVDF Coating Industry Revenue (Billion) Forecast, by Application 2019 & 2032
- Table 26: United Kingdom PVDF Coating Industry Volume (K Tons) Forecast, by Application 2019 & 2032
- Table 27: Netherlands PVDF Coating Industry Revenue (Billion) Forecast, by Application 2019 & 2032
- Table 28: Netherlands PVDF Coating Industry Volume (K Tons) Forecast, by Application 2019 & 2032
- Table 29: Rest of Europe PVDF Coating Industry Revenue (Billion) Forecast, by Application 2019 & 2032
- Table 30: Rest of Europe PVDF Coating Industry Volume (K Tons) Forecast, by Application 2019 & 2032
- Table 31: Global PVDF Coating Industry Revenue Billion Forecast, by Country 2019 & 2032
- Table 32: Global PVDF Coating Industry Volume K Tons Forecast, by Country 2019 & 2032
- Table 33: China PVDF Coating Industry Revenue (Billion) Forecast, by Application 2019 & 2032
- Table 34: China PVDF Coating Industry Volume (K Tons) Forecast, by Application 2019 & 2032
- Table 35: Japan PVDF Coating Industry Revenue (Billion) Forecast, by Application 2019 & 2032
- Table 36: Japan PVDF Coating Industry Volume (K Tons) Forecast, by Application 2019 & 2032
- Table 37: India PVDF Coating Industry Revenue (Billion) Forecast, by Application 2019 & 2032
- Table 38: India PVDF Coating Industry Volume (K Tons) Forecast, by Application 2019 & 2032
- Table 39: South Korea PVDF Coating Industry Revenue (Billion) Forecast, by Application 2019 & 2032
- Table 40: South Korea PVDF Coating Industry Volume (K Tons) Forecast, by Application 2019 & 2032
- Table 41: Taiwan PVDF Coating Industry Revenue (Billion) Forecast, by Application 2019 & 2032
- Table 42: Taiwan PVDF Coating Industry Volume (K Tons) Forecast, by Application 2019 & 2032
- Table 43: Australia PVDF Coating Industry Revenue (Billion) Forecast, by Application 2019 & 2032
- Table 44: Australia PVDF Coating Industry Volume (K Tons) Forecast, by Application 2019 & 2032
- Table 45: Rest of Asia-Pacific PVDF Coating Industry Revenue (Billion) Forecast, by Application 2019 & 2032
- Table 46: Rest of Asia-Pacific PVDF Coating Industry Volume (K Tons) Forecast, by Application 2019 & 2032
- Table 47: Global PVDF Coating Industry Revenue Billion Forecast, by Country 2019 & 2032
- Table 48: Global PVDF Coating Industry Volume K Tons Forecast, by Country 2019 & 2032
- Table 49: Brazil PVDF Coating Industry Revenue (Billion) Forecast, by Application 2019 & 2032
- Table 50: Brazil PVDF Coating Industry Volume (K Tons) Forecast, by Application 2019 & 2032
- Table 51: Argentina PVDF Coating Industry Revenue (Billion) Forecast, by Application 2019 & 2032
- Table 52: Argentina PVDF Coating Industry Volume (K Tons) Forecast, by Application 2019 & 2032
- Table 53: Rest of South America PVDF Coating Industry Revenue (Billion) Forecast, by Application 2019 & 2032
- Table 54: Rest of South America PVDF Coating Industry Volume (K Tons) Forecast, by Application 2019 & 2032
- Table 55: Global PVDF Coating Industry Revenue Billion Forecast, by Country 2019 & 2032
- Table 56: Global PVDF Coating Industry Volume K Tons Forecast, by Country 2019 & 2032
- Table 57: Middle East PVDF Coating Industry Revenue (Billion) Forecast, by Application 2019 & 2032
- Table 58: Middle East PVDF Coating Industry Volume (K Tons) Forecast, by Application 2019 & 2032
- Table 59: Africa PVDF Coating Industry Revenue (Billion) Forecast, by Application 2019 & 2032
- Table 60: Africa PVDF Coating Industry Volume (K Tons) Forecast, by Application 2019 & 2032
- Table 61: Global PVDF Coating Industry Revenue Billion Forecast, by Type 2019 & 2032
- Table 62: Global PVDF Coating Industry Volume K Tons Forecast, by Type 2019 & 2032
- Table 63: Global PVDF Coating Industry Revenue Billion Forecast, by End-User Industry 2019 & 2032
- Table 64: Global PVDF Coating Industry Volume K Tons Forecast, by End-User Industry 2019 & 2032
- Table 65: Global PVDF Coating Industry Revenue Billion Forecast, by Country 2019 & 2032
- Table 66: Global PVDF Coating Industry Volume K Tons Forecast, by Country 2019 & 2032
- Table 67: China PVDF Coating Industry Revenue (Billion) Forecast, by Application 2019 & 2032
- Table 68: China PVDF Coating Industry Volume (K Tons) Forecast, by Application 2019 & 2032
- Table 69: India PVDF Coating Industry Revenue (Billion) Forecast, by Application 2019 & 2032
- Table 70: India PVDF Coating Industry Volume (K Tons) Forecast, by Application 2019 & 2032
- Table 71: Japan PVDF Coating Industry Revenue (Billion) Forecast, by Application 2019 & 2032
- Table 72: Japan PVDF Coating Industry Volume (K Tons) Forecast, by Application 2019 & 2032
- Table 73: South Korea PVDF Coating Industry Revenue (Billion) Forecast, by Application 2019 & 2032
- Table 74: South Korea PVDF Coating Industry Volume (K Tons) Forecast, by Application 2019 & 2032
- Table 75: Rest of Asia Pacific PVDF Coating Industry Revenue (Billion) Forecast, by Application 2019 & 2032
- Table 76: Rest of Asia Pacific PVDF Coating Industry Volume (K Tons) Forecast, by Application 2019 & 2032
- Table 77: Global PVDF Coating Industry Revenue Billion Forecast, by Type 2019 & 2032
- Table 78: Global PVDF Coating Industry Volume K Tons Forecast, by Type 2019 & 2032
- Table 79: Global PVDF Coating Industry Revenue Billion Forecast, by End-User Industry 2019 & 2032
- Table 80: Global PVDF Coating Industry Volume K Tons Forecast, by End-User Industry 2019 & 2032
- Table 81: Global PVDF Coating Industry Revenue Billion Forecast, by Country 2019 & 2032
- Table 82: Global PVDF Coating Industry Volume K Tons Forecast, by Country 2019 & 2032
- Table 83: United States PVDF Coating Industry Revenue (Billion) Forecast, by Application 2019 & 2032
- Table 84: United States PVDF Coating Industry Volume (K Tons) Forecast, by Application 2019 & 2032
- Table 85: Canada PVDF Coating Industry Revenue (Billion) Forecast, by Application 2019 & 2032
- Table 86: Canada PVDF Coating Industry Volume (K Tons) Forecast, by Application 2019 & 2032
- Table 87: Mexico PVDF Coating Industry Revenue (Billion) Forecast, by Application 2019 & 2032
- Table 88: Mexico PVDF Coating Industry Volume (K Tons) Forecast, by Application 2019 & 2032
- Table 89: Global PVDF Coating Industry Revenue Billion Forecast, by Type 2019 & 2032
- Table 90: Global PVDF Coating Industry Volume K Tons Forecast, by Type 2019 & 2032
- Table 91: Global PVDF Coating Industry Revenue Billion Forecast, by End-User Industry 2019 & 2032
- Table 92: Global PVDF Coating Industry Volume K Tons Forecast, by End-User Industry 2019 & 2032
- Table 93: Global PVDF Coating Industry Revenue Billion Forecast, by Country 2019 & 2032
- Table 94: Global PVDF Coating Industry Volume K Tons Forecast, by Country 2019 & 2032
- Table 95: Germany PVDF Coating Industry Revenue (Billion) Forecast, by Application 2019 & 2032
- Table 96: Germany PVDF Coating Industry Volume (K Tons) Forecast, by Application 2019 & 2032
- Table 97: United Kingdom PVDF Coating Industry Revenue (Billion) Forecast, by Application 2019 & 2032
- Table 98: United Kingdom PVDF Coating Industry Volume (K Tons) Forecast, by Application 2019 & 2032
- Table 99: Italy PVDF Coating Industry Revenue (Billion) Forecast, by Application 2019 & 2032
- Table 100: Italy PVDF Coating Industry Volume (K Tons) Forecast, by Application 2019 & 2032
- Table 101: France PVDF Coating Industry Revenue (Billion) Forecast, by Application 2019 & 2032
- Table 102: France PVDF Coating Industry Volume (K Tons) Forecast, by Application 2019 & 2032
- Table 103: Rest of Europe PVDF Coating Industry Revenue (Billion) Forecast, by Application 2019 & 2032
- Table 104: Rest of Europe PVDF Coating Industry Volume (K Tons) Forecast, by Application 2019 & 2032
- Table 105: Global PVDF Coating Industry Revenue Billion Forecast, by Type 2019 & 2032
- Table 106: Global PVDF Coating Industry Volume K Tons Forecast, by Type 2019 & 2032
- Table 107: Global PVDF Coating Industry Revenue Billion Forecast, by End-User Industry 2019 & 2032
- Table 108: Global PVDF Coating Industry Volume K Tons Forecast, by End-User Industry 2019 & 2032
- Table 109: Global PVDF Coating Industry Revenue Billion Forecast, by Country 2019 & 2032
- Table 110: Global PVDF Coating Industry Volume K Tons Forecast, by Country 2019 & 2032
- Table 111: Brazil PVDF Coating Industry Revenue (Billion) Forecast, by Application 2019 & 2032
- Table 112: Brazil PVDF Coating Industry Volume (K Tons) Forecast, by Application 2019 & 2032
- Table 113: Argentina PVDF Coating Industry Revenue (Billion) Forecast, by Application 2019 & 2032
- Table 114: Argentina PVDF Coating Industry Volume (K Tons) Forecast, by Application 2019 & 2032
- Table 115: Rest of South America PVDF Coating Industry Revenue (Billion) Forecast, by Application 2019 & 2032
- Table 116: Rest of South America PVDF Coating Industry Volume (K Tons) Forecast, by Application 2019 & 2032
- Table 117: Global PVDF Coating Industry Revenue Billion Forecast, by Type 2019 & 2032
- Table 118: Global PVDF Coating Industry Volume K Tons Forecast, by Type 2019 & 2032
- Table 119: Global PVDF Coating Industry Revenue Billion Forecast, by End-User Industry 2019 & 2032
- Table 120: Global PVDF Coating Industry Volume K Tons Forecast, by End-User Industry 2019 & 2032
- Table 121: Global PVDF Coating Industry Revenue Billion Forecast, by Country 2019 & 2032
- Table 122: Global PVDF Coating Industry Volume K Tons Forecast, by Country 2019 & 2032
- Table 123: Global PVDF Coating Industry Revenue Billion Forecast, by Type 2019 & 2032
- Table 124: Global PVDF Coating Industry Volume K Tons Forecast, by Type 2019 & 2032
- Table 125: Global PVDF Coating Industry Revenue Billion Forecast, by End-User Industry 2019 & 2032
- Table 126: Global PVDF Coating Industry Volume K Tons Forecast, by End-User Industry 2019 & 2032
- Table 127: Global PVDF Coating Industry Revenue Billion Forecast, by Country 2019 & 2032
- Table 128: Global PVDF Coating Industry Volume K Tons Forecast, by Country 2019 & 2032
- Table 129: South Africa PVDF Coating Industry Revenue (Billion) Forecast, by Application 2019 & 2032
- Table 130: South Africa PVDF Coating Industry Volume (K Tons) Forecast, by Application 2019 & 2032
- Table 131: Rest of Middle East PVDF Coating Industry Revenue (Billion) Forecast, by Application 2019 & 2032
- Table 132: Rest of Middle East PVDF Coating Industry Volume (K Tons) Forecast, by Application 2019 & 2032
Frequently Asked Questions
1. What is the projected Compound Annual Growth Rate (CAGR) of the PVDF Coating Industry?
The projected CAGR is approximately 7.2%.
2. Which companies are prominent players in the PVDF Coating Industry?
Key companies in the market include Hitech Coatings, Metal Coatings Corp, Whitford Corporation, TIGER Coatings GmbH & Co KG, Solvay, Akzonobel N V, DNT SINGAPORE PTE LTD, KECO Coatings, PPG Industries Inc, BASF SE, NIPPON PAINT, The Sherwin- Williams Company, Toefco Engineered Coating Systems.
3. What are the main segments of the PVDF Coating Industry?
The market segments include Type, End-User Industry.
4. Can you provide details about the market size?
The market size is estimated to be USD 1.8 Billion as of 2022.
5. What are some drivers contributing to market growth?
; Growing Infrastructure and Industrialization in Asia-Pacific; Others.
6. What are the notable trends driving market growth?
Construction Segment to Dominate the Market.
7. Are there any restraints impacting market growth?
; Threat of Substitutes.
8. Can you provide examples of recent developments in the market?
N/A
9. What pricing options are available for accessing the report?
Pricing options include single-user, multi-user, and enterprise licenses priced at USD 3,950, USD 4,950, and USD 6,950 respectively.
10. Is the market size provided in terms of value or volume?
The market size is provided in terms of value, measured in Billion and volume, measured in K Tons.
11. Are there any specific market keywords associated with the report?
Yes, the market keyword associated with the report is "PVDF Coating Industry," which aids in identifying and referencing the specific market segment covered.
12. How do I determine which pricing option suits my needs best?
The pricing options vary based on user requirements and access needs. Individual users may opt for single-user licenses, while businesses requiring broader access may choose multi-user or enterprise licenses for cost-effective access to the report.
13. Are there any additional resources or data provided in the PVDF Coating Industry report?
While the report offers comprehensive insights, it's advisable to review the specific contents or supplementary materials provided to ascertain if additional resources or data are available.
14. How can I stay updated on further developments or reports in the PVDF Coating Industry?
To stay informed about further developments, trends, and reports in the PVDF Coating Industry, consider subscribing to industry newsletters, following relevant companies and organizations, or regularly checking reputable industry news sources and publications.
Methodology
Step 1 - Identification of Relevant Samples Size from Population Database


Step 2 - Approaches for Defining Global Market Size (Value, Volume* & Price*)

Note*: In applicable scenarios
Step 3 - Data Sources
Primary Research
- Web Analytics
- Survey Reports
- Research Institute
- Latest Research Reports
- Opinion Leaders
Secondary Research
- Annual Reports
- White Paper
- Latest Press Release
- Industry Association
- Paid Database
- Investor Presentations

Step 4 - Data Triangulation
Involves using different sources of information in order to increase the validity of a study
These sources are likely to be stakeholders in a program - participants, other researchers, program staff, other community members, and so on.
Then we put all data in single framework & apply various statistical tools to find out the dynamic on the market.
During the analysis stage, feedback from the stakeholder groups would be compared to determine areas of agreement as well as areas of divergence


