
Key Insights
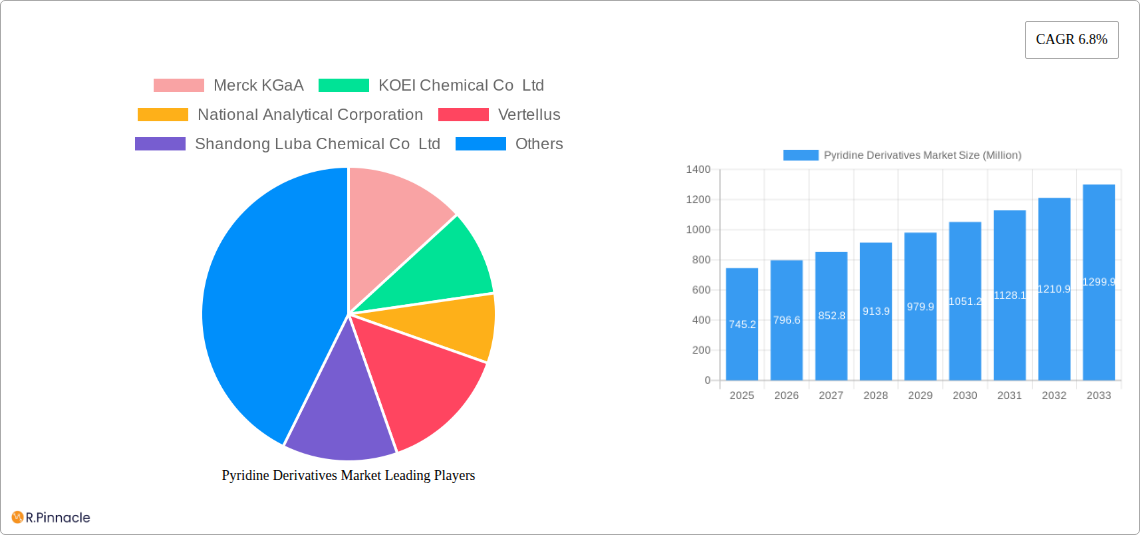
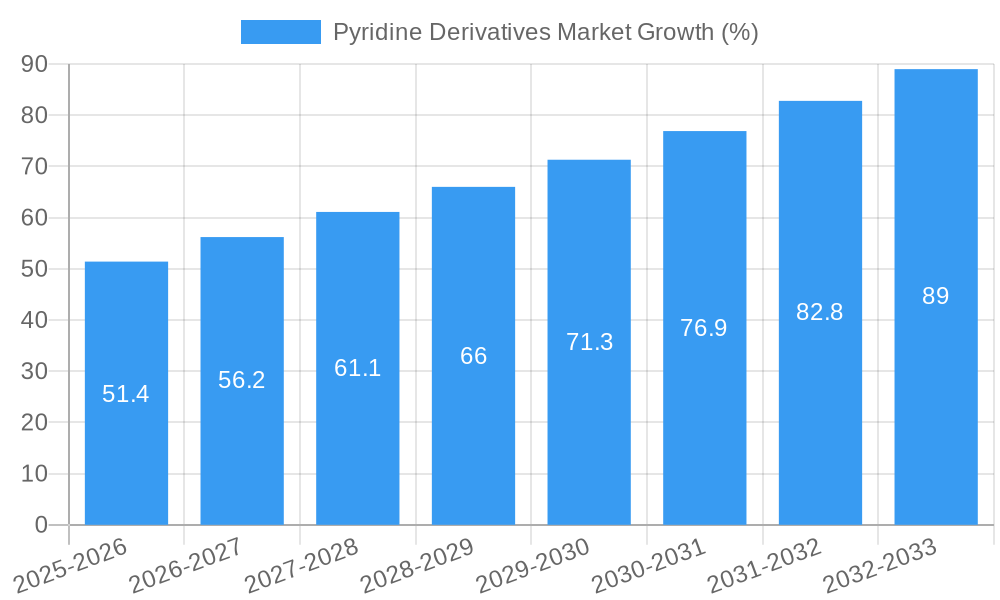
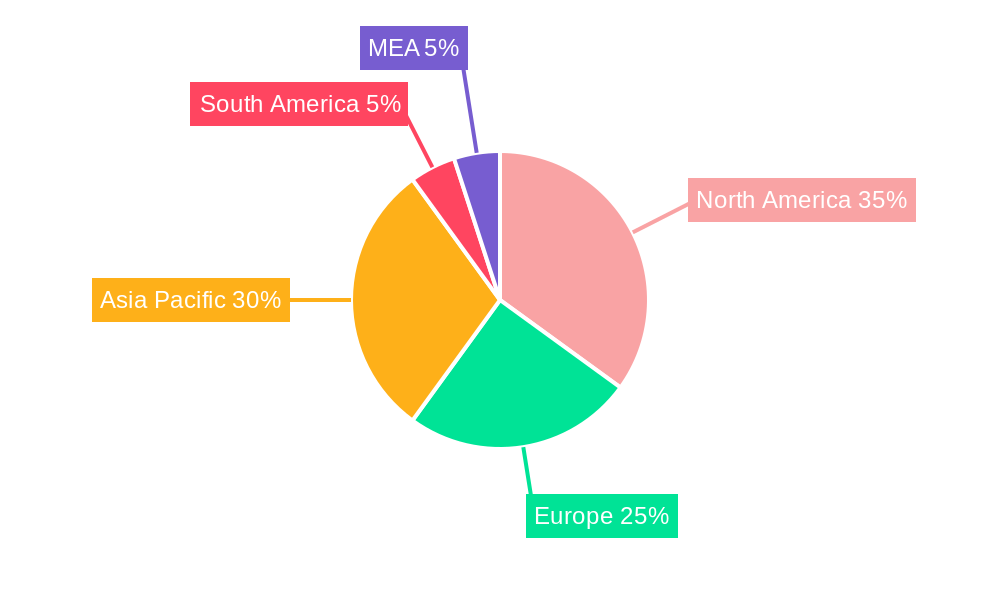
The Pyridine Derivatives market, valued at $745.2 million in 2025, is projected to experience robust growth, driven by increasing demand from key end-use industries such as agrochemicals and pharmaceuticals. The market's Compound Annual Growth Rate (CAGR) of 6.8% from 2025 to 2033 signifies a promising outlook. This growth is fueled by the rising use of pyridine derivatives in pesticide formulation for enhanced crop yields and their crucial role in the synthesis of various pharmaceuticals, including antibiotics and anti-inflammatory drugs. The increasing focus on sustainable agriculture and the development of novel, high-efficiency pesticides are also major contributors. Furthermore, the expanding electronics and textile industries are creating additional demand for specific pyridine derivatives with specialized properties. While market restraints may include regulatory hurdles related to environmental concerns and potential health risks associated with certain pyridine derivatives, advancements in synthesis technologies and the development of safer alternatives are mitigating these challenges. The market is segmented by type (Beta Picoline, Alpha Picoline, Gamma Picoline, and Others) and end-user industry (Agrochemicals, Pharmaceuticals, Electronics, Textiles, and Others), providing diversified growth opportunities. The geographical segmentation reveals strong market presence in North America and Asia Pacific, driven by established manufacturing bases and robust end-user industries. Future growth will likely be influenced by technological innovations leading to more efficient production processes and the exploration of new applications for pyridine derivatives in emerging industries.
The competitive landscape includes both established players like Merck KGaA, KOEI Chemical Co Ltd, and Vertellus, and regional manufacturers. These companies are focusing on strategic partnerships, collaborations, and expansion into new markets to maintain a strong position in this growing market. Continuous research and development efforts aimed at creating more environmentally friendly and effective pyridine derivatives will shape the market's future trajectory. Market segmentation analysis reveals that agrochemicals and pharmaceuticals currently dominate end-user demand, indicating significant future growth potential in these sectors with consistent innovation and regulatory compliance. The regional outlook points to continued dominance by North America and Asia Pacific regions due to their advanced chemical industries and large consumer markets, while other regions are expected to exhibit moderate growth fueled by increasing industrial activity and economic development.
Pyridine Derivatives Market: A Comprehensive Report (2019-2033)
This in-depth report provides a comprehensive analysis of the Pyridine Derivatives market, offering invaluable insights for industry professionals, investors, and strategic decision-makers. Covering the period from 2019 to 2033, with a focus on 2025, this report dissects market dynamics, competitive landscapes, and future growth potential. The study includes detailed segmentation analysis across type and end-user industries, along with key regional breakdowns.
Pyridine Derivatives Market Market Structure & Innovation Trends
This section analyzes the competitive landscape of the Pyridine Derivatives market, examining market concentration, innovation drivers, regulatory frameworks, and M&A activities. The market is moderately concentrated, with key players holding significant market share, although a considerable number of smaller players also exist. Innovation is driven primarily by the development of new applications in high-growth end-user industries such as pharmaceuticals and agrochemicals. Regulatory frameworks vary by region, impacting production and distribution. Product substitutes are limited, mainly focusing on alternative chemical compounds with similar functionalities. End-user demographics show a growing demand from emerging economies.
- Market Concentration: The top 5 players hold approximately xx% of the market share in 2025.
- M&A Activity: Significant M&A activity has been observed in the past five years, with deal values averaging xx Million. One notable example includes Trineso's acquisition of Synthomer PLC's vinyl pyridine latex business in May 2020.
- Innovation Drivers: Demand for high-performance pyridine derivatives in specialized applications is a major driver. Focus on sustainable and environmentally friendly production methods is increasing.
- Regulatory Landscape: Stringent environmental regulations influence production processes and waste management.
Pyridine Derivatives Market Market Dynamics & Trends
The Pyridine Derivatives market is experiencing robust growth, driven by rising demand from key end-user industries. Technological advancements are enabling the development of more efficient and cost-effective production methods. Changing consumer preferences towards sustainable and environmentally friendly products are shaping market trends. Intense competition among existing players is fueling innovation and pushing down prices.
- CAGR (2025-2033): xx%
- Market Penetration: The market penetration rate is projected to reach xx% by 2033.
- Growth Drivers: Increased demand from the pharmaceutical and agrochemical sectors is the primary growth driver. Advances in material science and chemical engineering are enhancing applications.
Dominant Regions & Segments in Pyridine Derivatives Market
The report identifies [Region Name] as the leading region for Pyridine Derivatives, driven by factors such as robust economic growth and a well-established chemical industry infrastructure. Within the segments, the Pharmaceutical end-user industry exhibits strong growth. Among the types, Alpha Picoline commands the largest market share due to its widespread applications.
- Key Drivers in [Region Name]:
- Strong economic growth
- Favorable government policies supporting chemical industry
- Well-developed infrastructure
- Availability of skilled labor
- Dominant Segment (Type): Alpha Picoline
- Dominant Segment (End-user): Pharmaceuticals
Pyridine Derivatives Market Product Innovations
Recent product innovations focus on developing high-purity pyridine derivatives with enhanced performance characteristics to meet the specific needs of various applications. This includes customized formulations tailored to optimize efficiency and reduce environmental impact. Technological advancements such as nanotechnology and process optimization are enhancing product quality and competitiveness.
Report Scope & Segmentation Analysis
This report comprehensively segments the Pyridine Derivatives market based on type (Beta Picoline, Alpha Picoline, Gamma Picoline, Other Types) and end-user industry (Agrochemicals, Pharmaceuticals, Electronics, Textiles, Other End-user Industries). Each segment's growth projections, market size, and competitive dynamics are analyzed in detail. For example, the pharmaceutical segment is expected to experience significant growth due to its wide applications in drug synthesis. Alpha Picoline is projected to dominate the market owing to its versatility.
Key Drivers of Pyridine Derivatives Market Growth
The Pyridine Derivatives market is propelled by several factors, including increasing demand from various end-use industries, especially pharmaceuticals and agrochemicals. Technological advancements leading to efficient production processes also contribute to growth. Favorable government regulations and policies in certain regions further support market expansion.
Challenges in the Pyridine Derivatives Market Sector
The Pyridine Derivatives market faces challenges like stringent environmental regulations impacting production costs and fluctuating raw material prices. Supply chain disruptions can also impact market stability. Intense competition and price pressures are additional challenges faced by market participants.
Emerging Opportunities in Pyridine Derivatives Market
Emerging opportunities exist in developing novel applications for pyridine derivatives in high-growth sectors like electronics and renewable energy. The development of biodegradable and sustainable pyridine derivatives offers significant growth potential. Expansion into new geographical markets, particularly in emerging economies, presents substantial opportunities.
Leading Players in the Pyridine Derivatives Market Market
- Merck KGaA
- KOEI Chemical Co Ltd
- National Analytical Corporation
- Vertellus
- Shandong Luba Chemical Co Ltd
- Alfa Aesar
- Lonza
- Resonance Specialties Limited
- Jubilant Life Sciences Limited
Key Developments in Pyridine Derivatives Market Industry
- May 2020: Trineso acquired the vinyl pyridine latex business from Synthomer PLC, expanding its product portfolio.
Future Outlook for Pyridine Derivatives Market Market
The Pyridine Derivatives market is poised for continued growth, driven by increasing demand from diverse industries, technological innovations, and expansion into new geographic regions. Strategic partnerships, investments in R&D, and focus on sustainable production methods will be crucial for future success. The market is expected to witness significant expansion over the forecast period.
Pyridine Derivatives Market Segmentation
-
1. Type
- 1.1. Beta Picoline
- 1.2. Alpha Picoline
- 1.3. Gamma Picoline
- 1.4. Other Types
-
2. End-user Industry
- 2.1. Agrochemicals
- 2.2. Pharmaceuticals
- 2.3. Electronics
- 2.4. Textiles
- 2.5. Other End-user Industries
Pyridine Derivatives Market Segmentation By Geography
-
1. Asia Pacific
- 1.1. China
- 1.2. India
- 1.3. Japan
- 1.4. South Korea
- 1.5. Rest of Asia Pacific
-
2. North America
- 2.1. United States
- 2.2. Canada
- 2.3. Mexico
-
3. Europe
- 3.1. Germany
- 3.2. United Kingdom
- 3.3. France
- 3.4. Italy
- 3.5. Rest of Europe
-
4. South America
- 4.1. Brazil
- 4.2. Argentina
- 4.3. Rest of South America
-
5. Middle East and Africa
- 5.1. Saudi Arabia
- 5.2. South Africa
- 5.3. Rest of Middle East and Africa
Pyridine Derivatives Market REPORT HIGHLIGHTS
| Aspects | Details |
|---|---|
| Study Period | 2019-2033 |
| Base Year | 2024 |
| Estimated Year | 2025 |
| Forecast Period | 2025-2033 |
| Historical Period | 2019-2024 |
| Growth Rate | CAGR of 6.8% from 2019-2033 |
| Segmentation |
|
Table of Contents
- 1. Introduction
- 1.1. Research Scope
- 1.2. Market Segmentation
- 1.3. Research Methodology
- 1.4. Definitions and Assumptions
- 2. Executive Summary
- 2.1. Introduction
- 3. Market Dynamics
- 3.1. Introduction
- 3.2. Market Drivers
- 3.2.1. Increasing Demand for Beta Picoline in Various Applications; Other Drivers
- 3.3. Market Restrains
- 3.3.1. Adverse Impact on Market Due to the COVID-19 Pandemic; Other Restraints
- 3.4. Market Trends
- 3.4.1. Increasing Demand for Beta Picoline
- 4. Market Factor Analysis
- 4.1. Porters Five Forces
- 4.2. Supply/Value Chain
- 4.3. PESTEL analysis
- 4.4. Market Entropy
- 4.5. Patent/Trademark Analysis
- 5. Global Pyridine Derivatives Market Analysis, Insights and Forecast, 2019-2031
- 5.1. Market Analysis, Insights and Forecast - by Type
- 5.1.1. Beta Picoline
- 5.1.2. Alpha Picoline
- 5.1.3. Gamma Picoline
- 5.1.4. Other Types
- 5.2. Market Analysis, Insights and Forecast - by End-user Industry
- 5.2.1. Agrochemicals
- 5.2.2. Pharmaceuticals
- 5.2.3. Electronics
- 5.2.4. Textiles
- 5.2.5. Other End-user Industries
- 5.3. Market Analysis, Insights and Forecast - by Region
- 5.3.1. Asia Pacific
- 5.3.2. North America
- 5.3.3. Europe
- 5.3.4. South America
- 5.3.5. Middle East and Africa
- 5.1. Market Analysis, Insights and Forecast - by Type
- 6. Asia Pacific Pyridine Derivatives Market Analysis, Insights and Forecast, 2019-2031
- 6.1. Market Analysis, Insights and Forecast - by Type
- 6.1.1. Beta Picoline
- 6.1.2. Alpha Picoline
- 6.1.3. Gamma Picoline
- 6.1.4. Other Types
- 6.2. Market Analysis, Insights and Forecast - by End-user Industry
- 6.2.1. Agrochemicals
- 6.2.2. Pharmaceuticals
- 6.2.3. Electronics
- 6.2.4. Textiles
- 6.2.5. Other End-user Industries
- 6.1. Market Analysis, Insights and Forecast - by Type
- 7. North America Pyridine Derivatives Market Analysis, Insights and Forecast, 2019-2031
- 7.1. Market Analysis, Insights and Forecast - by Type
- 7.1.1. Beta Picoline
- 7.1.2. Alpha Picoline
- 7.1.3. Gamma Picoline
- 7.1.4. Other Types
- 7.2. Market Analysis, Insights and Forecast - by End-user Industry
- 7.2.1. Agrochemicals
- 7.2.2. Pharmaceuticals
- 7.2.3. Electronics
- 7.2.4. Textiles
- 7.2.5. Other End-user Industries
- 7.1. Market Analysis, Insights and Forecast - by Type
- 8. Europe Pyridine Derivatives Market Analysis, Insights and Forecast, 2019-2031
- 8.1. Market Analysis, Insights and Forecast - by Type
- 8.1.1. Beta Picoline
- 8.1.2. Alpha Picoline
- 8.1.3. Gamma Picoline
- 8.1.4. Other Types
- 8.2. Market Analysis, Insights and Forecast - by End-user Industry
- 8.2.1. Agrochemicals
- 8.2.2. Pharmaceuticals
- 8.2.3. Electronics
- 8.2.4. Textiles
- 8.2.5. Other End-user Industries
- 8.1. Market Analysis, Insights and Forecast - by Type
- 9. South America Pyridine Derivatives Market Analysis, Insights and Forecast, 2019-2031
- 9.1. Market Analysis, Insights and Forecast - by Type
- 9.1.1. Beta Picoline
- 9.1.2. Alpha Picoline
- 9.1.3. Gamma Picoline
- 9.1.4. Other Types
- 9.2. Market Analysis, Insights and Forecast - by End-user Industry
- 9.2.1. Agrochemicals
- 9.2.2. Pharmaceuticals
- 9.2.3. Electronics
- 9.2.4. Textiles
- 9.2.5. Other End-user Industries
- 9.1. Market Analysis, Insights and Forecast - by Type
- 10. Middle East and Africa Pyridine Derivatives Market Analysis, Insights and Forecast, 2019-2031
- 10.1. Market Analysis, Insights and Forecast - by Type
- 10.1.1. Beta Picoline
- 10.1.2. Alpha Picoline
- 10.1.3. Gamma Picoline
- 10.1.4. Other Types
- 10.2. Market Analysis, Insights and Forecast - by End-user Industry
- 10.2.1. Agrochemicals
- 10.2.2. Pharmaceuticals
- 10.2.3. Electronics
- 10.2.4. Textiles
- 10.2.5. Other End-user Industries
- 10.1. Market Analysis, Insights and Forecast - by Type
- 11. North America Pyridine Derivatives Market Analysis, Insights and Forecast, 2019-2031
- 11.1. Market Analysis, Insights and Forecast - By Country/Sub-region
- 11.1.1 United States
- 11.1.2 Canada
- 11.1.3 Mexico
- 12. Europe Pyridine Derivatives Market Analysis, Insights and Forecast, 2019-2031
- 12.1. Market Analysis, Insights and Forecast - By Country/Sub-region
- 12.1.1 Germany
- 12.1.2 France
- 12.1.3 Italy
- 12.1.4 United Kingdom
- 12.1.5 Netherlands
- 12.1.6 Rest of Europe
- 13. Asia Pacific Pyridine Derivatives Market Analysis, Insights and Forecast, 2019-2031
- 13.1. Market Analysis, Insights and Forecast - By Country/Sub-region
- 13.1.1 China
- 13.1.2 Japan
- 13.1.3 India
- 13.1.4 South Korea
- 13.1.5 Taiwan
- 13.1.6 Australia
- 13.1.7 Rest of Asia-Pacific
- 14. South America Pyridine Derivatives Market Analysis, Insights and Forecast, 2019-2031
- 14.1. Market Analysis, Insights and Forecast - By Country/Sub-region
- 14.1.1 Brazil
- 14.1.2 Argentina
- 14.1.3 Rest of South America
- 15. MEA Pyridine Derivatives Market Analysis, Insights and Forecast, 2019-2031
- 15.1. Market Analysis, Insights and Forecast - By Country/Sub-region
- 15.1.1 Middle East
- 15.1.2 Africa
- 16. Competitive Analysis
- 16.1. Global Market Share Analysis 2024
- 16.2. Company Profiles
- 16.2.1 Merck KGaA
- 16.2.1.1. Overview
- 16.2.1.2. Products
- 16.2.1.3. SWOT Analysis
- 16.2.1.4. Recent Developments
- 16.2.1.5. Financials (Based on Availability)
- 16.2.2 KOEI Chemical Co Ltd
- 16.2.2.1. Overview
- 16.2.2.2. Products
- 16.2.2.3. SWOT Analysis
- 16.2.2.4. Recent Developments
- 16.2.2.5. Financials (Based on Availability)
- 16.2.3 National Analytical Corporation
- 16.2.3.1. Overview
- 16.2.3.2. Products
- 16.2.3.3. SWOT Analysis
- 16.2.3.4. Recent Developments
- 16.2.3.5. Financials (Based on Availability)
- 16.2.4 Vertellus
- 16.2.4.1. Overview
- 16.2.4.2. Products
- 16.2.4.3. SWOT Analysis
- 16.2.4.4. Recent Developments
- 16.2.4.5. Financials (Based on Availability)
- 16.2.5 Shandong Luba Chemical Co Ltd
- 16.2.5.1. Overview
- 16.2.5.2. Products
- 16.2.5.3. SWOT Analysis
- 16.2.5.4. Recent Developments
- 16.2.5.5. Financials (Based on Availability)
- 16.2.6 Alfa Aesar
- 16.2.6.1. Overview
- 16.2.6.2. Products
- 16.2.6.3. SWOT Analysis
- 16.2.6.4. Recent Developments
- 16.2.6.5. Financials (Based on Availability)
- 16.2.7 Lonza
- 16.2.7.1. Overview
- 16.2.7.2. Products
- 16.2.7.3. SWOT Analysis
- 16.2.7.4. Recent Developments
- 16.2.7.5. Financials (Based on Availability)
- 16.2.8 Resonance Specialties Limited
- 16.2.8.1. Overview
- 16.2.8.2. Products
- 16.2.8.3. SWOT Analysis
- 16.2.8.4. Recent Developments
- 16.2.8.5. Financials (Based on Availability)
- 16.2.9 Jubilant Life Sciences Limited
- 16.2.9.1. Overview
- 16.2.9.2. Products
- 16.2.9.3. SWOT Analysis
- 16.2.9.4. Recent Developments
- 16.2.9.5. Financials (Based on Availability)
- 16.2.1 Merck KGaA
List of Figures
- Figure 1: Global Pyridine Derivatives Market Revenue Breakdown (Million, %) by Region 2024 & 2032
- Figure 2: Global Pyridine Derivatives Market Volume Breakdown (K Tons, %) by Region 2024 & 2032
- Figure 3: North America Pyridine Derivatives Market Revenue (Million), by Country 2024 & 2032
- Figure 4: North America Pyridine Derivatives Market Volume (K Tons), by Country 2024 & 2032
- Figure 5: North America Pyridine Derivatives Market Revenue Share (%), by Country 2024 & 2032
- Figure 6: North America Pyridine Derivatives Market Volume Share (%), by Country 2024 & 2032
- Figure 7: Europe Pyridine Derivatives Market Revenue (Million), by Country 2024 & 2032
- Figure 8: Europe Pyridine Derivatives Market Volume (K Tons), by Country 2024 & 2032
- Figure 9: Europe Pyridine Derivatives Market Revenue Share (%), by Country 2024 & 2032
- Figure 10: Europe Pyridine Derivatives Market Volume Share (%), by Country 2024 & 2032
- Figure 11: Asia Pacific Pyridine Derivatives Market Revenue (Million), by Country 2024 & 2032
- Figure 12: Asia Pacific Pyridine Derivatives Market Volume (K Tons), by Country 2024 & 2032
- Figure 13: Asia Pacific Pyridine Derivatives Market Revenue Share (%), by Country 2024 & 2032
- Figure 14: Asia Pacific Pyridine Derivatives Market Volume Share (%), by Country 2024 & 2032
- Figure 15: South America Pyridine Derivatives Market Revenue (Million), by Country 2024 & 2032
- Figure 16: South America Pyridine Derivatives Market Volume (K Tons), by Country 2024 & 2032
- Figure 17: South America Pyridine Derivatives Market Revenue Share (%), by Country 2024 & 2032
- Figure 18: South America Pyridine Derivatives Market Volume Share (%), by Country 2024 & 2032
- Figure 19: MEA Pyridine Derivatives Market Revenue (Million), by Country 2024 & 2032
- Figure 20: MEA Pyridine Derivatives Market Volume (K Tons), by Country 2024 & 2032
- Figure 21: MEA Pyridine Derivatives Market Revenue Share (%), by Country 2024 & 2032
- Figure 22: MEA Pyridine Derivatives Market Volume Share (%), by Country 2024 & 2032
- Figure 23: Asia Pacific Pyridine Derivatives Market Revenue (Million), by Type 2024 & 2032
- Figure 24: Asia Pacific Pyridine Derivatives Market Volume (K Tons), by Type 2024 & 2032
- Figure 25: Asia Pacific Pyridine Derivatives Market Revenue Share (%), by Type 2024 & 2032
- Figure 26: Asia Pacific Pyridine Derivatives Market Volume Share (%), by Type 2024 & 2032
- Figure 27: Asia Pacific Pyridine Derivatives Market Revenue (Million), by End-user Industry 2024 & 2032
- Figure 28: Asia Pacific Pyridine Derivatives Market Volume (K Tons), by End-user Industry 2024 & 2032
- Figure 29: Asia Pacific Pyridine Derivatives Market Revenue Share (%), by End-user Industry 2024 & 2032
- Figure 30: Asia Pacific Pyridine Derivatives Market Volume Share (%), by End-user Industry 2024 & 2032
- Figure 31: Asia Pacific Pyridine Derivatives Market Revenue (Million), by Country 2024 & 2032
- Figure 32: Asia Pacific Pyridine Derivatives Market Volume (K Tons), by Country 2024 & 2032
- Figure 33: Asia Pacific Pyridine Derivatives Market Revenue Share (%), by Country 2024 & 2032
- Figure 34: Asia Pacific Pyridine Derivatives Market Volume Share (%), by Country 2024 & 2032
- Figure 35: North America Pyridine Derivatives Market Revenue (Million), by Type 2024 & 2032
- Figure 36: North America Pyridine Derivatives Market Volume (K Tons), by Type 2024 & 2032
- Figure 37: North America Pyridine Derivatives Market Revenue Share (%), by Type 2024 & 2032
- Figure 38: North America Pyridine Derivatives Market Volume Share (%), by Type 2024 & 2032
- Figure 39: North America Pyridine Derivatives Market Revenue (Million), by End-user Industry 2024 & 2032
- Figure 40: North America Pyridine Derivatives Market Volume (K Tons), by End-user Industry 2024 & 2032
- Figure 41: North America Pyridine Derivatives Market Revenue Share (%), by End-user Industry 2024 & 2032
- Figure 42: North America Pyridine Derivatives Market Volume Share (%), by End-user Industry 2024 & 2032
- Figure 43: North America Pyridine Derivatives Market Revenue (Million), by Country 2024 & 2032
- Figure 44: North America Pyridine Derivatives Market Volume (K Tons), by Country 2024 & 2032
- Figure 45: North America Pyridine Derivatives Market Revenue Share (%), by Country 2024 & 2032
- Figure 46: North America Pyridine Derivatives Market Volume Share (%), by Country 2024 & 2032
- Figure 47: Europe Pyridine Derivatives Market Revenue (Million), by Type 2024 & 2032
- Figure 48: Europe Pyridine Derivatives Market Volume (K Tons), by Type 2024 & 2032
- Figure 49: Europe Pyridine Derivatives Market Revenue Share (%), by Type 2024 & 2032
- Figure 50: Europe Pyridine Derivatives Market Volume Share (%), by Type 2024 & 2032
- Figure 51: Europe Pyridine Derivatives Market Revenue (Million), by End-user Industry 2024 & 2032
- Figure 52: Europe Pyridine Derivatives Market Volume (K Tons), by End-user Industry 2024 & 2032
- Figure 53: Europe Pyridine Derivatives Market Revenue Share (%), by End-user Industry 2024 & 2032
- Figure 54: Europe Pyridine Derivatives Market Volume Share (%), by End-user Industry 2024 & 2032
- Figure 55: Europe Pyridine Derivatives Market Revenue (Million), by Country 2024 & 2032
- Figure 56: Europe Pyridine Derivatives Market Volume (K Tons), by Country 2024 & 2032
- Figure 57: Europe Pyridine Derivatives Market Revenue Share (%), by Country 2024 & 2032
- Figure 58: Europe Pyridine Derivatives Market Volume Share (%), by Country 2024 & 2032
- Figure 59: South America Pyridine Derivatives Market Revenue (Million), by Type 2024 & 2032
- Figure 60: South America Pyridine Derivatives Market Volume (K Tons), by Type 2024 & 2032
- Figure 61: South America Pyridine Derivatives Market Revenue Share (%), by Type 2024 & 2032
- Figure 62: South America Pyridine Derivatives Market Volume Share (%), by Type 2024 & 2032
- Figure 63: South America Pyridine Derivatives Market Revenue (Million), by End-user Industry 2024 & 2032
- Figure 64: South America Pyridine Derivatives Market Volume (K Tons), by End-user Industry 2024 & 2032
- Figure 65: South America Pyridine Derivatives Market Revenue Share (%), by End-user Industry 2024 & 2032
- Figure 66: South America Pyridine Derivatives Market Volume Share (%), by End-user Industry 2024 & 2032
- Figure 67: South America Pyridine Derivatives Market Revenue (Million), by Country 2024 & 2032
- Figure 68: South America Pyridine Derivatives Market Volume (K Tons), by Country 2024 & 2032
- Figure 69: South America Pyridine Derivatives Market Revenue Share (%), by Country 2024 & 2032
- Figure 70: South America Pyridine Derivatives Market Volume Share (%), by Country 2024 & 2032
- Figure 71: Middle East and Africa Pyridine Derivatives Market Revenue (Million), by Type 2024 & 2032
- Figure 72: Middle East and Africa Pyridine Derivatives Market Volume (K Tons), by Type 2024 & 2032
- Figure 73: Middle East and Africa Pyridine Derivatives Market Revenue Share (%), by Type 2024 & 2032
- Figure 74: Middle East and Africa Pyridine Derivatives Market Volume Share (%), by Type 2024 & 2032
- Figure 75: Middle East and Africa Pyridine Derivatives Market Revenue (Million), by End-user Industry 2024 & 2032
- Figure 76: Middle East and Africa Pyridine Derivatives Market Volume (K Tons), by End-user Industry 2024 & 2032
- Figure 77: Middle East and Africa Pyridine Derivatives Market Revenue Share (%), by End-user Industry 2024 & 2032
- Figure 78: Middle East and Africa Pyridine Derivatives Market Volume Share (%), by End-user Industry 2024 & 2032
- Figure 79: Middle East and Africa Pyridine Derivatives Market Revenue (Million), by Country 2024 & 2032
- Figure 80: Middle East and Africa Pyridine Derivatives Market Volume (K Tons), by Country 2024 & 2032
- Figure 81: Middle East and Africa Pyridine Derivatives Market Revenue Share (%), by Country 2024 & 2032
- Figure 82: Middle East and Africa Pyridine Derivatives Market Volume Share (%), by Country 2024 & 2032
List of Tables
- Table 1: Global Pyridine Derivatives Market Revenue Million Forecast, by Region 2019 & 2032
- Table 2: Global Pyridine Derivatives Market Volume K Tons Forecast, by Region 2019 & 2032
- Table 3: Global Pyridine Derivatives Market Revenue Million Forecast, by Type 2019 & 2032
- Table 4: Global Pyridine Derivatives Market Volume K Tons Forecast, by Type 2019 & 2032
- Table 5: Global Pyridine Derivatives Market Revenue Million Forecast, by End-user Industry 2019 & 2032
- Table 6: Global Pyridine Derivatives Market Volume K Tons Forecast, by End-user Industry 2019 & 2032
- Table 7: Global Pyridine Derivatives Market Revenue Million Forecast, by Region 2019 & 2032
- Table 8: Global Pyridine Derivatives Market Volume K Tons Forecast, by Region 2019 & 2032
- Table 9: Global Pyridine Derivatives Market Revenue Million Forecast, by Country 2019 & 2032
- Table 10: Global Pyridine Derivatives Market Volume K Tons Forecast, by Country 2019 & 2032
- Table 11: United States Pyridine Derivatives Market Revenue (Million) Forecast, by Application 2019 & 2032
- Table 12: United States Pyridine Derivatives Market Volume (K Tons) Forecast, by Application 2019 & 2032
- Table 13: Canada Pyridine Derivatives Market Revenue (Million) Forecast, by Application 2019 & 2032
- Table 14: Canada Pyridine Derivatives Market Volume (K Tons) Forecast, by Application 2019 & 2032
- Table 15: Mexico Pyridine Derivatives Market Revenue (Million) Forecast, by Application 2019 & 2032
- Table 16: Mexico Pyridine Derivatives Market Volume (K Tons) Forecast, by Application 2019 & 2032
- Table 17: Global Pyridine Derivatives Market Revenue Million Forecast, by Country 2019 & 2032
- Table 18: Global Pyridine Derivatives Market Volume K Tons Forecast, by Country 2019 & 2032
- Table 19: Germany Pyridine Derivatives Market Revenue (Million) Forecast, by Application 2019 & 2032
- Table 20: Germany Pyridine Derivatives Market Volume (K Tons) Forecast, by Application 2019 & 2032
- Table 21: France Pyridine Derivatives Market Revenue (Million) Forecast, by Application 2019 & 2032
- Table 22: France Pyridine Derivatives Market Volume (K Tons) Forecast, by Application 2019 & 2032
- Table 23: Italy Pyridine Derivatives Market Revenue (Million) Forecast, by Application 2019 & 2032
- Table 24: Italy Pyridine Derivatives Market Volume (K Tons) Forecast, by Application 2019 & 2032
- Table 25: United Kingdom Pyridine Derivatives Market Revenue (Million) Forecast, by Application 2019 & 2032
- Table 26: United Kingdom Pyridine Derivatives Market Volume (K Tons) Forecast, by Application 2019 & 2032
- Table 27: Netherlands Pyridine Derivatives Market Revenue (Million) Forecast, by Application 2019 & 2032
- Table 28: Netherlands Pyridine Derivatives Market Volume (K Tons) Forecast, by Application 2019 & 2032
- Table 29: Rest of Europe Pyridine Derivatives Market Revenue (Million) Forecast, by Application 2019 & 2032
- Table 30: Rest of Europe Pyridine Derivatives Market Volume (K Tons) Forecast, by Application 2019 & 2032
- Table 31: Global Pyridine Derivatives Market Revenue Million Forecast, by Country 2019 & 2032
- Table 32: Global Pyridine Derivatives Market Volume K Tons Forecast, by Country 2019 & 2032
- Table 33: China Pyridine Derivatives Market Revenue (Million) Forecast, by Application 2019 & 2032
- Table 34: China Pyridine Derivatives Market Volume (K Tons) Forecast, by Application 2019 & 2032
- Table 35: Japan Pyridine Derivatives Market Revenue (Million) Forecast, by Application 2019 & 2032
- Table 36: Japan Pyridine Derivatives Market Volume (K Tons) Forecast, by Application 2019 & 2032
- Table 37: India Pyridine Derivatives Market Revenue (Million) Forecast, by Application 2019 & 2032
- Table 38: India Pyridine Derivatives Market Volume (K Tons) Forecast, by Application 2019 & 2032
- Table 39: South Korea Pyridine Derivatives Market Revenue (Million) Forecast, by Application 2019 & 2032
- Table 40: South Korea Pyridine Derivatives Market Volume (K Tons) Forecast, by Application 2019 & 2032
- Table 41: Taiwan Pyridine Derivatives Market Revenue (Million) Forecast, by Application 2019 & 2032
- Table 42: Taiwan Pyridine Derivatives Market Volume (K Tons) Forecast, by Application 2019 & 2032
- Table 43: Australia Pyridine Derivatives Market Revenue (Million) Forecast, by Application 2019 & 2032
- Table 44: Australia Pyridine Derivatives Market Volume (K Tons) Forecast, by Application 2019 & 2032
- Table 45: Rest of Asia-Pacific Pyridine Derivatives Market Revenue (Million) Forecast, by Application 2019 & 2032
- Table 46: Rest of Asia-Pacific Pyridine Derivatives Market Volume (K Tons) Forecast, by Application 2019 & 2032
- Table 47: Global Pyridine Derivatives Market Revenue Million Forecast, by Country 2019 & 2032
- Table 48: Global Pyridine Derivatives Market Volume K Tons Forecast, by Country 2019 & 2032
- Table 49: Brazil Pyridine Derivatives Market Revenue (Million) Forecast, by Application 2019 & 2032
- Table 50: Brazil Pyridine Derivatives Market Volume (K Tons) Forecast, by Application 2019 & 2032
- Table 51: Argentina Pyridine Derivatives Market Revenue (Million) Forecast, by Application 2019 & 2032
- Table 52: Argentina Pyridine Derivatives Market Volume (K Tons) Forecast, by Application 2019 & 2032
- Table 53: Rest of South America Pyridine Derivatives Market Revenue (Million) Forecast, by Application 2019 & 2032
- Table 54: Rest of South America Pyridine Derivatives Market Volume (K Tons) Forecast, by Application 2019 & 2032
- Table 55: Global Pyridine Derivatives Market Revenue Million Forecast, by Country 2019 & 2032
- Table 56: Global Pyridine Derivatives Market Volume K Tons Forecast, by Country 2019 & 2032
- Table 57: Middle East Pyridine Derivatives Market Revenue (Million) Forecast, by Application 2019 & 2032
- Table 58: Middle East Pyridine Derivatives Market Volume (K Tons) Forecast, by Application 2019 & 2032
- Table 59: Africa Pyridine Derivatives Market Revenue (Million) Forecast, by Application 2019 & 2032
- Table 60: Africa Pyridine Derivatives Market Volume (K Tons) Forecast, by Application 2019 & 2032
- Table 61: Global Pyridine Derivatives Market Revenue Million Forecast, by Type 2019 & 2032
- Table 62: Global Pyridine Derivatives Market Volume K Tons Forecast, by Type 2019 & 2032
- Table 63: Global Pyridine Derivatives Market Revenue Million Forecast, by End-user Industry 2019 & 2032
- Table 64: Global Pyridine Derivatives Market Volume K Tons Forecast, by End-user Industry 2019 & 2032
- Table 65: Global Pyridine Derivatives Market Revenue Million Forecast, by Country 2019 & 2032
- Table 66: Global Pyridine Derivatives Market Volume K Tons Forecast, by Country 2019 & 2032
- Table 67: China Pyridine Derivatives Market Revenue (Million) Forecast, by Application 2019 & 2032
- Table 68: China Pyridine Derivatives Market Volume (K Tons) Forecast, by Application 2019 & 2032
- Table 69: India Pyridine Derivatives Market Revenue (Million) Forecast, by Application 2019 & 2032
- Table 70: India Pyridine Derivatives Market Volume (K Tons) Forecast, by Application 2019 & 2032
- Table 71: Japan Pyridine Derivatives Market Revenue (Million) Forecast, by Application 2019 & 2032
- Table 72: Japan Pyridine Derivatives Market Volume (K Tons) Forecast, by Application 2019 & 2032
- Table 73: South Korea Pyridine Derivatives Market Revenue (Million) Forecast, by Application 2019 & 2032
- Table 74: South Korea Pyridine Derivatives Market Volume (K Tons) Forecast, by Application 2019 & 2032
- Table 75: Rest of Asia Pacific Pyridine Derivatives Market Revenue (Million) Forecast, by Application 2019 & 2032
- Table 76: Rest of Asia Pacific Pyridine Derivatives Market Volume (K Tons) Forecast, by Application 2019 & 2032
- Table 77: Global Pyridine Derivatives Market Revenue Million Forecast, by Type 2019 & 2032
- Table 78: Global Pyridine Derivatives Market Volume K Tons Forecast, by Type 2019 & 2032
- Table 79: Global Pyridine Derivatives Market Revenue Million Forecast, by End-user Industry 2019 & 2032
- Table 80: Global Pyridine Derivatives Market Volume K Tons Forecast, by End-user Industry 2019 & 2032
- Table 81: Global Pyridine Derivatives Market Revenue Million Forecast, by Country 2019 & 2032
- Table 82: Global Pyridine Derivatives Market Volume K Tons Forecast, by Country 2019 & 2032
- Table 83: United States Pyridine Derivatives Market Revenue (Million) Forecast, by Application 2019 & 2032
- Table 84: United States Pyridine Derivatives Market Volume (K Tons) Forecast, by Application 2019 & 2032
- Table 85: Canada Pyridine Derivatives Market Revenue (Million) Forecast, by Application 2019 & 2032
- Table 86: Canada Pyridine Derivatives Market Volume (K Tons) Forecast, by Application 2019 & 2032
- Table 87: Mexico Pyridine Derivatives Market Revenue (Million) Forecast, by Application 2019 & 2032
- Table 88: Mexico Pyridine Derivatives Market Volume (K Tons) Forecast, by Application 2019 & 2032
- Table 89: Global Pyridine Derivatives Market Revenue Million Forecast, by Type 2019 & 2032
- Table 90: Global Pyridine Derivatives Market Volume K Tons Forecast, by Type 2019 & 2032
- Table 91: Global Pyridine Derivatives Market Revenue Million Forecast, by End-user Industry 2019 & 2032
- Table 92: Global Pyridine Derivatives Market Volume K Tons Forecast, by End-user Industry 2019 & 2032
- Table 93: Global Pyridine Derivatives Market Revenue Million Forecast, by Country 2019 & 2032
- Table 94: Global Pyridine Derivatives Market Volume K Tons Forecast, by Country 2019 & 2032
- Table 95: Germany Pyridine Derivatives Market Revenue (Million) Forecast, by Application 2019 & 2032
- Table 96: Germany Pyridine Derivatives Market Volume (K Tons) Forecast, by Application 2019 & 2032
- Table 97: United Kingdom Pyridine Derivatives Market Revenue (Million) Forecast, by Application 2019 & 2032
- Table 98: United Kingdom Pyridine Derivatives Market Volume (K Tons) Forecast, by Application 2019 & 2032
- Table 99: France Pyridine Derivatives Market Revenue (Million) Forecast, by Application 2019 & 2032
- Table 100: France Pyridine Derivatives Market Volume (K Tons) Forecast, by Application 2019 & 2032
- Table 101: Italy Pyridine Derivatives Market Revenue (Million) Forecast, by Application 2019 & 2032
- Table 102: Italy Pyridine Derivatives Market Volume (K Tons) Forecast, by Application 2019 & 2032
- Table 103: Rest of Europe Pyridine Derivatives Market Revenue (Million) Forecast, by Application 2019 & 2032
- Table 104: Rest of Europe Pyridine Derivatives Market Volume (K Tons) Forecast, by Application 2019 & 2032
- Table 105: Global Pyridine Derivatives Market Revenue Million Forecast, by Type 2019 & 2032
- Table 106: Global Pyridine Derivatives Market Volume K Tons Forecast, by Type 2019 & 2032
- Table 107: Global Pyridine Derivatives Market Revenue Million Forecast, by End-user Industry 2019 & 2032
- Table 108: Global Pyridine Derivatives Market Volume K Tons Forecast, by End-user Industry 2019 & 2032
- Table 109: Global Pyridine Derivatives Market Revenue Million Forecast, by Country 2019 & 2032
- Table 110: Global Pyridine Derivatives Market Volume K Tons Forecast, by Country 2019 & 2032
- Table 111: Brazil Pyridine Derivatives Market Revenue (Million) Forecast, by Application 2019 & 2032
- Table 112: Brazil Pyridine Derivatives Market Volume (K Tons) Forecast, by Application 2019 & 2032
- Table 113: Argentina Pyridine Derivatives Market Revenue (Million) Forecast, by Application 2019 & 2032
- Table 114: Argentina Pyridine Derivatives Market Volume (K Tons) Forecast, by Application 2019 & 2032
- Table 115: Rest of South America Pyridine Derivatives Market Revenue (Million) Forecast, by Application 2019 & 2032
- Table 116: Rest of South America Pyridine Derivatives Market Volume (K Tons) Forecast, by Application 2019 & 2032
- Table 117: Global Pyridine Derivatives Market Revenue Million Forecast, by Type 2019 & 2032
- Table 118: Global Pyridine Derivatives Market Volume K Tons Forecast, by Type 2019 & 2032
- Table 119: Global Pyridine Derivatives Market Revenue Million Forecast, by End-user Industry 2019 & 2032
- Table 120: Global Pyridine Derivatives Market Volume K Tons Forecast, by End-user Industry 2019 & 2032
- Table 121: Global Pyridine Derivatives Market Revenue Million Forecast, by Country 2019 & 2032
- Table 122: Global Pyridine Derivatives Market Volume K Tons Forecast, by Country 2019 & 2032
- Table 123: Saudi Arabia Pyridine Derivatives Market Revenue (Million) Forecast, by Application 2019 & 2032
- Table 124: Saudi Arabia Pyridine Derivatives Market Volume (K Tons) Forecast, by Application 2019 & 2032
- Table 125: South Africa Pyridine Derivatives Market Revenue (Million) Forecast, by Application 2019 & 2032
- Table 126: South Africa Pyridine Derivatives Market Volume (K Tons) Forecast, by Application 2019 & 2032
- Table 127: Rest of Middle East and Africa Pyridine Derivatives Market Revenue (Million) Forecast, by Application 2019 & 2032
- Table 128: Rest of Middle East and Africa Pyridine Derivatives Market Volume (K Tons) Forecast, by Application 2019 & 2032
Frequently Asked Questions
1. What is the projected Compound Annual Growth Rate (CAGR) of the Pyridine Derivatives Market?
The projected CAGR is approximately 6.8%.
2. Which companies are prominent players in the Pyridine Derivatives Market?
Key companies in the market include Merck KGaA, KOEI Chemical Co Ltd, National Analytical Corporation, Vertellus, Shandong Luba Chemical Co Ltd, Alfa Aesar, Lonza, Resonance Specialties Limited, Jubilant Life Sciences Limited.
3. What are the main segments of the Pyridine Derivatives Market?
The market segments include Type, End-user Industry.
4. Can you provide details about the market size?
The market size is estimated to be USD 745.2 Million as of 2022.
5. What are some drivers contributing to market growth?
Increasing Demand for Beta Picoline in Various Applications; Other Drivers.
6. What are the notable trends driving market growth?
Increasing Demand for Beta Picoline.
7. Are there any restraints impacting market growth?
Adverse Impact on Market Due to the COVID-19 Pandemic; Other Restraints.
8. Can you provide examples of recent developments in the market?
In May 2020, Trineso announced the acquisition of the vinyl pyridine latex business from Synthomer PLC, which, in turn, enhanced the company's product portfolio.
9. What pricing options are available for accessing the report?
Pricing options include single-user, multi-user, and enterprise licenses priced at USD 4750, USD 5250, and USD 8750 respectively.
10. Is the market size provided in terms of value or volume?
The market size is provided in terms of value, measured in Million and volume, measured in K Tons.
11. Are there any specific market keywords associated with the report?
Yes, the market keyword associated with the report is "Pyridine Derivatives Market," which aids in identifying and referencing the specific market segment covered.
12. How do I determine which pricing option suits my needs best?
The pricing options vary based on user requirements and access needs. Individual users may opt for single-user licenses, while businesses requiring broader access may choose multi-user or enterprise licenses for cost-effective access to the report.
13. Are there any additional resources or data provided in the Pyridine Derivatives Market report?
While the report offers comprehensive insights, it's advisable to review the specific contents or supplementary materials provided to ascertain if additional resources or data are available.
14. How can I stay updated on further developments or reports in the Pyridine Derivatives Market?
To stay informed about further developments, trends, and reports in the Pyridine Derivatives Market, consider subscribing to industry newsletters, following relevant companies and organizations, or regularly checking reputable industry news sources and publications.
Methodology
Step 1 - Identification of Relevant Samples Size from Population Database


Step 2 - Approaches for Defining Global Market Size (Value, Volume* & Price*)

Note*: In applicable scenarios
Step 3 - Data Sources
Primary Research
- Web Analytics
- Survey Reports
- Research Institute
- Latest Research Reports
- Opinion Leaders
Secondary Research
- Annual Reports
- White Paper
- Latest Press Release
- Industry Association
- Paid Database
- Investor Presentations

Step 4 - Data Triangulation
Involves using different sources of information in order to increase the validity of a study
These sources are likely to be stakeholders in a program - participants, other researchers, program staff, other community members, and so on.
Then we put all data in single framework & apply various statistical tools to find out the dynamic on the market.
During the analysis stage, feedback from the stakeholder groups would be compared to determine areas of agreement as well as areas of divergence


