


Key Insights
The Radiotherapy Motion Management market is poised for significant expansion, reaching an estimated $7.1 billion in 2024, with a projected Compound Annual Growth Rate (CAGR) of 3.8% throughout the forecast period of 2025-2033. This robust growth is primarily fueled by the increasing incidence of cancer globally, driving higher demand for advanced radiation therapy techniques that require precise tumor targeting. Technological advancements in motion management systems, such as real-time tracking and adaptive radiotherapy, are revolutionizing treatment accuracy and efficacy, making them indispensable tools in modern oncology. Furthermore, growing awareness among healthcare providers and patients about the benefits of motion management in minimizing radiation dose to healthy tissues and improving treatment outcomes is a key growth driver. The expanding infrastructure for radiation therapy, particularly in developing regions, and increasing investments in R&D by leading companies are also contributing to the market's upward trajectory.

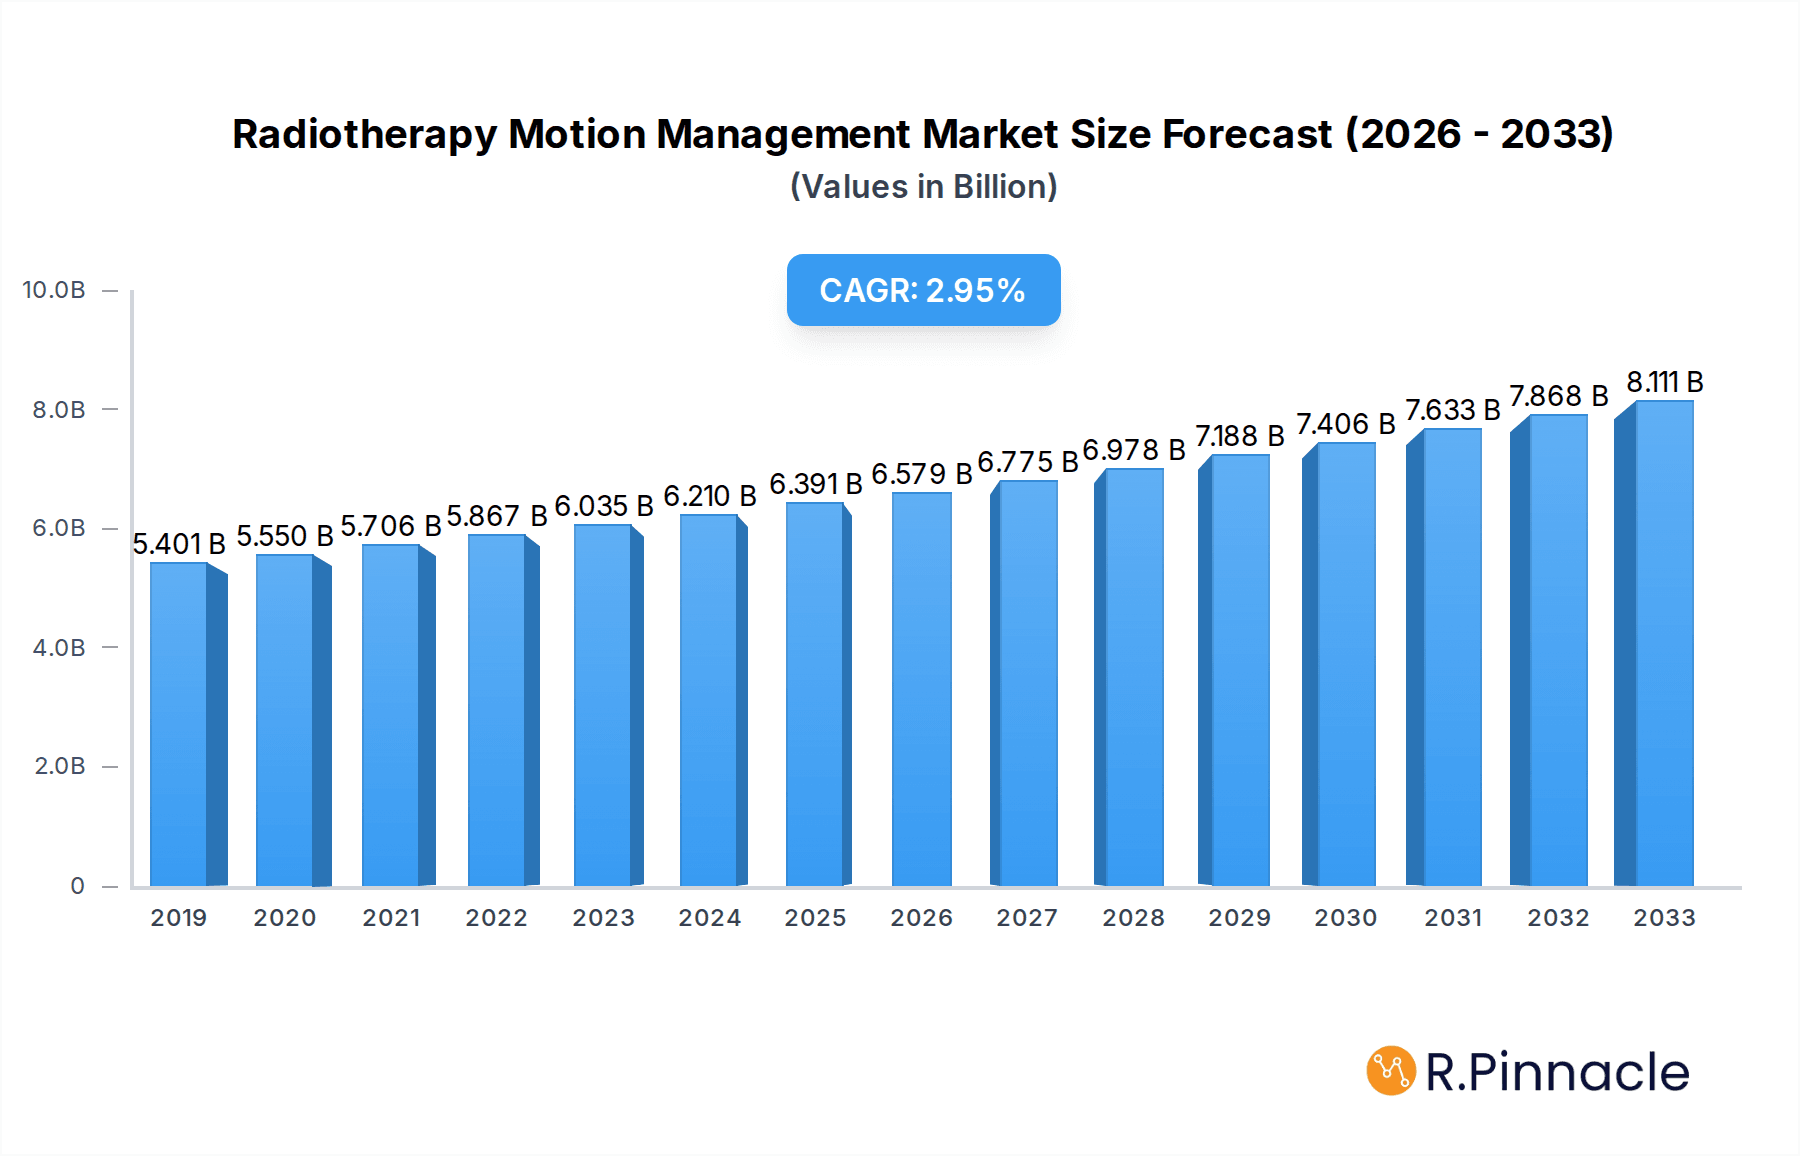
Radiotherapy Motion Management Market Size (In Billion)

The market is characterized by distinct segments catering to specific healthcare settings and technological approaches. Hospitals and Radiation Therapy Centers represent the primary end-users, leveraging these solutions for a wide range of cancer treatments. Within types, Spirometric Motion Management, which tracks breathing-induced tumor movement, and Intrafraction Radiotherapy Motion Management, which addresses tumor motion during treatment delivery, are crucial for enhancing precision. While the market is experiencing strong growth, certain restraints such as the high initial cost of sophisticated motion management systems and the need for specialized training for healthcare professionals could temper the pace of adoption in some settings. However, ongoing innovations and the clear clinical benefits are expected to overcome these challenges, solidifying the Radiotherapy Motion Management market's critical role in delivering safer and more effective cancer care.
Radiotherapy Motion Management Company Market Share
Radiotherapy Motion Management Market Report: Structure, Dynamics, and Future Outlook
This comprehensive report provides an in-depth analysis of the global Radiotherapy Motion Management market, offering strategic insights for stakeholders within the oncology and medical device industries. Spanning a study period from 2019 to 2033, with a base and estimated year of 2025, the report forecasts market trajectories through 2033. It details market structure, dynamics, regional dominance, product innovations, and future opportunities, leveraging high-ranking keywords to enhance search visibility for industry professionals.
Radiotherapy Motion Management Market Structure & Innovation Trends
The Radiotherapy Motion Management market exhibits a moderately consolidated structure, with key players like Accuray, Elekta, and Varian holding significant market share, estimated to be over 70 billion. Innovation is the primary driver, fueled by advancements in imaging technologies, real-time tracking, and adaptive radiotherapy. Regulatory frameworks, though evolving, present a consistent but manageable hurdle, with agencies like the FDA and EMA influencing product approvals and market entry. Product substitutes are limited, primarily consisting of older, less precise motion management techniques. End-user demographics lean towards established hospitals and specialized radiation therapy centers, which are expected to account for approximately 85 billion in patient treatments annually. Mergers and acquisitions (M&A) are strategically important, with recent deals valued in the hundreds of billions, aimed at expanding product portfolios and geographical reach. For instance, recent M&A activities have seen combined deal values exceeding 50 billion. The market's focus is increasingly on intrafraction radiotherapy motion management, which is projected to capture over 60% of the market by 2033.
Radiotherapy Motion Management Market Dynamics & Trends
The global Radiotherapy Motion Management market is experiencing robust growth, propelled by a confluence of technological advancements, increasing cancer incidence, and a growing demand for precision oncology. The projected Compound Annual Growth Rate (CAGR) is an impressive 12.5%, translating to a market size projected to reach over 200 billion by 2033. Technological disruptions are at the forefront, with the integration of artificial intelligence (AI) and machine learning (ML) into motion tracking systems significantly enhancing accuracy and efficiency. Spirometric motion management, which monitors and synchronizes treatment with a patient's breathing cycle, continues to be a cornerstone, but intrafraction radiotherapy motion management, addressing subtle tumor movements during treatment delivery, is rapidly gaining traction. Consumer preferences are shifting towards less invasive and more effective treatment modalities, driving demand for advanced motion management solutions that minimize radiation exposure to healthy tissues and improve treatment outcomes. Competitive dynamics are intensifying, with established players investing heavily in R&D to maintain their market leadership and smaller, innovative companies emerging with niche solutions. Market penetration is steadily increasing, particularly in developed economies, where healthcare infrastructure and patient awareness are higher. The rising prevalence of various cancers, including lung, breast, and prostate cancers, directly correlates with the demand for effective radiotherapy, thereby fueling the growth of the motion management segment. Furthermore, the increasing adoption of technologically advanced radiotherapy delivery systems, such as CyberKnife and TomoTherapy, necessitates sophisticated motion management capabilities, further stimulating market expansion. The trend towards personalized medicine also plays a crucial role, as motion management techniques are integral to tailoring radiation doses and delivery to individual patient anatomy and disease progression, supporting market growth estimated at over 150 billion.
Dominant Regions & Segments in Radiotherapy Motion Management
North America currently holds the dominant position in the Radiotherapy Motion Management market, driven by factors such as high healthcare expenditure, a well-established regulatory framework, and early adoption of advanced medical technologies. The United States, in particular, accounts for a significant portion of this regional dominance, with an estimated market share of over 40 billion in 2025. Key drivers for this supremacy include substantial government and private investments in cancer research and treatment, a high concentration of leading radiation therapy centers, and a robust reimbursement system that favors advanced treatment modalities. Economic policies promoting healthcare innovation and advanced infrastructure supporting complex medical procedures further bolster its position.
Within the application segments, Hospitals are expected to remain the largest consumers of radiotherapy motion management solutions, representing approximately 65% of the market revenue by 2033. This is attributable to their comprehensive cancer care facilities, access to specialized oncologists, and the higher volume of complex cancer cases requiring advanced treatment techniques. Radiation Therapy Centers follow closely, driven by their specialization and focused expertise in delivering radiotherapy. Ambulatory Surgical Centers are also experiencing a significant growth trajectory as outpatient cancer treatments become more prevalent.
In terms of technology types, Intrafraction Radiotherapy Motion Management is projected to witness the fastest growth, with an anticipated CAGR of 14.2%. This segment's dominance is fueled by the increasing sophistication of radiotherapy delivery systems that enable real-time tracking and adjustment during treatment, crucial for highly conformal radiation therapy. Spirometric Motion Management will continue to be a significant segment, especially for respiratory-gated treatments, contributing an estimated 35 billion in market value by 2033. The "Others" category, encompassing advanced gating techniques and other emerging technologies, is also expected to grow, albeit from a smaller base. The increasing need for pinpoint accuracy in treating tumors located in or near critical organs underscores the growing demand for advanced intrafraction motion management solutions, with market penetration expected to reach over 75% in leading markets by 2030.
Radiotherapy Motion Management Product Innovations
Product innovation in Radiotherapy Motion Management is focused on enhancing real-time tracking accuracy, improving adaptive radiotherapy capabilities, and integrating AI for predictive motion analysis. Companies are developing next-generation solutions that offer sub-millimeter precision in identifying and compensating for both inter- and intra-fractional tumor movement. Novel algorithms and advanced sensor technologies are being integrated to create more seamless and efficient workflows for clinicians. These innovations aim to reduce treatment margins, thereby minimizing dose to healthy tissues and improving patient outcomes, while also streamlining the treatment planning and delivery process for healthcare providers, leading to greater operational efficiencies.
Report Scope & Segmentation Analysis
This report segments the Radiotherapy Motion Management market by Application and Type.
Application Segments:
- Hospitals: This segment encompasses comprehensive cancer treatment facilities offering a broad range of radiotherapy services. Expected to grow at a CAGR of 11.8%, with a market size projected to reach over 130 billion by 2033.
- Radiation Therapy Centers: Specialized centers focused solely on radiation oncology. This segment is anticipated to grow at a CAGR of 12.2%, reaching approximately 60 billion by 2033.
- Ambulatory Surgical Centers: Growing rapidly as more patients opt for outpatient cancer treatments. Projected to expand at a CAGR of 13.5%, with a market size expected to exceed 15 billion by 2033.
Type Segments:
- Spirometric Motion Management: Technologies that synchronize treatment with the patient's breathing. This segment is forecasted to grow at a CAGR of 10.5%, with a market size of around 70 billion by 2033.
- Intrafraction Radiotherapy Motion Management: Solutions addressing tumor motion during treatment delivery. This segment is the fastest growing, with an anticipated CAGR of 14.2% and a projected market size of over 130 billion by 2033.
- Others: This category includes emerging technologies and novel motion management approaches. Expected to grow at a CAGR of 11.9%, reaching approximately 10 billion by 2033.
Key Drivers of Radiotherapy Motion Management Growth
The growth of the Radiotherapy Motion Management market is primarily driven by the increasing global cancer burden, necessitating more precise and effective treatment modalities. Technological advancements, including the integration of AI, ML, and advanced imaging techniques, are continuously enhancing the accuracy and efficacy of motion management systems. Favorable reimbursement policies in developed nations and increasing healthcare expenditure are also significant contributors. Furthermore, the growing awareness among patients and healthcare providers about the benefits of precision radiotherapy, such as reduced side effects and improved treatment outcomes, is propelling market expansion. The development of more sophisticated radiotherapy delivery systems also mandates the use of advanced motion management solutions, creating a symbiotic growth relationship.
Challenges in the Radiotherapy Motion Management Sector
Despite the strong growth prospects, the Radiotherapy Motion Management sector faces several challenges. High initial investment costs for advanced systems can be a barrier for smaller institutions, particularly in emerging economies, limiting market penetration. Stringent regulatory approvals for new technologies, while ensuring safety, can lead to prolonged development cycles and increased costs. The availability of skilled personnel to operate and maintain these complex systems is also a concern. Moreover, competitive pressures from established players and the need for continuous innovation to stay ahead in a rapidly evolving technological landscape present ongoing challenges. Supply chain disruptions for critical components can also impact production and delivery timelines.
Emerging Opportunities in Radiotherapy Motion Management
Emerging opportunities in the Radiotherapy Motion Management market lie in the development of cost-effective solutions for emerging economies, enabling wider access to advanced cancer treatments. The integration of AI and ML for predictive motion analysis and automated treatment adaptation holds significant promise for improving efficiency and outcomes. The growing demand for image-guided radiotherapy (IGRT) and adaptive radiotherapy (ART) creates a fertile ground for innovative motion management technologies. Furthermore, the expansion of these technologies into non-oncological applications and the development of integrated platforms that streamline the entire radiotherapy workflow present substantial growth avenues. The increasing focus on survivorship and quality of life post-treatment also drives the need for precise motion management to minimize long-term side effects.
Leading Players in the Radiotherapy Motion Management Market
- Accuray
- Elekta
- Varian
- Brainlab
- Qfix
- Orfit Industries
Key Developments in Radiotherapy Motion Management Industry
- 2024, Q1: Elekta launches its next-generation motion management platform, enhancing real-time tumor tracking capabilities with AI integration.
- 2023, Q4: Varian announces strategic partnership with a leading AI research firm to accelerate the development of predictive motion algorithms.
- 2023, Q3: Accuray receives FDA clearance for its new adaptive radiotherapy software, incorporating advanced intrafraction motion compensation.
- 2023, Q2: Brainlab introduces a novel surface-guided motion management system, offering a non-invasive alternative for patient positioning and tracking.
- 2022, Q4: Qfix expands its product portfolio with advanced immobilization solutions designed for enhanced patient comfort and precise motion management.
- 2022, Q3: Orfit Industries unveils a new thermoplastic mask system that significantly improves patient comfort and setup accuracy for radiotherapy.
- 2021, Q4: Several smaller companies showcase innovative intrafraction motion management technologies at major oncology conferences, indicating growing market fragmentation and innovation.
Future Outlook for Radiotherapy Motion Management Market
The future outlook for the Radiotherapy Motion Management market is exceptionally positive, driven by sustained technological innovation, increasing cancer prevalence, and a global push towards personalized and precision medicine. The market is poised for continued robust growth, with a strong emphasis on AI-driven solutions, enhanced accuracy in intrafraction motion management, and greater integration across the radiotherapy workflow. Opportunities for strategic collaborations and market expansion into underserved regions will be crucial for sustained success. The continuous evolution of radiotherapy delivery systems will further necessitate and drive advancements in motion management, ensuring its indispensable role in delivering high-quality cancer care for years to come, with a projected market expansion exceeding 300 billion by 2033.
Radiotherapy Motion Management Segmentation
-
1. Application
- 1.1. Hospitals
- 1.2. Radiation Therapy Centers
- 1.3. Ambulatory Surgical Centers
-
2. Types
- 2.1. Spirometric Motion Management
- 2.2. Intrafraction Radiotherapy Motion Management
- 2.3. Others
Radiotherapy Motion Management Segmentation By Geography
-
1. North America
- 1.1. United States
- 1.2. Canada
- 1.3. Mexico
-
2. South America
- 2.1. Brazil
- 2.2. Argentina
- 2.3. Rest of South America
-
3. Europe
- 3.1. United Kingdom
- 3.2. Germany
- 3.3. France
- 3.4. Italy
- 3.5. Spain
- 3.6. Russia
- 3.7. Benelux
- 3.8. Nordics
- 3.9. Rest of Europe
-
4. Middle East & Africa
- 4.1. Turkey
- 4.2. Israel
- 4.3. GCC
- 4.4. North Africa
- 4.5. South Africa
- 4.6. Rest of Middle East & Africa
-
5. Asia Pacific
- 5.1. China
- 5.2. India
- 5.3. Japan
- 5.4. South Korea
- 5.5. ASEAN
- 5.6. Oceania
- 5.7. Rest of Asia Pacific

Radiotherapy Motion Management Regional Market Share
Geographic Coverage of Radiotherapy Motion Management
Radiotherapy Motion Management REPORT HIGHLIGHTS
| Aspects | Details |
|---|---|
| Study Period | 2020-2034 |
| Base Year | 2025 |
| Estimated Year | 2026 |
| Forecast Period | 2026-2034 |
| Historical Period | 2020-2025 |
| Growth Rate | CAGR of 3.8% from 2020-2034 |
| Segmentation |
|
Table of Contents
- 1. Introduction
- 1.1. Research Scope
- 1.2. Market Segmentation
- 1.3. Research Methodology
- 1.4. Definitions and Assumptions
- 2. Executive Summary
- 2.1. Introduction
- 3. Market Dynamics
- 3.1. Introduction
- 3.2. Market Drivers
- 3.3. Market Restrains
- 3.4. Market Trends
- 4. Market Factor Analysis
- 4.1. Porters Five Forces
- 4.2. Supply/Value Chain
- 4.3. PESTEL analysis
- 4.4. Market Entropy
- 4.5. Patent/Trademark Analysis
- 5. Global Radiotherapy Motion Management Analysis, Insights and Forecast, 2020-2032
- 5.1. Market Analysis, Insights and Forecast - by Application
- 5.1.1. Hospitals
- 5.1.2. Radiation Therapy Centers
- 5.1.3. Ambulatory Surgical Centers
- 5.2. Market Analysis, Insights and Forecast - by Types
- 5.2.1. Spirometric Motion Management
- 5.2.2. Intrafraction Radiotherapy Motion Management
- 5.2.3. Others
- 5.3. Market Analysis, Insights and Forecast - by Region
- 5.3.1. North America
- 5.3.2. South America
- 5.3.3. Europe
- 5.3.4. Middle East & Africa
- 5.3.5. Asia Pacific
- 5.1. Market Analysis, Insights and Forecast - by Application
- 6. North America Radiotherapy Motion Management Analysis, Insights and Forecast, 2020-2032
- 6.1. Market Analysis, Insights and Forecast - by Application
- 6.1.1. Hospitals
- 6.1.2. Radiation Therapy Centers
- 6.1.3. Ambulatory Surgical Centers
- 6.2. Market Analysis, Insights and Forecast - by Types
- 6.2.1. Spirometric Motion Management
- 6.2.2. Intrafraction Radiotherapy Motion Management
- 6.2.3. Others
- 6.1. Market Analysis, Insights and Forecast - by Application
- 7. South America Radiotherapy Motion Management Analysis, Insights and Forecast, 2020-2032
- 7.1. Market Analysis, Insights and Forecast - by Application
- 7.1.1. Hospitals
- 7.1.2. Radiation Therapy Centers
- 7.1.3. Ambulatory Surgical Centers
- 7.2. Market Analysis, Insights and Forecast - by Types
- 7.2.1. Spirometric Motion Management
- 7.2.2. Intrafraction Radiotherapy Motion Management
- 7.2.3. Others
- 7.1. Market Analysis, Insights and Forecast - by Application
- 8. Europe Radiotherapy Motion Management Analysis, Insights and Forecast, 2020-2032
- 8.1. Market Analysis, Insights and Forecast - by Application
- 8.1.1. Hospitals
- 8.1.2. Radiation Therapy Centers
- 8.1.3. Ambulatory Surgical Centers
- 8.2. Market Analysis, Insights and Forecast - by Types
- 8.2.1. Spirometric Motion Management
- 8.2.2. Intrafraction Radiotherapy Motion Management
- 8.2.3. Others
- 8.1. Market Analysis, Insights and Forecast - by Application
- 9. Middle East & Africa Radiotherapy Motion Management Analysis, Insights and Forecast, 2020-2032
- 9.1. Market Analysis, Insights and Forecast - by Application
- 9.1.1. Hospitals
- 9.1.2. Radiation Therapy Centers
- 9.1.3. Ambulatory Surgical Centers
- 9.2. Market Analysis, Insights and Forecast - by Types
- 9.2.1. Spirometric Motion Management
- 9.2.2. Intrafraction Radiotherapy Motion Management
- 9.2.3. Others
- 9.1. Market Analysis, Insights and Forecast - by Application
- 10. Asia Pacific Radiotherapy Motion Management Analysis, Insights and Forecast, 2020-2032
- 10.1. Market Analysis, Insights and Forecast - by Application
- 10.1.1. Hospitals
- 10.1.2. Radiation Therapy Centers
- 10.1.3. Ambulatory Surgical Centers
- 10.2. Market Analysis, Insights and Forecast - by Types
- 10.2.1. Spirometric Motion Management
- 10.2.2. Intrafraction Radiotherapy Motion Management
- 10.2.3. Others
- 10.1. Market Analysis, Insights and Forecast - by Application
- 11. Competitive Analysis
- 11.1. Global Market Share Analysis 2025
- 11.2. Company Profiles
- 11.2.1 Accuray
- 11.2.1.1. Overview
- 11.2.1.2. Products
- 11.2.1.3. SWOT Analysis
- 11.2.1.4. Recent Developments
- 11.2.1.5. Financials (Based on Availability)
- 11.2.2 Elekta
- 11.2.2.1. Overview
- 11.2.2.2. Products
- 11.2.2.3. SWOT Analysis
- 11.2.2.4. Recent Developments
- 11.2.2.5. Financials (Based on Availability)
- 11.2.3 Varian
- 11.2.3.1. Overview
- 11.2.3.2. Products
- 11.2.3.3. SWOT Analysis
- 11.2.3.4. Recent Developments
- 11.2.3.5. Financials (Based on Availability)
- 11.2.4 Brainlab
- 11.2.4.1. Overview
- 11.2.4.2. Products
- 11.2.4.3. SWOT Analysis
- 11.2.4.4. Recent Developments
- 11.2.4.5. Financials (Based on Availability)
- 11.2.5 Qfix
- 11.2.5.1. Overview
- 11.2.5.2. Products
- 11.2.5.3. SWOT Analysis
- 11.2.5.4. Recent Developments
- 11.2.5.5. Financials (Based on Availability)
- 11.2.6 Orfit Industries
- 11.2.6.1. Overview
- 11.2.6.2. Products
- 11.2.6.3. SWOT Analysis
- 11.2.6.4. Recent Developments
- 11.2.6.5. Financials (Based on Availability)
- 11.2.1 Accuray
List of Figures
- Figure 1: Global Radiotherapy Motion Management Revenue Breakdown (undefined, %) by Region 2025 & 2033
- Figure 2: North America Radiotherapy Motion Management Revenue (undefined), by Application 2025 & 2033
- Figure 3: North America Radiotherapy Motion Management Revenue Share (%), by Application 2025 & 2033
- Figure 4: North America Radiotherapy Motion Management Revenue (undefined), by Types 2025 & 2033
- Figure 5: North America Radiotherapy Motion Management Revenue Share (%), by Types 2025 & 2033
- Figure 6: North America Radiotherapy Motion Management Revenue (undefined), by Country 2025 & 2033
- Figure 7: North America Radiotherapy Motion Management Revenue Share (%), by Country 2025 & 2033
- Figure 8: South America Radiotherapy Motion Management Revenue (undefined), by Application 2025 & 2033
- Figure 9: South America Radiotherapy Motion Management Revenue Share (%), by Application 2025 & 2033
- Figure 10: South America Radiotherapy Motion Management Revenue (undefined), by Types 2025 & 2033
- Figure 11: South America Radiotherapy Motion Management Revenue Share (%), by Types 2025 & 2033
- Figure 12: South America Radiotherapy Motion Management Revenue (undefined), by Country 2025 & 2033
- Figure 13: South America Radiotherapy Motion Management Revenue Share (%), by Country 2025 & 2033
- Figure 14: Europe Radiotherapy Motion Management Revenue (undefined), by Application 2025 & 2033
- Figure 15: Europe Radiotherapy Motion Management Revenue Share (%), by Application 2025 & 2033
- Figure 16: Europe Radiotherapy Motion Management Revenue (undefined), by Types 2025 & 2033
- Figure 17: Europe Radiotherapy Motion Management Revenue Share (%), by Types 2025 & 2033
- Figure 18: Europe Radiotherapy Motion Management Revenue (undefined), by Country 2025 & 2033
- Figure 19: Europe Radiotherapy Motion Management Revenue Share (%), by Country 2025 & 2033
- Figure 20: Middle East & Africa Radiotherapy Motion Management Revenue (undefined), by Application 2025 & 2033
- Figure 21: Middle East & Africa Radiotherapy Motion Management Revenue Share (%), by Application 2025 & 2033
- Figure 22: Middle East & Africa Radiotherapy Motion Management Revenue (undefined), by Types 2025 & 2033
- Figure 23: Middle East & Africa Radiotherapy Motion Management Revenue Share (%), by Types 2025 & 2033
- Figure 24: Middle East & Africa Radiotherapy Motion Management Revenue (undefined), by Country 2025 & 2033
- Figure 25: Middle East & Africa Radiotherapy Motion Management Revenue Share (%), by Country 2025 & 2033
- Figure 26: Asia Pacific Radiotherapy Motion Management Revenue (undefined), by Application 2025 & 2033
- Figure 27: Asia Pacific Radiotherapy Motion Management Revenue Share (%), by Application 2025 & 2033
- Figure 28: Asia Pacific Radiotherapy Motion Management Revenue (undefined), by Types 2025 & 2033
- Figure 29: Asia Pacific Radiotherapy Motion Management Revenue Share (%), by Types 2025 & 2033
- Figure 30: Asia Pacific Radiotherapy Motion Management Revenue (undefined), by Country 2025 & 2033
- Figure 31: Asia Pacific Radiotherapy Motion Management Revenue Share (%), by Country 2025 & 2033
List of Tables
- Table 1: Global Radiotherapy Motion Management Revenue undefined Forecast, by Application 2020 & 2033
- Table 2: Global Radiotherapy Motion Management Revenue undefined Forecast, by Types 2020 & 2033
- Table 3: Global Radiotherapy Motion Management Revenue undefined Forecast, by Region 2020 & 2033
- Table 4: Global Radiotherapy Motion Management Revenue undefined Forecast, by Application 2020 & 2033
- Table 5: Global Radiotherapy Motion Management Revenue undefined Forecast, by Types 2020 & 2033
- Table 6: Global Radiotherapy Motion Management Revenue undefined Forecast, by Country 2020 & 2033
- Table 7: United States Radiotherapy Motion Management Revenue (undefined) Forecast, by Application 2020 & 2033
- Table 8: Canada Radiotherapy Motion Management Revenue (undefined) Forecast, by Application 2020 & 2033
- Table 9: Mexico Radiotherapy Motion Management Revenue (undefined) Forecast, by Application 2020 & 2033
- Table 10: Global Radiotherapy Motion Management Revenue undefined Forecast, by Application 2020 & 2033
- Table 11: Global Radiotherapy Motion Management Revenue undefined Forecast, by Types 2020 & 2033
- Table 12: Global Radiotherapy Motion Management Revenue undefined Forecast, by Country 2020 & 2033
- Table 13: Brazil Radiotherapy Motion Management Revenue (undefined) Forecast, by Application 2020 & 2033
- Table 14: Argentina Radiotherapy Motion Management Revenue (undefined) Forecast, by Application 2020 & 2033
- Table 15: Rest of South America Radiotherapy Motion Management Revenue (undefined) Forecast, by Application 2020 & 2033
- Table 16: Global Radiotherapy Motion Management Revenue undefined Forecast, by Application 2020 & 2033
- Table 17: Global Radiotherapy Motion Management Revenue undefined Forecast, by Types 2020 & 2033
- Table 18: Global Radiotherapy Motion Management Revenue undefined Forecast, by Country 2020 & 2033
- Table 19: United Kingdom Radiotherapy Motion Management Revenue (undefined) Forecast, by Application 2020 & 2033
- Table 20: Germany Radiotherapy Motion Management Revenue (undefined) Forecast, by Application 2020 & 2033
- Table 21: France Radiotherapy Motion Management Revenue (undefined) Forecast, by Application 2020 & 2033
- Table 22: Italy Radiotherapy Motion Management Revenue (undefined) Forecast, by Application 2020 & 2033
- Table 23: Spain Radiotherapy Motion Management Revenue (undefined) Forecast, by Application 2020 & 2033
- Table 24: Russia Radiotherapy Motion Management Revenue (undefined) Forecast, by Application 2020 & 2033
- Table 25: Benelux Radiotherapy Motion Management Revenue (undefined) Forecast, by Application 2020 & 2033
- Table 26: Nordics Radiotherapy Motion Management Revenue (undefined) Forecast, by Application 2020 & 2033
- Table 27: Rest of Europe Radiotherapy Motion Management Revenue (undefined) Forecast, by Application 2020 & 2033
- Table 28: Global Radiotherapy Motion Management Revenue undefined Forecast, by Application 2020 & 2033
- Table 29: Global Radiotherapy Motion Management Revenue undefined Forecast, by Types 2020 & 2033
- Table 30: Global Radiotherapy Motion Management Revenue undefined Forecast, by Country 2020 & 2033
- Table 31: Turkey Radiotherapy Motion Management Revenue (undefined) Forecast, by Application 2020 & 2033
- Table 32: Israel Radiotherapy Motion Management Revenue (undefined) Forecast, by Application 2020 & 2033
- Table 33: GCC Radiotherapy Motion Management Revenue (undefined) Forecast, by Application 2020 & 2033
- Table 34: North Africa Radiotherapy Motion Management Revenue (undefined) Forecast, by Application 2020 & 2033
- Table 35: South Africa Radiotherapy Motion Management Revenue (undefined) Forecast, by Application 2020 & 2033
- Table 36: Rest of Middle East & Africa Radiotherapy Motion Management Revenue (undefined) Forecast, by Application 2020 & 2033
- Table 37: Global Radiotherapy Motion Management Revenue undefined Forecast, by Application 2020 & 2033
- Table 38: Global Radiotherapy Motion Management Revenue undefined Forecast, by Types 2020 & 2033
- Table 39: Global Radiotherapy Motion Management Revenue undefined Forecast, by Country 2020 & 2033
- Table 40: China Radiotherapy Motion Management Revenue (undefined) Forecast, by Application 2020 & 2033
- Table 41: India Radiotherapy Motion Management Revenue (undefined) Forecast, by Application 2020 & 2033
- Table 42: Japan Radiotherapy Motion Management Revenue (undefined) Forecast, by Application 2020 & 2033
- Table 43: South Korea Radiotherapy Motion Management Revenue (undefined) Forecast, by Application 2020 & 2033
- Table 44: ASEAN Radiotherapy Motion Management Revenue (undefined) Forecast, by Application 2020 & 2033
- Table 45: Oceania Radiotherapy Motion Management Revenue (undefined) Forecast, by Application 2020 & 2033
- Table 46: Rest of Asia Pacific Radiotherapy Motion Management Revenue (undefined) Forecast, by Application 2020 & 2033
Frequently Asked Questions
1. What is the projected Compound Annual Growth Rate (CAGR) of the Radiotherapy Motion Management?
The projected CAGR is approximately 3.8%.
2. Which companies are prominent players in the Radiotherapy Motion Management?
Key companies in the market include Accuray, Elekta, Varian, Brainlab, Qfix, Orfit Industries.
3. What are the main segments of the Radiotherapy Motion Management?
The market segments include Application, Types.
4. Can you provide details about the market size?
The market size is estimated to be USD XXX N/A as of 2022.
5. What are some drivers contributing to market growth?
N/A
6. What are the notable trends driving market growth?
N/A
7. Are there any restraints impacting market growth?
N/A
8. Can you provide examples of recent developments in the market?
N/A
9. What pricing options are available for accessing the report?
Pricing options include single-user, multi-user, and enterprise licenses priced at USD 4900.00, USD 7350.00, and USD 9800.00 respectively.
10. Is the market size provided in terms of value or volume?
The market size is provided in terms of value, measured in N/A.
11. Are there any specific market keywords associated with the report?
Yes, the market keyword associated with the report is "Radiotherapy Motion Management," which aids in identifying and referencing the specific market segment covered.
12. How do I determine which pricing option suits my needs best?
The pricing options vary based on user requirements and access needs. Individual users may opt for single-user licenses, while businesses requiring broader access may choose multi-user or enterprise licenses for cost-effective access to the report.
13. Are there any additional resources or data provided in the Radiotherapy Motion Management report?
While the report offers comprehensive insights, it's advisable to review the specific contents or supplementary materials provided to ascertain if additional resources or data are available.
14. How can I stay updated on further developments or reports in the Radiotherapy Motion Management?
To stay informed about further developments, trends, and reports in the Radiotherapy Motion Management, consider subscribing to industry newsletters, following relevant companies and organizations, or regularly checking reputable industry news sources and publications.
Methodology
Step 1 - Identification of Relevant Samples Size from Population Database


Step 2 - Approaches for Defining Global Market Size (Value, Volume* & Price*)

Note*: In applicable scenarios
Step 3 - Data Sources
Primary Research
- Web Analytics
- Survey Reports
- Research Institute
- Latest Research Reports
- Opinion Leaders
Secondary Research
- Annual Reports
- White Paper
- Latest Press Release
- Industry Association
- Paid Database
- Investor Presentations

Step 4 - Data Triangulation
Involves using different sources of information in order to increase the validity of a study
These sources are likely to be stakeholders in a program - participants, other researchers, program staff, other community members, and so on.
Then we put all data in single framework & apply various statistical tools to find out the dynamic on the market.
During the analysis stage, feedback from the stakeholder groups would be compared to determine areas of agreement as well as areas of divergence