
Key Insights
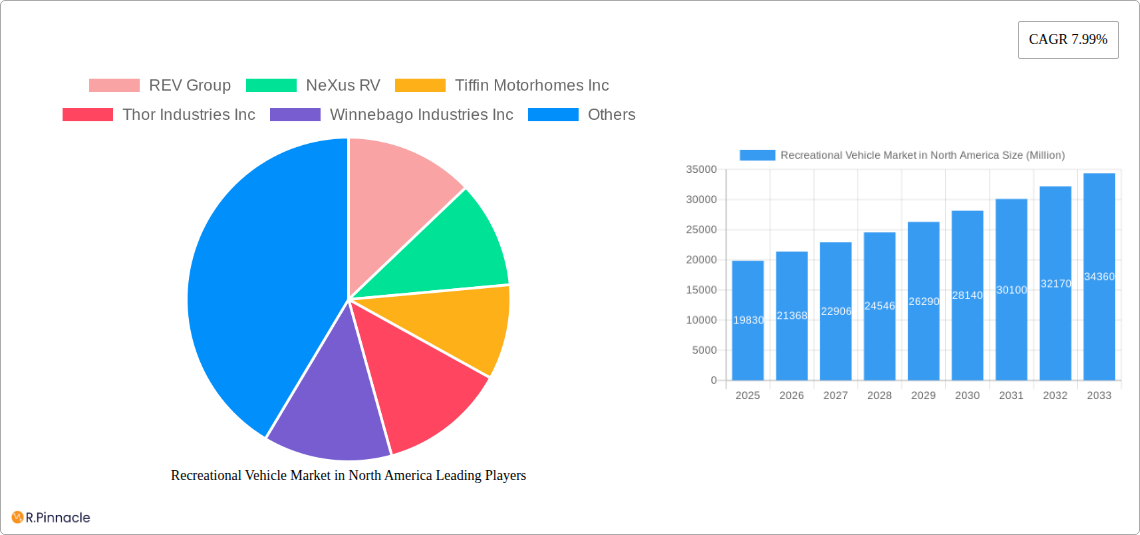
The North American recreational vehicle (RV) market, valued at $19.83 billion in 2025, is projected to experience robust growth, driven by several key factors. The increasing popularity of outdoor recreation and adventure tourism, coupled with a rising disposable income among millennials and Gen X, fuels demand for RVs. Further bolstering this trend is the growing preference for experiential travel, with RVs offering a unique blend of freedom, flexibility, and cost-effectiveness compared to traditional accommodations. The market is segmented by RV type (towable RVs, truck campers, motorhomes), application (private, commercial), and geography (United States, Canada, and the rest of North America). The United States constitutes the largest segment, driven by a mature RV culture and extensive RV parks and campgrounds. Canada exhibits significant growth potential due to its scenic landscapes and increasing tourism. While the market faces some headwinds, including supply chain disruptions and rising raw material costs, the long-term outlook remains positive, with a Compound Annual Growth Rate (CAGR) of 7.99% projected through 2033. Leading manufacturers like Thor Industries Inc., Winnebago Industries Inc., and REV Group are strategically investing in innovation and product diversification to cater to evolving consumer preferences and maintain their market share. The integration of advanced technologies, such as smart home features and improved fuel efficiency, is also a prominent trend shaping the future of the RV industry.
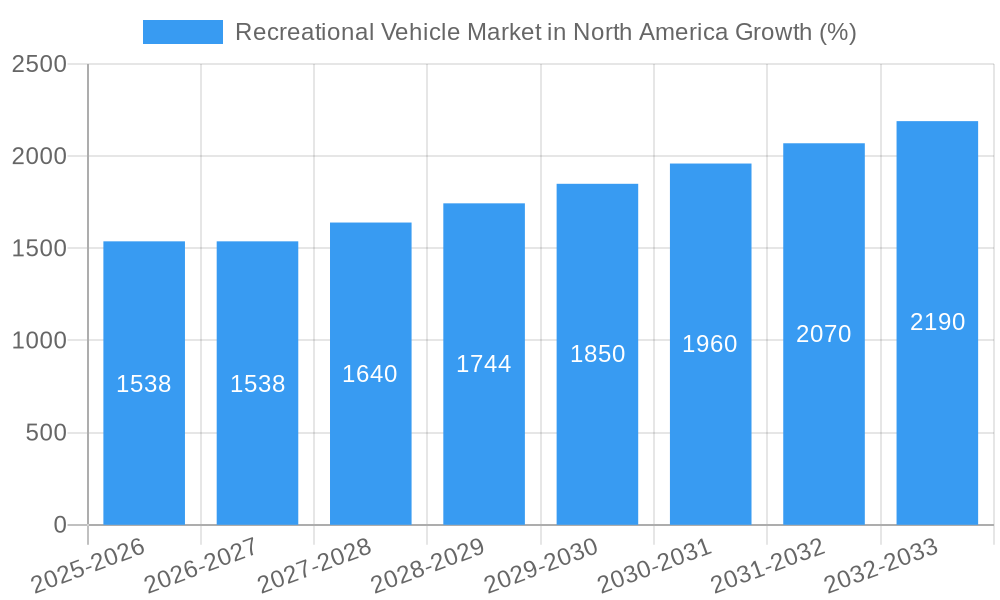
The forecast period of 2025-2033 shows substantial growth, primarily fueled by the continued appeal of RV travel and the expectation of a sustained economic environment supporting discretionary spending. The segmentation by type indicates that motorhomes, offering greater comfort and amenities, are likely to witness higher growth compared to towable RVs, although the latter continues to be a significant part of the market. The commercial application segment, encompassing RV rentals and tour operators, is also expected to experience steady growth, reflecting the rising popularity of RV-based tourism experiences. Given the projected CAGR and the substantial market size, the North American RV market presents attractive opportunities for both established players and new entrants, emphasizing the need for strategic investments in research and development and targeted marketing strategies to cater to diverse consumer segments.
North American Recreational Vehicle (RV) Market Report: 2019-2033
This comprehensive report provides a detailed analysis of the North American recreational vehicle market, offering valuable insights for industry professionals, investors, and stakeholders. The study covers the period 2019-2033, with a focus on market dynamics, key players, emerging trends, and future growth potential. The report leverages extensive data and analysis to provide a clear picture of this dynamic sector. Market values are presented in Millions.
Recreational Vehicle Market in North America Market Structure & Innovation Trends
The North American RV market is moderately consolidated, with a few major players holding significant market share. Thor Industries Inc., Winnebago Industries Inc., and REV Group dominate the landscape, together accounting for approximately xx% of the total market revenue in 2024. However, smaller manufacturers and niche players continue to emerge, driving innovation and competition. The market is characterized by a constant stream of product innovation, fueled by evolving consumer preferences and technological advancements. Regulatory frameworks, particularly concerning emissions and safety standards, significantly influence product development and market access. Substitutes for RVs, such as vacation rentals and camping, exert some competitive pressure, but the unique experience offered by RV travel continues to drive demand. End-user demographics are shifting, with a growing interest among younger generations and those seeking outdoor adventure and flexible travel options. The market has witnessed a moderate level of mergers and acquisitions (M&A) activity in recent years, with deal values ranging from xx Million to xx Million, primarily focused on expanding product lines and geographical reach.
- Market Concentration: High (xx% market share held by top 3 players in 2024)
- Innovation Drivers: Consumer demand for enhanced features, technological advancements (e.g., electrification), sustainability initiatives.
- Regulatory Frameworks: Emissions standards, safety regulations.
- M&A Activity: Moderate, with deal values ranging from xx Million to xx Million.
Recreational Vehicle Market in North America Market Dynamics & Trends
The North American RV market has experienced significant growth in recent years, driven by several key factors. The rising disposable incomes and increased leisure time among consumers contribute significantly to market expansion. Technological advancements, such as the introduction of electric RVs and improved connectivity features, are further shaping consumer preferences and driving market growth. The COVID-19 pandemic also acted as a catalyst, with many consumers opting for alternative travel options and outdoor recreation. The market is also seeing growing demand for luxury RVs and customized options, leading to premiumization of the product segment. However, increasing raw material costs and supply chain disruptions pose challenges. The competitive landscape is dynamic, with both established players and newcomers vying for market share. The market is projected to register a CAGR of xx% from 2025 to 2033.
Dominant Regions & Segments in Recreational Vehicle Market in North America
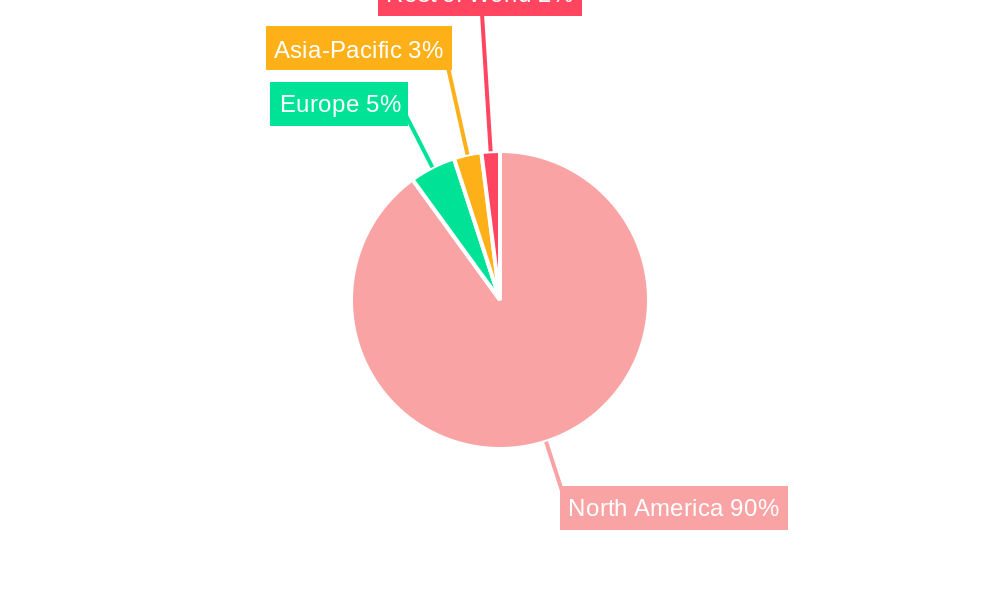
The United States remains the dominant market for RVs in North America, accounting for the largest share of total revenue. This dominance is attributed to factors such as a large population base, extensive RV parks and campgrounds, and a strong culture of recreational travel.
- United States:
- Large population base
- Extensive RV infrastructure (campgrounds, parks)
- Strong recreational travel culture
- Favorable economic conditions
- Canada:
- Growing middle class
- Increasing interest in outdoor activities
- Government support for tourism
- Rest of North America:
- Relatively smaller market size
- Growing potential with increasing tourism
Within the product segments, towable RVs constitute the largest market share, driven by their affordability and versatility. Motorhomes are gaining popularity due to their convenience and comfort, while truck campers cater to a niche market seeking compact and off-road capable solutions. The private application segment accounts for a significant majority of the total sales volume, whereas the commercial sector's demand for RVs is limited.
- Key Drivers for US Dominance: Strong consumer spending, extensive infrastructure, established RV culture.
Recreational Vehicle Market in North America Product Innovations
Recent years have witnessed significant product innovations in the RV sector. The introduction of electric RVs, such as Winnebago's eRV2, signifies a move towards sustainable and eco-friendly options. Advancements in materials and technology are also driving improvements in features such as energy efficiency, connectivity, and comfort. These new models are increasingly appealing to environmentally conscious consumers and offer significant competitive advantages. The introduction of fuel cell technology by First Hydrogen further enhances the potential for longer-range zero-emission options, addressing a key limitation of battery electric models.
Report Scope & Segmentation Analysis
This report segments the North American RV market by country (United States, Canada, Rest of North America), RV type (Towable RVs, Truck Campers, Motorhomes), and application (Private, Commercial). Each segment offers unique growth dynamics and competitive landscapes. The market size for each segment is projected to grow at varying rates during the forecast period (2025-2033), influenced by factors such as economic conditions, technological advancements, and consumer preferences.
Key Drivers of Recreational Vehicle Market in North America Growth
Several factors fuel the growth of the North American RV market. Rising disposable incomes allow more people to afford RVs. The expanding middle class and a growing interest in outdoor activities contribute to the market's expansion. Government initiatives supporting tourism and recreation further enhance market growth. Technological improvements like better fuel efficiency and advanced features also attract more buyers.
Challenges in the Recreational Vehicle Market in North America Sector
The RV market faces challenges like fluctuating raw material prices impacting manufacturing costs. Supply chain disruptions and labor shortages also affect production and delivery timelines. Intense competition among manufacturers necessitates constant innovation to stay competitive. Environmental regulations impacting emissions standards require ongoing investment in new technologies.
Emerging Opportunities in Recreational Vehicle Market in North America
Several opportunities exist in the RV market. Growing interest in sustainable and eco-friendly travel options creates demand for electric and fuel cell RVs. The rise of outdoor adventure tourism leads to increased demand for specialized RVs. Opportunities exist in developing customized RV solutions to cater to specific consumer needs.
Leading Players in the Recreational Vehicle Market in North America Market
- REV Group
- NeXus RV
- Tiffin Motorhomes Inc
- Thor Industries Inc
- Winnebago Industries Inc
- Entegra Coach Inc
- Cruiser R
- Triple E Recreational Vehicles
- Forest River Inc
Key Developments in Recreational Vehicle Market in North America Industry
- January 2023: Winnebago Industries launched the eRV2, a fully electric RV showcasing sustainable materials and extended off-grid capabilities. This signifies a major step towards environmentally friendly RV options and appeals to a growing segment of eco-conscious consumers.
- April 2023: First Hydrogen, in collaboration with EDAG Group, introduced a fuel cell-powered RV, emphasizing extended range and faster refueling compared to battery electric vehicles. This development signals a significant advancement in zero-emission RV technology and opens new opportunities for longer-distance travel.
Future Outlook for Recreational Vehicle Market in North America Market
The North American RV market is poised for continued growth, driven by sustained consumer demand, technological innovations, and a shift towards sustainable travel options. The introduction of electric and fuel cell RVs will redefine the industry landscape, offering new opportunities for manufacturers and driving market expansion. The focus on enhanced comfort, connectivity, and customization will further cater to evolving consumer preferences, contributing to the market's sustained growth trajectory.
Recreational Vehicle Market in North America Segmentation
-
1. Type
-
1.1. Towable RVs
- 1.1.1. Travel Trailers
- 1.1.2. Fifth Wheel Trailers
- 1.1.3. Folding Camp Trailers
- 1.1.4. Truck Campers
-
1.2. Motorhomes
- 1.2.1. Type A
- 1.2.2. Type B
- 1.2.3. Type C
-
1.1. Towable RVs
-
2. Application
- 2.1. Private
- 2.2. Commercial
Recreational Vehicle Market in North America Segmentation By Geography
-
1. North America
- 1.1. United States
- 1.2. Canada
- 1.3. Mexico
-
2. South America
- 2.1. Brazil
- 2.2. Argentina
- 2.3. Rest of South America
-
3. Europe
- 3.1. United Kingdom
- 3.2. Germany
- 3.3. France
- 3.4. Italy
- 3.5. Spain
- 3.6. Russia
- 3.7. Benelux
- 3.8. Nordics
- 3.9. Rest of Europe
-
4. Middle East & Africa
- 4.1. Turkey
- 4.2. Israel
- 4.3. GCC
- 4.4. North Africa
- 4.5. South Africa
- 4.6. Rest of Middle East & Africa
-
5. Asia Pacific
- 5.1. China
- 5.2. India
- 5.3. Japan
- 5.4. South Korea
- 5.5. ASEAN
- 5.6. Oceania
- 5.7. Rest of Asia Pacific
Recreational Vehicle Market in North America REPORT HIGHLIGHTS
| Aspects | Details |
|---|---|
| Study Period | 2019-2033 |
| Base Year | 2024 |
| Estimated Year | 2025 |
| Forecast Period | 2025-2033 |
| Historical Period | 2019-2024 |
| Growth Rate | CAGR of 7.99% from 2019-2033 |
| Segmentation |
|
Table of Contents
- 1. Introduction
- 1.1. Research Scope
- 1.2. Market Segmentation
- 1.3. Research Methodology
- 1.4. Definitions and Assumptions
- 2. Executive Summary
- 2.1. Introduction
- 3. Market Dynamics
- 3.1. Introduction
- 3.2. Market Drivers
- 3.2.1. Increased Travel and Tourism to Fuel Market Demand
- 3.3. Market Restrains
- 3.3.1. Recreational Vehicle Rental to Affect The Market Over the Long Term
- 3.4. Market Trends
- 3.4.1. Motorized RVs are the Largest Segment by Type
- 4. Market Factor Analysis
- 4.1. Porters Five Forces
- 4.2. Supply/Value Chain
- 4.3. PESTEL analysis
- 4.4. Market Entropy
- 4.5. Patent/Trademark Analysis
- 5. Global Recreational Vehicle Market in North America Analysis, Insights and Forecast, 2019-2031
- 5.1. Market Analysis, Insights and Forecast - by Type
- 5.1.1. Towable RVs
- 5.1.1.1. Travel Trailers
- 5.1.1.2. Fifth Wheel Trailers
- 5.1.1.3. Folding Camp Trailers
- 5.1.1.4. Truck Campers
- 5.1.2. Motorhomes
- 5.1.2.1. Type A
- 5.1.2.2. Type B
- 5.1.2.3. Type C
- 5.1.1. Towable RVs
- 5.2. Market Analysis, Insights and Forecast - by Application
- 5.2.1. Private
- 5.2.2. Commercial
- 5.3. Market Analysis, Insights and Forecast - by Region
- 5.3.1. North America
- 5.3.2. South America
- 5.3.3. Europe
- 5.3.4. Middle East & Africa
- 5.3.5. Asia Pacific
- 5.1. Market Analysis, Insights and Forecast - by Type
- 6. North America Recreational Vehicle Market in North America Analysis, Insights and Forecast, 2019-2031
- 6.1. Market Analysis, Insights and Forecast - by Type
- 6.1.1. Towable RVs
- 6.1.1.1. Travel Trailers
- 6.1.1.2. Fifth Wheel Trailers
- 6.1.1.3. Folding Camp Trailers
- 6.1.1.4. Truck Campers
- 6.1.2. Motorhomes
- 6.1.2.1. Type A
- 6.1.2.2. Type B
- 6.1.2.3. Type C
- 6.1.1. Towable RVs
- 6.2. Market Analysis, Insights and Forecast - by Application
- 6.2.1. Private
- 6.2.2. Commercial
- 6.1. Market Analysis, Insights and Forecast - by Type
- 7. South America Recreational Vehicle Market in North America Analysis, Insights and Forecast, 2019-2031
- 7.1. Market Analysis, Insights and Forecast - by Type
- 7.1.1. Towable RVs
- 7.1.1.1. Travel Trailers
- 7.1.1.2. Fifth Wheel Trailers
- 7.1.1.3. Folding Camp Trailers
- 7.1.1.4. Truck Campers
- 7.1.2. Motorhomes
- 7.1.2.1. Type A
- 7.1.2.2. Type B
- 7.1.2.3. Type C
- 7.1.1. Towable RVs
- 7.2. Market Analysis, Insights and Forecast - by Application
- 7.2.1. Private
- 7.2.2. Commercial
- 7.1. Market Analysis, Insights and Forecast - by Type
- 8. Europe Recreational Vehicle Market in North America Analysis, Insights and Forecast, 2019-2031
- 8.1. Market Analysis, Insights and Forecast - by Type
- 8.1.1. Towable RVs
- 8.1.1.1. Travel Trailers
- 8.1.1.2. Fifth Wheel Trailers
- 8.1.1.3. Folding Camp Trailers
- 8.1.1.4. Truck Campers
- 8.1.2. Motorhomes
- 8.1.2.1. Type A
- 8.1.2.2. Type B
- 8.1.2.3. Type C
- 8.1.1. Towable RVs
- 8.2. Market Analysis, Insights and Forecast - by Application
- 8.2.1. Private
- 8.2.2. Commercial
- 8.1. Market Analysis, Insights and Forecast - by Type
- 9. Middle East & Africa Recreational Vehicle Market in North America Analysis, Insights and Forecast, 2019-2031
- 9.1. Market Analysis, Insights and Forecast - by Type
- 9.1.1. Towable RVs
- 9.1.1.1. Travel Trailers
- 9.1.1.2. Fifth Wheel Trailers
- 9.1.1.3. Folding Camp Trailers
- 9.1.1.4. Truck Campers
- 9.1.2. Motorhomes
- 9.1.2.1. Type A
- 9.1.2.2. Type B
- 9.1.2.3. Type C
- 9.1.1. Towable RVs
- 9.2. Market Analysis, Insights and Forecast - by Application
- 9.2.1. Private
- 9.2.2. Commercial
- 9.1. Market Analysis, Insights and Forecast - by Type
- 10. Asia Pacific Recreational Vehicle Market in North America Analysis, Insights and Forecast, 2019-2031
- 10.1. Market Analysis, Insights and Forecast - by Type
- 10.1.1. Towable RVs
- 10.1.1.1. Travel Trailers
- 10.1.1.2. Fifth Wheel Trailers
- 10.1.1.3. Folding Camp Trailers
- 10.1.1.4. Truck Campers
- 10.1.2. Motorhomes
- 10.1.2.1. Type A
- 10.1.2.2. Type B
- 10.1.2.3. Type C
- 10.1.1. Towable RVs
- 10.2. Market Analysis, Insights and Forecast - by Application
- 10.2.1. Private
- 10.2.2. Commercial
- 10.1. Market Analysis, Insights and Forecast - by Type
- 11. United States Recreational Vehicle Market in North America Analysis, Insights and Forecast, 2019-2031
- 12. Canada Recreational Vehicle Market in North America Analysis, Insights and Forecast, 2019-2031
- 13. Mexico Recreational Vehicle Market in North America Analysis, Insights and Forecast, 2019-2031
- 14. Rest of North America Recreational Vehicle Market in North America Analysis, Insights and Forecast, 2019-2031
- 15. Competitive Analysis
- 15.1. Global Market Share Analysis 2024
- 15.2. Company Profiles
- 15.2.1 REV Group
- 15.2.1.1. Overview
- 15.2.1.2. Products
- 15.2.1.3. SWOT Analysis
- 15.2.1.4. Recent Developments
- 15.2.1.5. Financials (Based on Availability)
- 15.2.2 NeXus RV
- 15.2.2.1. Overview
- 15.2.2.2. Products
- 15.2.2.3. SWOT Analysis
- 15.2.2.4. Recent Developments
- 15.2.2.5. Financials (Based on Availability)
- 15.2.3 Tiffin Motorhomes Inc
- 15.2.3.1. Overview
- 15.2.3.2. Products
- 15.2.3.3. SWOT Analysis
- 15.2.3.4. Recent Developments
- 15.2.3.5. Financials (Based on Availability)
- 15.2.4 Thor Industries Inc
- 15.2.4.1. Overview
- 15.2.4.2. Products
- 15.2.4.3. SWOT Analysis
- 15.2.4.4. Recent Developments
- 15.2.4.5. Financials (Based on Availability)
- 15.2.5 Winnebago Industries Inc
- 15.2.5.1. Overview
- 15.2.5.2. Products
- 15.2.5.3. SWOT Analysis
- 15.2.5.4. Recent Developments
- 15.2.5.5. Financials (Based on Availability)
- 15.2.6 Entegra Coach Inc
- 15.2.6.1. Overview
- 15.2.6.2. Products
- 15.2.6.3. SWOT Analysis
- 15.2.6.4. Recent Developments
- 15.2.6.5. Financials (Based on Availability)
- 15.2.7 Cruiser R
- 15.2.7.1. Overview
- 15.2.7.2. Products
- 15.2.7.3. SWOT Analysis
- 15.2.7.4. Recent Developments
- 15.2.7.5. Financials (Based on Availability)
- 15.2.8 Triple E Recreational Vehicles
- 15.2.8.1. Overview
- 15.2.8.2. Products
- 15.2.8.3. SWOT Analysis
- 15.2.8.4. Recent Developments
- 15.2.8.5. Financials (Based on Availability)
- 15.2.9 Forest River Inc
- 15.2.9.1. Overview
- 15.2.9.2. Products
- 15.2.9.3. SWOT Analysis
- 15.2.9.4. Recent Developments
- 15.2.9.5. Financials (Based on Availability)
- 15.2.1 REV Group
List of Figures
- Figure 1: Global Recreational Vehicle Market in North America Revenue Breakdown (Million, %) by Region 2024 & 2032
- Figure 2: North America Recreational Vehicle Market in North America Revenue (Million), by Country 2024 & 2032
- Figure 3: North America Recreational Vehicle Market in North America Revenue Share (%), by Country 2024 & 2032
- Figure 4: North America Recreational Vehicle Market in North America Revenue (Million), by Type 2024 & 2032
- Figure 5: North America Recreational Vehicle Market in North America Revenue Share (%), by Type 2024 & 2032
- Figure 6: North America Recreational Vehicle Market in North America Revenue (Million), by Application 2024 & 2032
- Figure 7: North America Recreational Vehicle Market in North America Revenue Share (%), by Application 2024 & 2032
- Figure 8: North America Recreational Vehicle Market in North America Revenue (Million), by Country 2024 & 2032
- Figure 9: North America Recreational Vehicle Market in North America Revenue Share (%), by Country 2024 & 2032
- Figure 10: South America Recreational Vehicle Market in North America Revenue (Million), by Type 2024 & 2032
- Figure 11: South America Recreational Vehicle Market in North America Revenue Share (%), by Type 2024 & 2032
- Figure 12: South America Recreational Vehicle Market in North America Revenue (Million), by Application 2024 & 2032
- Figure 13: South America Recreational Vehicle Market in North America Revenue Share (%), by Application 2024 & 2032
- Figure 14: South America Recreational Vehicle Market in North America Revenue (Million), by Country 2024 & 2032
- Figure 15: South America Recreational Vehicle Market in North America Revenue Share (%), by Country 2024 & 2032
- Figure 16: Europe Recreational Vehicle Market in North America Revenue (Million), by Type 2024 & 2032
- Figure 17: Europe Recreational Vehicle Market in North America Revenue Share (%), by Type 2024 & 2032
- Figure 18: Europe Recreational Vehicle Market in North America Revenue (Million), by Application 2024 & 2032
- Figure 19: Europe Recreational Vehicle Market in North America Revenue Share (%), by Application 2024 & 2032
- Figure 20: Europe Recreational Vehicle Market in North America Revenue (Million), by Country 2024 & 2032
- Figure 21: Europe Recreational Vehicle Market in North America Revenue Share (%), by Country 2024 & 2032
- Figure 22: Middle East & Africa Recreational Vehicle Market in North America Revenue (Million), by Type 2024 & 2032
- Figure 23: Middle East & Africa Recreational Vehicle Market in North America Revenue Share (%), by Type 2024 & 2032
- Figure 24: Middle East & Africa Recreational Vehicle Market in North America Revenue (Million), by Application 2024 & 2032
- Figure 25: Middle East & Africa Recreational Vehicle Market in North America Revenue Share (%), by Application 2024 & 2032
- Figure 26: Middle East & Africa Recreational Vehicle Market in North America Revenue (Million), by Country 2024 & 2032
- Figure 27: Middle East & Africa Recreational Vehicle Market in North America Revenue Share (%), by Country 2024 & 2032
- Figure 28: Asia Pacific Recreational Vehicle Market in North America Revenue (Million), by Type 2024 & 2032
- Figure 29: Asia Pacific Recreational Vehicle Market in North America Revenue Share (%), by Type 2024 & 2032
- Figure 30: Asia Pacific Recreational Vehicle Market in North America Revenue (Million), by Application 2024 & 2032
- Figure 31: Asia Pacific Recreational Vehicle Market in North America Revenue Share (%), by Application 2024 & 2032
- Figure 32: Asia Pacific Recreational Vehicle Market in North America Revenue (Million), by Country 2024 & 2032
- Figure 33: Asia Pacific Recreational Vehicle Market in North America Revenue Share (%), by Country 2024 & 2032
List of Tables
- Table 1: Global Recreational Vehicle Market in North America Revenue Million Forecast, by Region 2019 & 2032
- Table 2: Global Recreational Vehicle Market in North America Revenue Million Forecast, by Type 2019 & 2032
- Table 3: Global Recreational Vehicle Market in North America Revenue Million Forecast, by Application 2019 & 2032
- Table 4: Global Recreational Vehicle Market in North America Revenue Million Forecast, by Region 2019 & 2032
- Table 5: Global Recreational Vehicle Market in North America Revenue Million Forecast, by Country 2019 & 2032
- Table 6: United States Recreational Vehicle Market in North America Revenue (Million) Forecast, by Application 2019 & 2032
- Table 7: Canada Recreational Vehicle Market in North America Revenue (Million) Forecast, by Application 2019 & 2032
- Table 8: Mexico Recreational Vehicle Market in North America Revenue (Million) Forecast, by Application 2019 & 2032
- Table 9: Rest of North America Recreational Vehicle Market in North America Revenue (Million) Forecast, by Application 2019 & 2032
- Table 10: Global Recreational Vehicle Market in North America Revenue Million Forecast, by Type 2019 & 2032
- Table 11: Global Recreational Vehicle Market in North America Revenue Million Forecast, by Application 2019 & 2032
- Table 12: Global Recreational Vehicle Market in North America Revenue Million Forecast, by Country 2019 & 2032
- Table 13: United States Recreational Vehicle Market in North America Revenue (Million) Forecast, by Application 2019 & 2032
- Table 14: Canada Recreational Vehicle Market in North America Revenue (Million) Forecast, by Application 2019 & 2032
- Table 15: Mexico Recreational Vehicle Market in North America Revenue (Million) Forecast, by Application 2019 & 2032
- Table 16: Global Recreational Vehicle Market in North America Revenue Million Forecast, by Type 2019 & 2032
- Table 17: Global Recreational Vehicle Market in North America Revenue Million Forecast, by Application 2019 & 2032
- Table 18: Global Recreational Vehicle Market in North America Revenue Million Forecast, by Country 2019 & 2032
- Table 19: Brazil Recreational Vehicle Market in North America Revenue (Million) Forecast, by Application 2019 & 2032
- Table 20: Argentina Recreational Vehicle Market in North America Revenue (Million) Forecast, by Application 2019 & 2032
- Table 21: Rest of South America Recreational Vehicle Market in North America Revenue (Million) Forecast, by Application 2019 & 2032
- Table 22: Global Recreational Vehicle Market in North America Revenue Million Forecast, by Type 2019 & 2032
- Table 23: Global Recreational Vehicle Market in North America Revenue Million Forecast, by Application 2019 & 2032
- Table 24: Global Recreational Vehicle Market in North America Revenue Million Forecast, by Country 2019 & 2032
- Table 25: United Kingdom Recreational Vehicle Market in North America Revenue (Million) Forecast, by Application 2019 & 2032
- Table 26: Germany Recreational Vehicle Market in North America Revenue (Million) Forecast, by Application 2019 & 2032
- Table 27: France Recreational Vehicle Market in North America Revenue (Million) Forecast, by Application 2019 & 2032
- Table 28: Italy Recreational Vehicle Market in North America Revenue (Million) Forecast, by Application 2019 & 2032
- Table 29: Spain Recreational Vehicle Market in North America Revenue (Million) Forecast, by Application 2019 & 2032
- Table 30: Russia Recreational Vehicle Market in North America Revenue (Million) Forecast, by Application 2019 & 2032
- Table 31: Benelux Recreational Vehicle Market in North America Revenue (Million) Forecast, by Application 2019 & 2032
- Table 32: Nordics Recreational Vehicle Market in North America Revenue (Million) Forecast, by Application 2019 & 2032
- Table 33: Rest of Europe Recreational Vehicle Market in North America Revenue (Million) Forecast, by Application 2019 & 2032
- Table 34: Global Recreational Vehicle Market in North America Revenue Million Forecast, by Type 2019 & 2032
- Table 35: Global Recreational Vehicle Market in North America Revenue Million Forecast, by Application 2019 & 2032
- Table 36: Global Recreational Vehicle Market in North America Revenue Million Forecast, by Country 2019 & 2032
- Table 37: Turkey Recreational Vehicle Market in North America Revenue (Million) Forecast, by Application 2019 & 2032
- Table 38: Israel Recreational Vehicle Market in North America Revenue (Million) Forecast, by Application 2019 & 2032
- Table 39: GCC Recreational Vehicle Market in North America Revenue (Million) Forecast, by Application 2019 & 2032
- Table 40: North Africa Recreational Vehicle Market in North America Revenue (Million) Forecast, by Application 2019 & 2032
- Table 41: South Africa Recreational Vehicle Market in North America Revenue (Million) Forecast, by Application 2019 & 2032
- Table 42: Rest of Middle East & Africa Recreational Vehicle Market in North America Revenue (Million) Forecast, by Application 2019 & 2032
- Table 43: Global Recreational Vehicle Market in North America Revenue Million Forecast, by Type 2019 & 2032
- Table 44: Global Recreational Vehicle Market in North America Revenue Million Forecast, by Application 2019 & 2032
- Table 45: Global Recreational Vehicle Market in North America Revenue Million Forecast, by Country 2019 & 2032
- Table 46: China Recreational Vehicle Market in North America Revenue (Million) Forecast, by Application 2019 & 2032
- Table 47: India Recreational Vehicle Market in North America Revenue (Million) Forecast, by Application 2019 & 2032
- Table 48: Japan Recreational Vehicle Market in North America Revenue (Million) Forecast, by Application 2019 & 2032
- Table 49: South Korea Recreational Vehicle Market in North America Revenue (Million) Forecast, by Application 2019 & 2032
- Table 50: ASEAN Recreational Vehicle Market in North America Revenue (Million) Forecast, by Application 2019 & 2032
- Table 51: Oceania Recreational Vehicle Market in North America Revenue (Million) Forecast, by Application 2019 & 2032
- Table 52: Rest of Asia Pacific Recreational Vehicle Market in North America Revenue (Million) Forecast, by Application 2019 & 2032
Frequently Asked Questions
1. What is the projected Compound Annual Growth Rate (CAGR) of the Recreational Vehicle Market in North America?
The projected CAGR is approximately 7.99%.
2. Which companies are prominent players in the Recreational Vehicle Market in North America?
Key companies in the market include REV Group, NeXus RV, Tiffin Motorhomes Inc, Thor Industries Inc, Winnebago Industries Inc, Entegra Coach Inc, Cruiser R, Triple E Recreational Vehicles, Forest River Inc.
3. What are the main segments of the Recreational Vehicle Market in North America?
The market segments include Type, Application.
4. Can you provide details about the market size?
The market size is estimated to be USD 19.83 Million as of 2022.
5. What are some drivers contributing to market growth?
Increased Travel and Tourism to Fuel Market Demand.
6. What are the notable trends driving market growth?
Motorized RVs are the Largest Segment by Type.
7. Are there any restraints impacting market growth?
Recreational Vehicle Rental to Affect The Market Over the Long Term.
8. Can you provide examples of recent developments in the market?
April 2023: First Hydrogen introduced a novel zero-emission recreational vehicle (RV), utilizing fuel cell technology in collaboration with the EDAG Group. This partnership seeks to apply fuel cell electric technology to larger vehicles, showcasing the advantage of handling higher payloads and achieving longer ranges compared to battery electric vehicles (BEVs) for RVs. Their inaugural van is designed to cover distances ranging from 249 to 373 miles (400 to 600 kilometers) on a single five-minute refueling, with the expected range for the Gen 2 vehicle yet to be disclosed.
9. What pricing options are available for accessing the report?
Pricing options include single-user, multi-user, and enterprise licenses priced at USD 4750, USD 4950, and USD 6800 respectively.
10. Is the market size provided in terms of value or volume?
The market size is provided in terms of value, measured in Million.
11. Are there any specific market keywords associated with the report?
Yes, the market keyword associated with the report is "Recreational Vehicle Market in North America," which aids in identifying and referencing the specific market segment covered.
12. How do I determine which pricing option suits my needs best?
The pricing options vary based on user requirements and access needs. Individual users may opt for single-user licenses, while businesses requiring broader access may choose multi-user or enterprise licenses for cost-effective access to the report.
13. Are there any additional resources or data provided in the Recreational Vehicle Market in North America report?
While the report offers comprehensive insights, it's advisable to review the specific contents or supplementary materials provided to ascertain if additional resources or data are available.
14. How can I stay updated on further developments or reports in the Recreational Vehicle Market in North America?
To stay informed about further developments, trends, and reports in the Recreational Vehicle Market in North America, consider subscribing to industry newsletters, following relevant companies and organizations, or regularly checking reputable industry news sources and publications.
Methodology
Step 1 - Identification of Relevant Samples Size from Population Database


Step 2 - Approaches for Defining Global Market Size (Value, Volume* & Price*)

Note*: In applicable scenarios
Step 3 - Data Sources
Primary Research
- Web Analytics
- Survey Reports
- Research Institute
- Latest Research Reports
- Opinion Leaders
Secondary Research
- Annual Reports
- White Paper
- Latest Press Release
- Industry Association
- Paid Database
- Investor Presentations

Step 4 - Data Triangulation
Involves using different sources of information in order to increase the validity of a study
These sources are likely to be stakeholders in a program - participants, other researchers, program staff, other community members, and so on.
Then we put all data in single framework & apply various statistical tools to find out the dynamic on the market.
During the analysis stage, feedback from the stakeholder groups would be compared to determine areas of agreement as well as areas of divergence


