

Key Insights
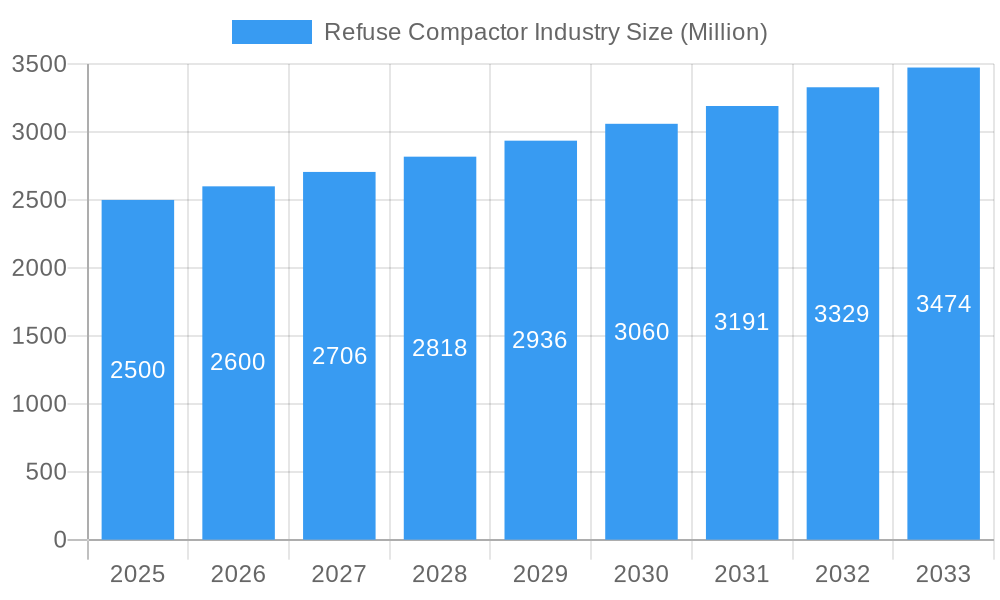
The refuse compactor market is poised for significant expansion, projecting a Compound Annual Growth Rate (CAGR) of 3.4% from 2024 through 2033. This growth trajectory is propelled by escalating urbanization, leading to increased waste generation and a heightened demand for efficient compaction solutions. Furthermore, stringent global environmental regulations are driving the adoption of sustainable waste management practices, making refuse compactors essential for optimizing landfill utilization and reducing transportation expenditures. Innovations in automated and intelligent compactor technologies, offering enhanced efficiency and reduced energy consumption, are also key growth catalysts. The market is also experiencing a trend towards the development of more robust and durable equipment engineered for demanding operational environments.
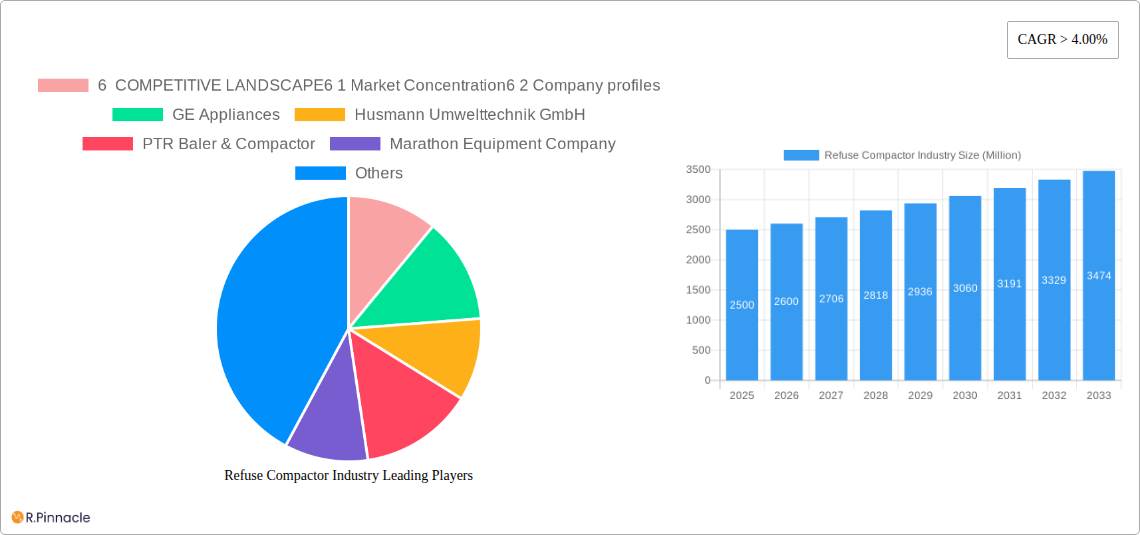
Refuse Compactor Industry Market Size (In Million)
Market segmentation includes compactor type (stationary, mobile, self-contained), application (residential, commercial, industrial), and technology (hydraulic, pneumatic). While specific segment figures are proprietary, analysis indicates strong performance in the commercial and industrial sectors due to substantial waste volumes. The competitive landscape is characterized by moderate concentration, featuring prominent players such as GE Appliances, Husmann Umwelttechnik GmbH, and Wastequip LLC. These companies are prioritizing innovation, strategic alliances, and global market penetration. Potential challenges include the substantial upfront investment for advanced compactor systems and volatility in raw material costs. Future expansion will be shaped by government incentives supporting recycling and waste reduction, alongside ongoing technological advancements in compactor design and smart waste management systems. The market is anticipated to reach a substantial size of approximately 280 million by 2033, underpinned by these drivers and a persistent focus on efficient and sustainable waste management.
Refuse Compactor Industry Company Market Share
Refuse Compactor Industry Report: 2019-2033 Forecast
This comprehensive report provides a detailed analysis of the Refuse Compactor Industry, offering invaluable insights for industry professionals, investors, and strategic decision-makers. The study period covers 2019-2033, with a base year of 2025 and a forecast period of 2025-2033. The report leverages extensive market research, encompassing historical data (2019-2024) and future projections, to deliver a robust understanding of this dynamic sector. Market values are expressed in Millions.
Refuse Compactor Industry Market Structure & Innovation Trends
This section analyzes the competitive landscape, innovation drivers, and regulatory influences shaping the Refuse Compactor Industry. The market concentration is currently estimated at xx%, indicating a [moderately/highly/lowly] fragmented market (Further details within report).
- Market Concentration: xx% (2025)
- Top Players' Market Share: (Detailed breakdown within report)
- M&A Activity: Over the historical period, approximately xx Million USD worth of M&A deals were observed (Further details within report). Key drivers include [mention specific drivers based on research].
- Innovation Drivers: Growing environmental concerns, stringent waste management regulations, and advancements in automation and digitalization are key drivers of innovation.
- Regulatory Frameworks: Government regulations regarding waste disposal and recycling significantly impact market growth and product development. (Further details within report).
- Product Substitutes: [List and analyze substitute products and their impact on market share].
- End-User Demographics: The report details the characteristics of key end-user segments, such as municipal waste management, industrial facilities, and commercial businesses. (Further details within report).
Refuse Compactor Industry Market Dynamics & Trends
This section delves into the key factors influencing market growth and trajectory. The Refuse Compactor Industry exhibits a CAGR of xx% during the forecast period (2025-2033). Market penetration varies significantly across geographical regions, with [mention leading regions] leading the way.
[Insert 600 words of detailed analysis on market growth drivers, technological disruptions, consumer preferences, and competitive dynamics. Include specific metrics like CAGR and market penetration for different segments (e.g., by type of compactor, end-user segment, region)].
Dominant Regions & Segments in Refuse Compactor Industry
[Insert 600 words of analysis on the leading regions and segments, utilizing bullet points for key drivers and paragraphs for detailed analysis. Include supporting data and metrics.]
- Key Drivers (Example for a dominant region):
- Favorable government policies promoting waste management infrastructure development.
- High population density leading to increased waste generation.
- Robust economic growth providing funding for waste management solutions. [Repeat for other dominant regions and segments]
Refuse Compactor Industry Product Innovations
Recent innovations in the refuse compactor industry focus on enhancing efficiency, automation, and sustainability. This includes the development of [mention specific technological advancements, e.g., smart compactors with remote monitoring capabilities, improved compaction ratios, and integration with waste management software]. These innovations cater to the growing demand for efficient and environmentally friendly waste management solutions.
Report Scope & Segmentation Analysis
The report segments the Refuse Compactor Industry by various factors such as [mention key segmentation criteria, e.g., product type (e.g., horizontal, vertical, stationary, mobile), end-user (municipal, industrial, commercial), and geography]. Each segment's growth projections, market size, and competitive dynamics are analyzed in detail. [Provide a short paragraph for each segment, detailing its growth prospects, market size, and competition].
Key Drivers of Refuse Compactor Industry Growth
The Refuse Compactor Industry's growth is fueled by several factors: increasing urbanization and waste generation, stringent environmental regulations, advancements in automation and technology leading to increased efficiency and reduced operating costs, and the rising adoption of sustainable waste management practices. Government initiatives promoting waste-to-energy projects further contribute to market expansion.
Challenges in the Refuse Compactor Industry Sector
The Refuse Compactor Industry faces challenges, including fluctuating raw material prices, stringent environmental regulations increasing production costs, and intense competition from both domestic and international players. Supply chain disruptions and rising energy costs can impact profitability. [Quantifiable impacts should be included within the full report.]
Emerging Opportunities in Refuse Compactor Industry
Emerging opportunities exist in developing markets with growing urbanization and increasing waste generation. The integration of smart technologies, such as IoT sensors and AI-powered analytics, offers considerable potential for improving efficiency and optimizing waste management processes. [Further detail will be provided within the report.]
Leading Players in the Refuse Compactor Industry Market
The Refuse Compactor Industry is characterized by the presence of both large multinational corporations and smaller specialized companies. Key players include:
- GE Appliances
- Husmann Umwelttechnik GmbH
- PTR Baler & Compactor
- Marathon Equipment Company
- Capital Compactors Ltd
- Compactor Management Company
- Genesis Waste Handling Private Limited
- Precision Machinery Systems
- ACE Equipment Company
- Wastequip LLC (Wastequip LLC) [Note: This list is not exhaustive. The full report contains a more comprehensive list of market participants.]
Key Developments in Refuse Compactor Industry
- September 2021: Wastequip launched Wasteware, a cloud-based solution for waste and recycling management, enhancing operational efficiency and data analysis capabilities.
- February 2022: The New Town Kolkata Development Authority planned to establish 15 compactor stations, signifying investment in waste management infrastructure.
Future Outlook for Refuse Compactor Industry Market
The Refuse Compactor Industry is poised for sustained growth, driven by increasing urbanization, stringent environmental regulations, and technological advancements. Strategic opportunities lie in developing innovative, sustainable, and technologically advanced solutions that address the growing challenges of waste management in a rapidly changing world. Further growth is expected due to [insert specific predictions based on research and market analysis].
Refuse Compactor Industry Segmentation
-
1. Product Type
- 1.1. Portable
- 1.2. Stationary
-
2. Waste Type
- 2.1. Dry Waste
- 2.2. Wet Waste
-
3. Application
- 3.1. Residential
- 3.2. Agricultural
- 3.3. Municipal
- 3.4. Commercial
- 3.5. Industrial
Refuse Compactor Industry Segmentation By Geography
- 1. North America
- 2. Latin America
- 3. Asia Pacific
- 4. Middle East and Africa
- 5. Europe
- 6. Rest of the World
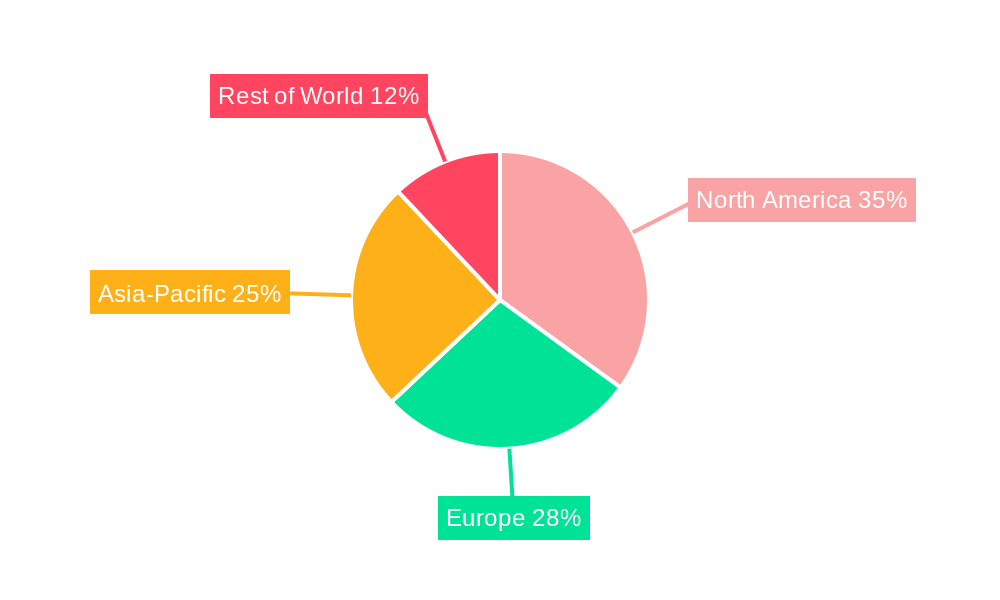
Refuse Compactor Industry Regional Market Share
Geographic Coverage of Refuse Compactor Industry
Refuse Compactor Industry REPORT HIGHLIGHTS
| Aspects | Details |
|---|---|
| Study Period | 2020-2034 |
| Base Year | 2025 |
| Estimated Year | 2026 |
| Forecast Period | 2026-2034 |
| Historical Period | 2020-2025 |
| Growth Rate | CAGR of 3.4% from 2020-2034 |
| Segmentation |
|
Table of Contents
- 1. Introduction
- 1.1. Research Scope
- 1.2. Market Segmentation
- 1.3. Research Objective
- 1.4. Definitions and Assumptions
- 2. Executive Summary
- 2.1. Market Snapshot
- 3. Market Dynamics
- 3.1. Market Drivers
- 3.2. Market Restrains
- 3.3. Market Trends
- 3.4. Market Opportunities
- 4. Market Factor Analysis
- 4.1. Porters Five Forces
- 4.1.1. Bargaining Power of Suppliers
- 4.1.2. Bargaining Power of Buyers
- 4.1.3. Threat of New Entrants
- 4.1.4. Threat of Substitutes
- 4.1.5. Competitive Rivalry
- 4.2. PESTEL analysis
- 4.3. BCG Analysis
- 4.3.1. Stars (High Growth, High Market Share)
- 4.3.2. Cash Cows (Low Growth, High Market Share)
- 4.3.3. Question Mark (High Growth, Low Market Share)
- 4.3.4. Dogs (Low Growth, Low Market Share)
- 4.4. Ansoff Matrix Analysis
- 4.5. Supply Chain Analysis
- 4.6. Regulatory Landscape
- 4.7. Current Market Potential and Opportunity Assessment (TAM–SAM–SOM Framework)
- 4.8. PRI Analyst Note
- 4.1. Porters Five Forces
- 5. Market Analysis, Insights and Forecast 2021-2033
- 5.1. Market Analysis, Insights and Forecast - by Product Type
- 5.1.1. Portable
- 5.1.2. Stationary
- 5.2. Market Analysis, Insights and Forecast - by Waste Type
- 5.2.1. Dry Waste
- 5.2.2. Wet Waste
- 5.3. Market Analysis, Insights and Forecast - by Application
- 5.3.1. Residential
- 5.3.2. Agricultural
- 5.3.3. Municipal
- 5.3.4. Commercial
- 5.3.5. Industrial
- 5.4. Market Analysis, Insights and Forecast - by Region
- 5.4.1. North America
- 5.4.2. Latin America
- 5.4.3. Asia Pacific
- 5.4.4. Middle East and Africa
- 5.4.5. Europe
- 5.4.6. Rest of the World
- 5.1. Market Analysis, Insights and Forecast - by Product Type
- 6. Global Refuse Compactor Industry Analysis, Insights and Forecast, 2021-2033
- 6.1. Market Analysis, Insights and Forecast - by Product Type
- 6.1.1. Portable
- 6.1.2. Stationary
- 6.2. Market Analysis, Insights and Forecast - by Waste Type
- 6.2.1. Dry Waste
- 6.2.2. Wet Waste
- 6.3. Market Analysis, Insights and Forecast - by Application
- 6.3.1. Residential
- 6.3.2. Agricultural
- 6.3.3. Municipal
- 6.3.4. Commercial
- 6.3.5. Industrial
- 6.1. Market Analysis, Insights and Forecast - by Product Type
- 7. North America Refuse Compactor Industry Analysis, Insights and Forecast, 2020-2032
- 7.1. Market Analysis, Insights and Forecast - by Product Type
- 7.1.1. Portable
- 7.1.2. Stationary
- 7.2. Market Analysis, Insights and Forecast - by Waste Type
- 7.2.1. Dry Waste
- 7.2.2. Wet Waste
- 7.3. Market Analysis, Insights and Forecast - by Application
- 7.3.1. Residential
- 7.3.2. Agricultural
- 7.3.3. Municipal
- 7.3.4. Commercial
- 7.3.5. Industrial
- 7.1. Market Analysis, Insights and Forecast - by Product Type
- 8. Latin America Refuse Compactor Industry Analysis, Insights and Forecast, 2020-2032
- 8.1. Market Analysis, Insights and Forecast - by Product Type
- 8.1.1. Portable
- 8.1.2. Stationary
- 8.2. Market Analysis, Insights and Forecast - by Waste Type
- 8.2.1. Dry Waste
- 8.2.2. Wet Waste
- 8.3. Market Analysis, Insights and Forecast - by Application
- 8.3.1. Residential
- 8.3.2. Agricultural
- 8.3.3. Municipal
- 8.3.4. Commercial
- 8.3.5. Industrial
- 8.1. Market Analysis, Insights and Forecast - by Product Type
- 9. Asia Pacific Refuse Compactor Industry Analysis, Insights and Forecast, 2020-2032
- 9.1. Market Analysis, Insights and Forecast - by Product Type
- 9.1.1. Portable
- 9.1.2. Stationary
- 9.2. Market Analysis, Insights and Forecast - by Waste Type
- 9.2.1. Dry Waste
- 9.2.2. Wet Waste
- 9.3. Market Analysis, Insights and Forecast - by Application
- 9.3.1. Residential
- 9.3.2. Agricultural
- 9.3.3. Municipal
- 9.3.4. Commercial
- 9.3.5. Industrial
- 9.1. Market Analysis, Insights and Forecast - by Product Type
- 10. Middle East and Africa Refuse Compactor Industry Analysis, Insights and Forecast, 2020-2032
- 10.1. Market Analysis, Insights and Forecast - by Product Type
- 10.1.1. Portable
- 10.1.2. Stationary
- 10.2. Market Analysis, Insights and Forecast - by Waste Type
- 10.2.1. Dry Waste
- 10.2.2. Wet Waste
- 10.3. Market Analysis, Insights and Forecast - by Application
- 10.3.1. Residential
- 10.3.2. Agricultural
- 10.3.3. Municipal
- 10.3.4. Commercial
- 10.3.5. Industrial
- 10.1. Market Analysis, Insights and Forecast - by Product Type
- 11. Europe Refuse Compactor Industry Analysis, Insights and Forecast, 2020-2032
- 11.1. Market Analysis, Insights and Forecast - by Product Type
- 11.1.1. Portable
- 11.1.2. Stationary
- 11.2. Market Analysis, Insights and Forecast - by Waste Type
- 11.2.1. Dry Waste
- 11.2.2. Wet Waste
- 11.3. Market Analysis, Insights and Forecast - by Application
- 11.3.1. Residential
- 11.3.2. Agricultural
- 11.3.3. Municipal
- 11.3.4. Commercial
- 11.3.5. Industrial
- 11.1. Market Analysis, Insights and Forecast - by Product Type
- 12. Rest of the World Refuse Compactor Industry Analysis, Insights and Forecast, 2020-2032
- 12.1. Market Analysis, Insights and Forecast - by Product Type
- 12.1.1. Portable
- 12.1.2. Stationary
- 12.2. Market Analysis, Insights and Forecast - by Waste Type
- 12.2.1. Dry Waste
- 12.2.2. Wet Waste
- 12.3. Market Analysis, Insights and Forecast - by Application
- 12.3.1. Residential
- 12.3.2. Agricultural
- 12.3.3. Municipal
- 12.3.4. Commercial
- 12.3.5. Industrial
- 12.1. Market Analysis, Insights and Forecast - by Product Type
- 13. Competitive Analysis
- 13.1. Company Profiles
- 13.1.1 6 COMPETITIVE LANDSCAPE6 1 Market Concentration6 2 Company profiles
- 13.1.1.1. Company Overview
- 13.1.1.2. Products
- 13.1.1.3. Company Financials
- 13.1.1.4. SWOT Analysis
- 13.1.2 GE Appliances
- 13.1.2.1. Company Overview
- 13.1.2.2. Products
- 13.1.2.3. Company Financials
- 13.1.2.4. SWOT Analysis
- 13.1.3 Husmann Umwelttechnik GmbH
- 13.1.3.1. Company Overview
- 13.1.3.2. Products
- 13.1.3.3. Company Financials
- 13.1.3.4. SWOT Analysis
- 13.1.4 PTR Baler & Compactor
- 13.1.4.1. Company Overview
- 13.1.4.2. Products
- 13.1.4.3. Company Financials
- 13.1.4.4. SWOT Analysis
- 13.1.5 Marathon Equipment Company
- 13.1.5.1. Company Overview
- 13.1.5.2. Products
- 13.1.5.3. Company Financials
- 13.1.5.4. SWOT Analysis
- 13.1.6 Capital Compactors Ltd
- 13.1.6.1. Company Overview
- 13.1.6.2. Products
- 13.1.6.3. Company Financials
- 13.1.6.4. SWOT Analysis
- 13.1.7 Compactor Management Company
- 13.1.7.1. Company Overview
- 13.1.7.2. Products
- 13.1.7.3. Company Financials
- 13.1.7.4. SWOT Analysis
- 13.1.8 Genesis Waste Handling Private Limited
- 13.1.8.1. Company Overview
- 13.1.8.2. Products
- 13.1.8.3. Company Financials
- 13.1.8.4. SWOT Analysis
- 13.1.9 Precision Machinery Systems
- 13.1.9.1. Company Overview
- 13.1.9.2. Products
- 13.1.9.3. Company Financials
- 13.1.9.4. SWOT Analysis
- 13.1.10 ACE Equipment Company
- 13.1.10.1. Company Overview
- 13.1.10.2. Products
- 13.1.10.3. Company Financials
- 13.1.10.4. SWOT Analysis
- 13.1.11 Wastequip LLC **List Not Exhaustive
- 13.1.11.1. Company Overview
- 13.1.11.2. Products
- 13.1.11.3. Company Financials
- 13.1.11.4. SWOT Analysis
- 13.1.1 6 COMPETITIVE LANDSCAPE6 1 Market Concentration6 2 Company profiles
- 13.2. Market Entropy
- 13.2.1 Company's Key Areas Served
- 13.2.2 Recent Developments
- 13.3. Company Market Share Analysis 2025
- 13.3.1 Top 5 Companies Market Share Analysis
- 13.3.2 Top 3 Companies Market Share Analysis
- 13.4. List of Potential Customers
- 14. Research Methodology
List of Figures
- Figure 1: Global Refuse Compactor Industry Revenue Breakdown (million, %) by Region 2025 & 2033
- Figure 2: North America Refuse Compactor Industry Revenue (million), by Product Type 2025 & 2033
- Figure 3: North America Refuse Compactor Industry Revenue Share (%), by Product Type 2025 & 2033
- Figure 4: North America Refuse Compactor Industry Revenue (million), by Waste Type 2025 & 2033
- Figure 5: North America Refuse Compactor Industry Revenue Share (%), by Waste Type 2025 & 2033
- Figure 6: North America Refuse Compactor Industry Revenue (million), by Application 2025 & 2033
- Figure 7: North America Refuse Compactor Industry Revenue Share (%), by Application 2025 & 2033
- Figure 8: North America Refuse Compactor Industry Revenue (million), by Country 2025 & 2033
- Figure 9: North America Refuse Compactor Industry Revenue Share (%), by Country 2025 & 2033
- Figure 10: Latin America Refuse Compactor Industry Revenue (million), by Product Type 2025 & 2033
- Figure 11: Latin America Refuse Compactor Industry Revenue Share (%), by Product Type 2025 & 2033
- Figure 12: Latin America Refuse Compactor Industry Revenue (million), by Waste Type 2025 & 2033
- Figure 13: Latin America Refuse Compactor Industry Revenue Share (%), by Waste Type 2025 & 2033
- Figure 14: Latin America Refuse Compactor Industry Revenue (million), by Application 2025 & 2033
- Figure 15: Latin America Refuse Compactor Industry Revenue Share (%), by Application 2025 & 2033
- Figure 16: Latin America Refuse Compactor Industry Revenue (million), by Country 2025 & 2033
- Figure 17: Latin America Refuse Compactor Industry Revenue Share (%), by Country 2025 & 2033
- Figure 18: Asia Pacific Refuse Compactor Industry Revenue (million), by Product Type 2025 & 2033
- Figure 19: Asia Pacific Refuse Compactor Industry Revenue Share (%), by Product Type 2025 & 2033
- Figure 20: Asia Pacific Refuse Compactor Industry Revenue (million), by Waste Type 2025 & 2033
- Figure 21: Asia Pacific Refuse Compactor Industry Revenue Share (%), by Waste Type 2025 & 2033
- Figure 22: Asia Pacific Refuse Compactor Industry Revenue (million), by Application 2025 & 2033
- Figure 23: Asia Pacific Refuse Compactor Industry Revenue Share (%), by Application 2025 & 2033
- Figure 24: Asia Pacific Refuse Compactor Industry Revenue (million), by Country 2025 & 2033
- Figure 25: Asia Pacific Refuse Compactor Industry Revenue Share (%), by Country 2025 & 2033
- Figure 26: Middle East and Africa Refuse Compactor Industry Revenue (million), by Product Type 2025 & 2033
- Figure 27: Middle East and Africa Refuse Compactor Industry Revenue Share (%), by Product Type 2025 & 2033
- Figure 28: Middle East and Africa Refuse Compactor Industry Revenue (million), by Waste Type 2025 & 2033
- Figure 29: Middle East and Africa Refuse Compactor Industry Revenue Share (%), by Waste Type 2025 & 2033
- Figure 30: Middle East and Africa Refuse Compactor Industry Revenue (million), by Application 2025 & 2033
- Figure 31: Middle East and Africa Refuse Compactor Industry Revenue Share (%), by Application 2025 & 2033
- Figure 32: Middle East and Africa Refuse Compactor Industry Revenue (million), by Country 2025 & 2033
- Figure 33: Middle East and Africa Refuse Compactor Industry Revenue Share (%), by Country 2025 & 2033
- Figure 34: Europe Refuse Compactor Industry Revenue (million), by Product Type 2025 & 2033
- Figure 35: Europe Refuse Compactor Industry Revenue Share (%), by Product Type 2025 & 2033
- Figure 36: Europe Refuse Compactor Industry Revenue (million), by Waste Type 2025 & 2033
- Figure 37: Europe Refuse Compactor Industry Revenue Share (%), by Waste Type 2025 & 2033
- Figure 38: Europe Refuse Compactor Industry Revenue (million), by Application 2025 & 2033
- Figure 39: Europe Refuse Compactor Industry Revenue Share (%), by Application 2025 & 2033
- Figure 40: Europe Refuse Compactor Industry Revenue (million), by Country 2025 & 2033
- Figure 41: Europe Refuse Compactor Industry Revenue Share (%), by Country 2025 & 2033
- Figure 42: Rest of the World Refuse Compactor Industry Revenue (million), by Product Type 2025 & 2033
- Figure 43: Rest of the World Refuse Compactor Industry Revenue Share (%), by Product Type 2025 & 2033
- Figure 44: Rest of the World Refuse Compactor Industry Revenue (million), by Waste Type 2025 & 2033
- Figure 45: Rest of the World Refuse Compactor Industry Revenue Share (%), by Waste Type 2025 & 2033
- Figure 46: Rest of the World Refuse Compactor Industry Revenue (million), by Application 2025 & 2033
- Figure 47: Rest of the World Refuse Compactor Industry Revenue Share (%), by Application 2025 & 2033
- Figure 48: Rest of the World Refuse Compactor Industry Revenue (million), by Country 2025 & 2033
- Figure 49: Rest of the World Refuse Compactor Industry Revenue Share (%), by Country 2025 & 2033
List of Tables
- Table 1: Global Refuse Compactor Industry Revenue million Forecast, by Product Type 2020 & 2033
- Table 2: Global Refuse Compactor Industry Revenue million Forecast, by Waste Type 2020 & 2033
- Table 3: Global Refuse Compactor Industry Revenue million Forecast, by Application 2020 & 2033
- Table 4: Global Refuse Compactor Industry Revenue million Forecast, by Region 2020 & 2033
- Table 5: Global Refuse Compactor Industry Revenue million Forecast, by Product Type 2020 & 2033
- Table 6: Global Refuse Compactor Industry Revenue million Forecast, by Waste Type 2020 & 2033
- Table 7: Global Refuse Compactor Industry Revenue million Forecast, by Application 2020 & 2033
- Table 8: Global Refuse Compactor Industry Revenue million Forecast, by Country 2020 & 2033
- Table 9: Global Refuse Compactor Industry Revenue million Forecast, by Product Type 2020 & 2033
- Table 10: Global Refuse Compactor Industry Revenue million Forecast, by Waste Type 2020 & 2033
- Table 11: Global Refuse Compactor Industry Revenue million Forecast, by Application 2020 & 2033
- Table 12: Global Refuse Compactor Industry Revenue million Forecast, by Country 2020 & 2033
- Table 13: Global Refuse Compactor Industry Revenue million Forecast, by Product Type 2020 & 2033
- Table 14: Global Refuse Compactor Industry Revenue million Forecast, by Waste Type 2020 & 2033
- Table 15: Global Refuse Compactor Industry Revenue million Forecast, by Application 2020 & 2033
- Table 16: Global Refuse Compactor Industry Revenue million Forecast, by Country 2020 & 2033
- Table 17: Global Refuse Compactor Industry Revenue million Forecast, by Product Type 2020 & 2033
- Table 18: Global Refuse Compactor Industry Revenue million Forecast, by Waste Type 2020 & 2033
- Table 19: Global Refuse Compactor Industry Revenue million Forecast, by Application 2020 & 2033
- Table 20: Global Refuse Compactor Industry Revenue million Forecast, by Country 2020 & 2033
- Table 21: Global Refuse Compactor Industry Revenue million Forecast, by Product Type 2020 & 2033
- Table 22: Global Refuse Compactor Industry Revenue million Forecast, by Waste Type 2020 & 2033
- Table 23: Global Refuse Compactor Industry Revenue million Forecast, by Application 2020 & 2033
- Table 24: Global Refuse Compactor Industry Revenue million Forecast, by Country 2020 & 2033
- Table 25: Global Refuse Compactor Industry Revenue million Forecast, by Product Type 2020 & 2033
- Table 26: Global Refuse Compactor Industry Revenue million Forecast, by Waste Type 2020 & 2033
- Table 27: Global Refuse Compactor Industry Revenue million Forecast, by Application 2020 & 2033
- Table 28: Global Refuse Compactor Industry Revenue million Forecast, by Country 2020 & 2033
Frequently Asked Questions
1. What is the projected Compound Annual Growth Rate (CAGR) of the Refuse Compactor Industry?
The projected CAGR is approximately 3.4%.
2. Which companies are prominent players in the Refuse Compactor Industry?
Key companies in the market include 6 COMPETITIVE LANDSCAPE6 1 Market Concentration6 2 Company profiles, GE Appliances, Husmann Umwelttechnik GmbH, PTR Baler & Compactor, Marathon Equipment Company, Capital Compactors Ltd, Compactor Management Company, Genesis Waste Handling Private Limited, Precision Machinery Systems, ACE Equipment Company, Wastequip LLC **List Not Exhaustive.
3. What are the main segments of the Refuse Compactor Industry?
The market segments include Product Type, Waste Type, Application.
4. Can you provide details about the market size?
The market size is estimated to be USD 280 million as of 2022.
5. What are some drivers contributing to market growth?
N/A
6. What are the notable trends driving market growth?
Asia-Pacific to Dominate the Market.
7. Are there any restraints impacting market growth?
N/A
8. Can you provide examples of recent developments in the market?
February 2022: The New Town Kolkata Development Authority has planned to set up 15 compactor stations in different locations across New Town to facilitate a daily waste collection and disposal system. The compactor stations will be constructed at an estimated cost of about Rs 4.1 crore.
9. What pricing options are available for accessing the report?
Pricing options include single-user, multi-user, and enterprise licenses priced at USD 4750, USD 5250, and USD 8750 respectively.
10. Is the market size provided in terms of value or volume?
The market size is provided in terms of value, measured in million.
11. Are there any specific market keywords associated with the report?
Yes, the market keyword associated with the report is "Refuse Compactor Industry," which aids in identifying and referencing the specific market segment covered.
12. How do I determine which pricing option suits my needs best?
The pricing options vary based on user requirements and access needs. Individual users may opt for single-user licenses, while businesses requiring broader access may choose multi-user or enterprise licenses for cost-effective access to the report.
13. Are there any additional resources or data provided in the Refuse Compactor Industry report?
While the report offers comprehensive insights, it's advisable to review the specific contents or supplementary materials provided to ascertain if additional resources or data are available.
14. How can I stay updated on further developments or reports in the Refuse Compactor Industry?
To stay informed about further developments, trends, and reports in the Refuse Compactor Industry, consider subscribing to industry newsletters, following relevant companies and organizations, or regularly checking reputable industry news sources and publications.
Methodology
Step 1 - Identification of Relevant Samples Size from Population Database


Step 2 - Approaches for Defining Global Market Size (Value, Volume* & Price*)

Note*: In applicable scenarios
Step 3 - Data Sources
Primary Research
- Web Analytics
- Survey Reports
- Research Institute
- Latest Research Reports
- Opinion Leaders
Secondary Research
- Annual Reports
- White Paper
- Latest Press Release
- Industry Association
- Paid Database
- Investor Presentations

Step 4 - Data Triangulation
Involves using different sources of information in order to increase the validity of a study
These sources are likely to be stakeholders in a program - participants, other researchers, program staff, other community members, and so on.
Then we put all data in single framework & apply various statistical tools to find out the dynamic on the market.
During the analysis stage, feedback from the stakeholder groups would be compared to determine areas of agreement as well as areas of divergence