

Key Insights
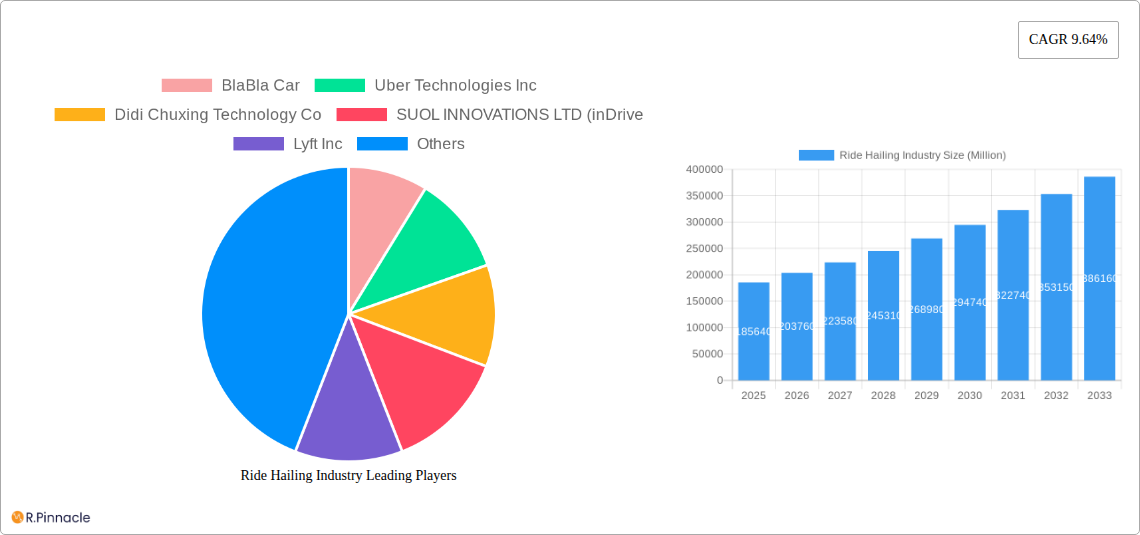
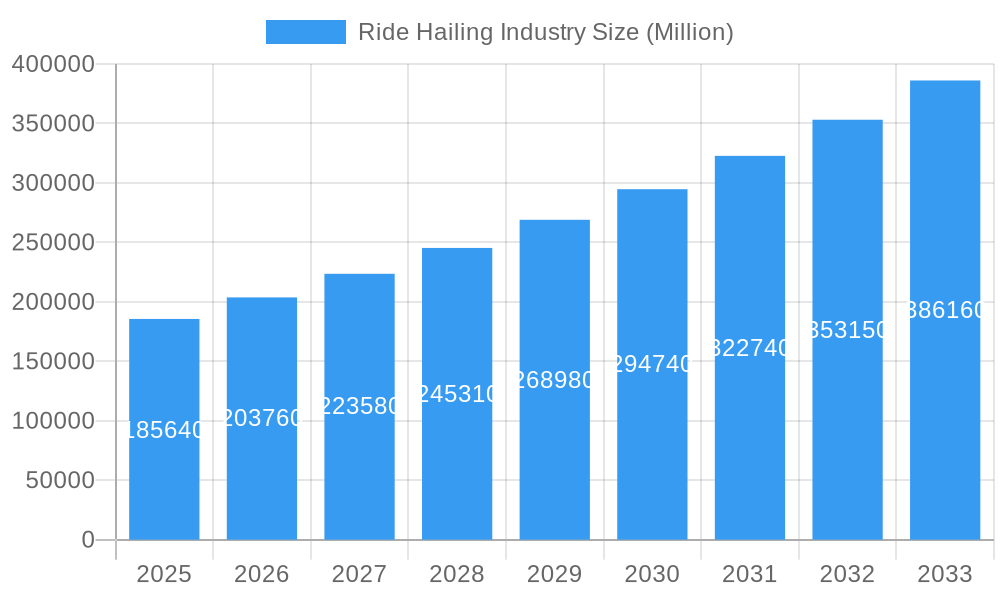
The ride-hailing market, valued at $185.64 billion in 2025, is experiencing robust growth, projected to expand at a Compound Annual Growth Rate (CAGR) of 9.64% from 2025 to 2033. This expansion is fueled by several key factors. Increasing urbanization and population density in major global cities create a higher demand for convenient and efficient transportation alternatives. The rising adoption of smartphones and the proliferation of mobile-based ride-hailing apps significantly contribute to market accessibility and ease of use. Furthermore, the emergence of electric vehicle integration within ride-hailing services is driving sustainability concerns and attracting environmentally conscious consumers. Competition within the industry remains fierce, with established players like Uber and Didi Chuxing constantly innovating to retain market share and expand into new geographic regions. Technological advancements, such as improved route optimization algorithms and AI-powered dispatch systems, are enhancing operational efficiency and customer experience. However, regulatory challenges related to licensing, driver classification, and safety standards pose significant hurdles to consistent growth in certain regions. The market segmentation highlights the diverse needs catered to, including varied vehicle types (motorcycles, cars, vans, buses) and propulsion types (ICE and electric), reflecting the industry's adaptation to diverse consumer preferences and environmental concerns. The geographical distribution shows strong presence across North America, Europe, and particularly Asia-Pacific, reflecting varying levels of market maturity and technological adoption.
Ride Hailing Industry Market Size (In Billion)
The future of the ride-hailing industry hinges on several key developments. Further advancements in autonomous vehicle technology promise to revolutionize the sector, potentially leading to improved safety, reduced operational costs, and increased efficiency. The integration of alternative fuel sources, such as hydrogen and biofuels, in addition to the growing electric vehicle segment, will be critical in addressing environmental concerns. Expansion into emerging markets in developing countries presents lucrative opportunities for growth, while navigating unique regulatory frameworks and infrastructural challenges in these regions will be crucial. The sustained focus on improving customer safety and driver welfare, coupled with enhanced data analytics to personalize the user experience and optimize operations, will be critical factors in shaping the industry's trajectory in the coming years.
Ride Hailing Industry Company Market Share
Ride Hailing Industry Market Report: 2019-2033
This comprehensive report provides an in-depth analysis of the global ride-hailing industry, covering market size, growth drivers, competitive landscape, and future outlook from 2019 to 2033. With a focus on key players like Uber, Didi Chuxing, and Lyft, this report is an essential resource for industry professionals, investors, and strategists seeking actionable insights into this rapidly evolving sector. The report leverages a robust dataset and incorporates recent industry developments, providing a clear picture of the current market and its projected trajectory. The total market value is expected to reach xx Million by 2033.
Ride Hailing Industry Market Structure & Innovation Trends
The ride-hailing market is characterized by high competition, with a few dominant players controlling significant market share. Uber and Didi Chuxing hold leading positions globally, while regional players like Grab and Ola dominate specific geographic areas. Market concentration is expected to remain high in the forecast period. Innovation is driven by technological advancements in autonomous driving, electric vehicles, and mobile application functionalities. Regulatory frameworks vary widely across countries, impacting market entry and operations. Substitute services include traditional taxis, public transportation, and personal vehicle ownership. End-user demographics encompass a broad spectrum of age groups and income levels. M&A activity has been significant, with deals focused on expanding geographic reach, technological capabilities, and service offerings. Deal values have ranged from tens to hundreds of Millions of dollars.
- Market Share (2024 Estimate): Uber: xx%, Didi Chuxing: xx%, Others: xx%
- M&A Activity (2019-2024): xx deals valued at over xx Million.
- Key Innovation Drivers: Autonomous vehicles, Electric Vehicles (EVs), Enhanced mobile app features.
Ride Hailing Industry Market Dynamics & Trends
The ride-hailing market is experiencing robust growth, driven by increasing urbanization, rising disposable incomes, and the convenience offered by on-demand transportation services. Technological advancements such as the development of autonomous vehicles and ride-sharing platforms are disrupting the industry, while the increasing adoption of electric vehicles is further contributing to growth. Consumer preferences are shifting towards more affordable, sustainable, and convenient transportation options. The competitive dynamics are intense, with companies vying for market share through pricing strategies, technological innovation, and strategic partnerships. The Compound Annual Growth Rate (CAGR) for the period 2025-2033 is projected to be xx%, with market penetration expected to reach xx% by 2033.
Dominant Regions & Segments in Ride Hailing Industry
Asia is currently the dominant region, driven by high population density, rapid urbanization, and increasing smartphone penetration. Within Asia, countries like China and India are key markets.
- By Vehicle Type:
- Cars: This remains the dominant segment, representing xx% of the market in 2024. Growth is driven by affordability and widespread availability.
- Motorcycles: Strong in specific regions (e.g., Southeast Asia), this segment holds xx% of the market.
- Vans & Buses: These segments are experiencing growth due to increased demand for group transportation and logistics solutions.
- By Propulsion Type:
- Internal Combustion Engine (ICE): This currently dominates but is projected to decline in market share due to environmental concerns and government regulations.
- Electric: This segment is growing rapidly, driven by government incentives and increased consumer demand for eco-friendly transportation. The market share of EVs is projected to reach xx% by 2033.
- Key Drivers: Favorable government policies, Expanding urban infrastructure, Increasing smartphone penetration.
Ride Hailing Industry Product Innovations
The ride-hailing industry is characterized by continuous product innovation. Key developments include advancements in ride-sharing technology, integration of autonomous driving capabilities, and the expansion of service offerings beyond point-to-point transportation, including delivery and logistics services. The focus on enhanced user experience, including improved safety features and seamless payment options, is crucial for maintaining a competitive edge. The market fit for these innovations is driven by consumer demand for convenience, safety, and affordability.
Report Scope & Segmentation Analysis
This report segments the ride-hailing market by vehicle type (motorcycles, cars, vans, buses) and propulsion type (ICE, electric). Each segment is analyzed in terms of its market size, growth rate, and competitive dynamics. For example, the car segment is expected to maintain its dominance, while the electric vehicle segment will experience significant growth. The motorcycle segment will continue to thrive in specific regions. The van and bus segments will experience growth, particularly in the area of on-demand transport for groups and logistics. The overall market size is projected to reach xx Million by 2033.
Key Drivers of Ride Hailing Industry Growth
The growth of the ride-hailing industry is fueled by several key factors: increasing urbanization and population density, rising disposable incomes in emerging economies, advancement in technology particularly in ride-sharing platforms and autonomous driving, and supportive government regulations in some regions. The convenience and affordability offered by ride-hailing services compared to traditional taxis and personal vehicle ownership are also major factors.
Challenges in the Ride Hailing Industry Sector
The ride-hailing industry faces several challenges including intense competition, stringent regulations varying across different countries, and fluctuations in fuel prices significantly impacting operational costs. Driver shortages, safety concerns, and negative publicity related to accidents can also hinder growth. These factors cumulatively contribute to a reduction in profit margins.
Emerging Opportunities in Ride Hailing Industry
Emerging opportunities include the expansion into new markets particularly in developing countries, the integration of autonomous vehicles, and the development of specialized services for niche markets. Increased partnerships with logistics companies and businesses are also opening new revenue streams. The use of alternative fuel sources, such as electricity and hydrogen, presents a significant opportunity for environmentally conscious companies.
Leading Players in the Ride Hailing Industry Market
Key Developments in Ride Hailing Industry Industry
- December 2023: TH International Limited partnered with DiDi Chuxing for a brand-building campaign.
- March 2024: Waymo launched its free ride-hailing service, Waymo One, in Los Angeles.
- April 2024: The Japanese government legalized private ride-hailing services via apps like Uber and Go.
Future Outlook for Ride Hailing Industry Market
The future of the ride-hailing industry is bright, with continued growth driven by technological advancements, increasing urbanization, and evolving consumer preferences. The integration of autonomous vehicles holds significant potential to revolutionize the industry, improving efficiency and reducing costs. The expansion into new markets and the development of specialized services will continue to create new opportunities for growth. Strategic partnerships and collaborations will become increasingly important for navigating the competitive landscape.
Ride Hailing Industry Segmentation
-
1. Vehicle Type
- 1.1. Motorcycles
- 1.2. Cars
- 1.3. Vans
- 1.4. Buses
-
2. Propulsion Type
- 2.1. Internal Combustion Engine (ICE)
- 2.2. Electric
Ride Hailing Industry Segmentation By Geography
-
1. North America
- 1.1. United States
- 1.2. Canada
- 1.3. Rest of North America
-
2. Europe
- 2.1. Germany
- 2.2. United Kingdom
- 2.3. France
- 2.4. Italy
- 2.5. Rest of Europe
-
3. Asia Pacific
- 3.1. China
- 3.2. India
- 3.3. Japan
- 3.4. South Korea
- 3.5. Rest of Asia Pacific
-
4. Rest of the World
- 4.1. South America
- 4.2. Middle East and Africa
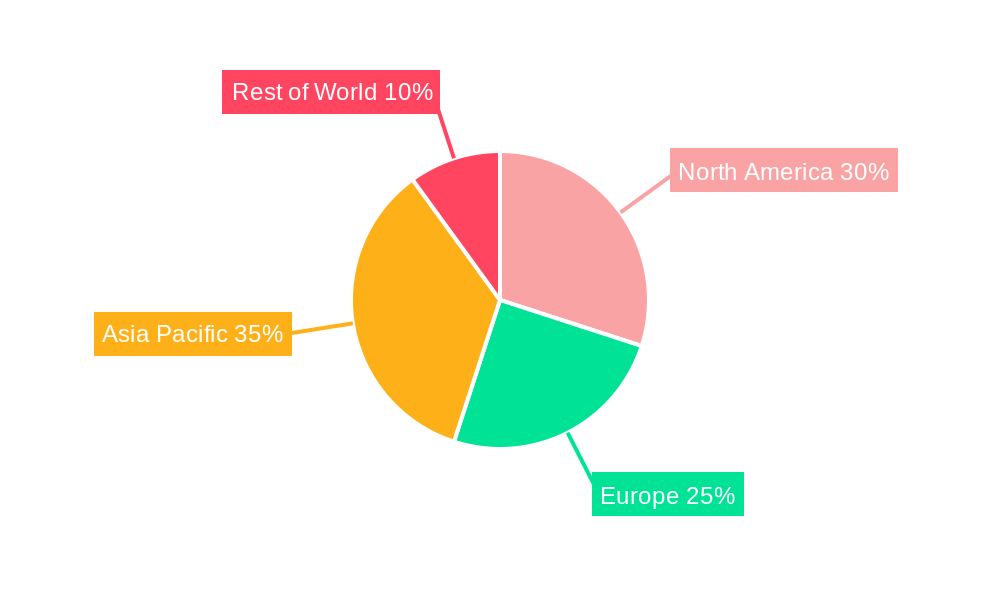
Ride Hailing Industry Regional Market Share
Geographic Coverage of Ride Hailing Industry
Ride Hailing Industry REPORT HIGHLIGHTS
| Aspects | Details |
|---|---|
| Study Period | 2020-2034 |
| Base Year | 2025 |
| Estimated Year | 2026 |
| Forecast Period | 2026-2034 |
| Historical Period | 2020-2025 |
| Growth Rate | CAGR of 9.64% from 2020-2034 |
| Segmentation |
|
Table of Contents
- 1. Introduction
- 1.1. Research Scope
- 1.2. Market Segmentation
- 1.3. Research Objective
- 1.4. Definitions and Assumptions
- 2. Executive Summary
- 2.1. Market Snapshot
- 3. Market Dynamics
- 3.1. Market Drivers
- 3.2. Market Restrains
- 3.3. Market Trends
- 3.4. Market Opportunities
- 4. Market Factor Analysis
- 4.1. Porters Five Forces
- 4.1.1. Bargaining Power of Suppliers
- 4.1.2. Bargaining Power of Buyers
- 4.1.3. Threat of New Entrants
- 4.1.4. Threat of Substitutes
- 4.1.5. Competitive Rivalry
- 4.2. PESTEL analysis
- 4.3. BCG Analysis
- 4.3.1. Stars (High Growth, High Market Share)
- 4.3.2. Cash Cows (Low Growth, High Market Share)
- 4.3.3. Question Mark (High Growth, Low Market Share)
- 4.3.4. Dogs (Low Growth, Low Market Share)
- 4.4. Ansoff Matrix Analysis
- 4.5. Supply Chain Analysis
- 4.6. Regulatory Landscape
- 4.7. Current Market Potential and Opportunity Assessment (TAM–SAM–SOM Framework)
- 4.8. PRI Analyst Note
- 4.1. Porters Five Forces
- 5. Market Analysis, Insights and Forecast 2021-2033
- 5.1. Market Analysis, Insights and Forecast - by Vehicle Type
- 5.1.1. Motorcycles
- 5.1.2. Cars
- 5.1.3. Vans
- 5.1.4. Buses
- 5.2. Market Analysis, Insights and Forecast - by Propulsion Type
- 5.2.1. Internal Combustion Engine (ICE)
- 5.2.2. Electric
- 5.3. Market Analysis, Insights and Forecast - by Region
- 5.3.1. North America
- 5.3.2. Europe
- 5.3.3. Asia Pacific
- 5.3.4. Rest of the World
- 5.1. Market Analysis, Insights and Forecast - by Vehicle Type
- 6. Global Ride Hailing Industry Analysis, Insights and Forecast, 2021-2033
- 6.1. Market Analysis, Insights and Forecast - by Vehicle Type
- 6.1.1. Motorcycles
- 6.1.2. Cars
- 6.1.3. Vans
- 6.1.4. Buses
- 6.2. Market Analysis, Insights and Forecast - by Propulsion Type
- 6.2.1. Internal Combustion Engine (ICE)
- 6.2.2. Electric
- 6.1. Market Analysis, Insights and Forecast - by Vehicle Type
- 7. North America Ride Hailing Industry Analysis, Insights and Forecast, 2020-2032
- 7.1. Market Analysis, Insights and Forecast - by Vehicle Type
- 7.1.1. Motorcycles
- 7.1.2. Cars
- 7.1.3. Vans
- 7.1.4. Buses
- 7.2. Market Analysis, Insights and Forecast - by Propulsion Type
- 7.2.1. Internal Combustion Engine (ICE)
- 7.2.2. Electric
- 7.1. Market Analysis, Insights and Forecast - by Vehicle Type
- 8. Europe Ride Hailing Industry Analysis, Insights and Forecast, 2020-2032
- 8.1. Market Analysis, Insights and Forecast - by Vehicle Type
- 8.1.1. Motorcycles
- 8.1.2. Cars
- 8.1.3. Vans
- 8.1.4. Buses
- 8.2. Market Analysis, Insights and Forecast - by Propulsion Type
- 8.2.1. Internal Combustion Engine (ICE)
- 8.2.2. Electric
- 8.1. Market Analysis, Insights and Forecast - by Vehicle Type
- 9. Asia Pacific Ride Hailing Industry Analysis, Insights and Forecast, 2020-2032
- 9.1. Market Analysis, Insights and Forecast - by Vehicle Type
- 9.1.1. Motorcycles
- 9.1.2. Cars
- 9.1.3. Vans
- 9.1.4. Buses
- 9.2. Market Analysis, Insights and Forecast - by Propulsion Type
- 9.2.1. Internal Combustion Engine (ICE)
- 9.2.2. Electric
- 9.1. Market Analysis, Insights and Forecast - by Vehicle Type
- 10. Rest of the World Ride Hailing Industry Analysis, Insights and Forecast, 2020-2032
- 10.1. Market Analysis, Insights and Forecast - by Vehicle Type
- 10.1.1. Motorcycles
- 10.1.2. Cars
- 10.1.3. Vans
- 10.1.4. Buses
- 10.2. Market Analysis, Insights and Forecast - by Propulsion Type
- 10.2.1. Internal Combustion Engine (ICE)
- 10.2.2. Electric
- 10.1. Market Analysis, Insights and Forecast - by Vehicle Type
- 11. Competitive Analysis
- 11.1. Company Profiles
- 11.1.1 BlaBla Car
- 11.1.1.1. Company Overview
- 11.1.1.2. Products
- 11.1.1.3. Company Financials
- 11.1.1.4. SWOT Analysis
- 11.1.2 Uber Technologies Inc
- 11.1.2.1. Company Overview
- 11.1.2.2. Products
- 11.1.2.3. Company Financials
- 11.1.2.4. SWOT Analysis
- 11.1.3 Didi Chuxing Technology Co
- 11.1.3.1. Company Overview
- 11.1.3.2. Products
- 11.1.3.3. Company Financials
- 11.1.3.4. SWOT Analysis
- 11.1.4 SUOL INNOVATIONS LTD (inDrive
- 11.1.4.1. Company Overview
- 11.1.4.2. Products
- 11.1.4.3. Company Financials
- 11.1.4.4. SWOT Analysis
- 11.1.5 Lyft Inc
- 11.1.5.1. Company Overview
- 11.1.5.2. Products
- 11.1.5.3. Company Financials
- 11.1.5.4. SWOT Analysis
- 11.1.6 Ani Technologies Pvt Ltd (OLA)
- 11.1.6.1. Company Overview
- 11.1.6.2. Products
- 11.1.6.3. Company Financials
- 11.1.6.4. SWOT Analysis
- 11.1.7 Gett Group
- 11.1.7.1. Company Overview
- 11.1.7.2. Products
- 11.1.7.3. Company Financials
- 11.1.7.4. SWOT Analysis
- 11.1.8 Bolt Technology OU
- 11.1.8.1. Company Overview
- 11.1.8.2. Products
- 11.1.8.3. Company Financials
- 11.1.8.4. SWOT Analysis
- 11.1.9 Maxi Mobility SL (Cabify)
- 11.1.9.1. Company Overview
- 11.1.9.2. Products
- 11.1.9.3. Company Financials
- 11.1.9.4. SWOT Analysis
- 11.1.10 GoTo Group (GoJek)
- 11.1.10.1. Company Overview
- 11.1.10.2. Products
- 11.1.10.3. Company Financials
- 11.1.10.4. SWOT Analysis
- 11.1.11 Xanh SM (GSM)
- 11.1.11.1. Company Overview
- 11.1.11.2. Products
- 11.1.11.3. Company Financials
- 11.1.11.4. SWOT Analysis
- 11.1.12 Grab Holdings Inc
- 11.1.12.1. Company Overview
- 11.1.12.2. Products
- 11.1.12.3. Company Financials
- 11.1.12.4. SWOT Analysis
- 11.1.1 BlaBla Car
- 11.2. Market Entropy
- 11.2.1 Company's Key Areas Served
- 11.2.2 Recent Developments
- 11.3. Company Market Share Analysis 2025
- 11.3.1 Top 5 Companies Market Share Analysis
- 11.3.2 Top 3 Companies Market Share Analysis
- 11.4. List of Potential Customers
- 12. Research Methodology
List of Figures
- Figure 1: Global Ride Hailing Industry Revenue Breakdown (Million, %) by Region 2025 & 2033
- Figure 2: North America Ride Hailing Industry Revenue (Million), by Vehicle Type 2025 & 2033
- Figure 3: North America Ride Hailing Industry Revenue Share (%), by Vehicle Type 2025 & 2033
- Figure 4: North America Ride Hailing Industry Revenue (Million), by Propulsion Type 2025 & 2033
- Figure 5: North America Ride Hailing Industry Revenue Share (%), by Propulsion Type 2025 & 2033
- Figure 6: North America Ride Hailing Industry Revenue (Million), by Country 2025 & 2033
- Figure 7: North America Ride Hailing Industry Revenue Share (%), by Country 2025 & 2033
- Figure 8: Europe Ride Hailing Industry Revenue (Million), by Vehicle Type 2025 & 2033
- Figure 9: Europe Ride Hailing Industry Revenue Share (%), by Vehicle Type 2025 & 2033
- Figure 10: Europe Ride Hailing Industry Revenue (Million), by Propulsion Type 2025 & 2033
- Figure 11: Europe Ride Hailing Industry Revenue Share (%), by Propulsion Type 2025 & 2033
- Figure 12: Europe Ride Hailing Industry Revenue (Million), by Country 2025 & 2033
- Figure 13: Europe Ride Hailing Industry Revenue Share (%), by Country 2025 & 2033
- Figure 14: Asia Pacific Ride Hailing Industry Revenue (Million), by Vehicle Type 2025 & 2033
- Figure 15: Asia Pacific Ride Hailing Industry Revenue Share (%), by Vehicle Type 2025 & 2033
- Figure 16: Asia Pacific Ride Hailing Industry Revenue (Million), by Propulsion Type 2025 & 2033
- Figure 17: Asia Pacific Ride Hailing Industry Revenue Share (%), by Propulsion Type 2025 & 2033
- Figure 18: Asia Pacific Ride Hailing Industry Revenue (Million), by Country 2025 & 2033
- Figure 19: Asia Pacific Ride Hailing Industry Revenue Share (%), by Country 2025 & 2033
- Figure 20: Rest of the World Ride Hailing Industry Revenue (Million), by Vehicle Type 2025 & 2033
- Figure 21: Rest of the World Ride Hailing Industry Revenue Share (%), by Vehicle Type 2025 & 2033
- Figure 22: Rest of the World Ride Hailing Industry Revenue (Million), by Propulsion Type 2025 & 2033
- Figure 23: Rest of the World Ride Hailing Industry Revenue Share (%), by Propulsion Type 2025 & 2033
- Figure 24: Rest of the World Ride Hailing Industry Revenue (Million), by Country 2025 & 2033
- Figure 25: Rest of the World Ride Hailing Industry Revenue Share (%), by Country 2025 & 2033
List of Tables
- Table 1: Global Ride Hailing Industry Revenue Million Forecast, by Vehicle Type 2020 & 2033
- Table 2: Global Ride Hailing Industry Revenue Million Forecast, by Propulsion Type 2020 & 2033
- Table 3: Global Ride Hailing Industry Revenue Million Forecast, by Region 2020 & 2033
- Table 4: Global Ride Hailing Industry Revenue Million Forecast, by Vehicle Type 2020 & 2033
- Table 5: Global Ride Hailing Industry Revenue Million Forecast, by Propulsion Type 2020 & 2033
- Table 6: Global Ride Hailing Industry Revenue Million Forecast, by Country 2020 & 2033
- Table 7: United States Ride Hailing Industry Revenue (Million) Forecast, by Application 2020 & 2033
- Table 8: Canada Ride Hailing Industry Revenue (Million) Forecast, by Application 2020 & 2033
- Table 9: Rest of North America Ride Hailing Industry Revenue (Million) Forecast, by Application 2020 & 2033
- Table 10: Global Ride Hailing Industry Revenue Million Forecast, by Vehicle Type 2020 & 2033
- Table 11: Global Ride Hailing Industry Revenue Million Forecast, by Propulsion Type 2020 & 2033
- Table 12: Global Ride Hailing Industry Revenue Million Forecast, by Country 2020 & 2033
- Table 13: Germany Ride Hailing Industry Revenue (Million) Forecast, by Application 2020 & 2033
- Table 14: United Kingdom Ride Hailing Industry Revenue (Million) Forecast, by Application 2020 & 2033
- Table 15: France Ride Hailing Industry Revenue (Million) Forecast, by Application 2020 & 2033
- Table 16: Italy Ride Hailing Industry Revenue (Million) Forecast, by Application 2020 & 2033
- Table 17: Rest of Europe Ride Hailing Industry Revenue (Million) Forecast, by Application 2020 & 2033
- Table 18: Global Ride Hailing Industry Revenue Million Forecast, by Vehicle Type 2020 & 2033
- Table 19: Global Ride Hailing Industry Revenue Million Forecast, by Propulsion Type 2020 & 2033
- Table 20: Global Ride Hailing Industry Revenue Million Forecast, by Country 2020 & 2033
- Table 21: China Ride Hailing Industry Revenue (Million) Forecast, by Application 2020 & 2033
- Table 22: India Ride Hailing Industry Revenue (Million) Forecast, by Application 2020 & 2033
- Table 23: Japan Ride Hailing Industry Revenue (Million) Forecast, by Application 2020 & 2033
- Table 24: South Korea Ride Hailing Industry Revenue (Million) Forecast, by Application 2020 & 2033
- Table 25: Rest of Asia Pacific Ride Hailing Industry Revenue (Million) Forecast, by Application 2020 & 2033
- Table 26: Global Ride Hailing Industry Revenue Million Forecast, by Vehicle Type 2020 & 2033
- Table 27: Global Ride Hailing Industry Revenue Million Forecast, by Propulsion Type 2020 & 2033
- Table 28: Global Ride Hailing Industry Revenue Million Forecast, by Country 2020 & 2033
- Table 29: South America Ride Hailing Industry Revenue (Million) Forecast, by Application 2020 & 2033
- Table 30: Middle East and Africa Ride Hailing Industry Revenue (Million) Forecast, by Application 2020 & 2033
Frequently Asked Questions
1. What is the projected Compound Annual Growth Rate (CAGR) of the Ride Hailing Industry?
The projected CAGR is approximately 9.64%.
2. Which companies are prominent players in the Ride Hailing Industry?
Key companies in the market include BlaBla Car, Uber Technologies Inc, Didi Chuxing Technology Co, SUOL INNOVATIONS LTD (inDrive, Lyft Inc, Ani Technologies Pvt Ltd (OLA), Gett Group, Bolt Technology OU, Maxi Mobility SL (Cabify), GoTo Group (GoJek), Xanh SM (GSM), Grab Holdings Inc.
3. What are the main segments of the Ride Hailing Industry?
The market segments include Vehicle Type, Propulsion Type.
4. Can you provide details about the market size?
The market size is estimated to be USD 185.64 Million as of 2022.
5. What are some drivers contributing to market growth?
Rising Traffic Congestion and Increasing Urban Population to Foster Market Growth.
6. What are the notable trends driving market growth?
The Cars Segment is Expected to Gain Traction During the Forecast Period.
7. Are there any restraints impacting market growth?
Strict Government Regulations and Policies Toward Ride-hailing Services Impact the Market Growth.
8. Can you provide examples of recent developments in the market?
April 2024: The Japanese government implemented the use of private ride-hailing services, which are accessible through mobile applications such as Uber and Go.
9. What pricing options are available for accessing the report?
Pricing options include single-user, multi-user, and enterprise licenses priced at USD 4750, USD 5250, and USD 8750 respectively.
10. Is the market size provided in terms of value or volume?
The market size is provided in terms of value, measured in Million.
11. Are there any specific market keywords associated with the report?
Yes, the market keyword associated with the report is "Ride Hailing Industry," which aids in identifying and referencing the specific market segment covered.
12. How do I determine which pricing option suits my needs best?
The pricing options vary based on user requirements and access needs. Individual users may opt for single-user licenses, while businesses requiring broader access may choose multi-user or enterprise licenses for cost-effective access to the report.
13. Are there any additional resources or data provided in the Ride Hailing Industry report?
While the report offers comprehensive insights, it's advisable to review the specific contents or supplementary materials provided to ascertain if additional resources or data are available.
14. How can I stay updated on further developments or reports in the Ride Hailing Industry?
To stay informed about further developments, trends, and reports in the Ride Hailing Industry, consider subscribing to industry newsletters, following relevant companies and organizations, or regularly checking reputable industry news sources and publications.
Methodology
Step 1 - Identification of Relevant Samples Size from Population Database


Step 2 - Approaches for Defining Global Market Size (Value, Volume* & Price*)

Note*: In applicable scenarios
Step 3 - Data Sources
Primary Research
- Web Analytics
- Survey Reports
- Research Institute
- Latest Research Reports
- Opinion Leaders
Secondary Research
- Annual Reports
- White Paper
- Latest Press Release
- Industry Association
- Paid Database
- Investor Presentations

Step 4 - Data Triangulation
Involves using different sources of information in order to increase the validity of a study
These sources are likely to be stakeholders in a program - participants, other researchers, program staff, other community members, and so on.
Then we put all data in single framework & apply various statistical tools to find out the dynamic on the market.
During the analysis stage, feedback from the stakeholder groups would be compared to determine areas of agreement as well as areas of divergence