

Key Insights
The global Self-Monitoring Blood Glucose (SMBG) strips market is poised for significant expansion, projected to reach $15.53 billion by 2025. Driven by the escalating global prevalence of diabetes, the market is anticipated to grow at a Compound Annual Growth Rate (CAGR) of 8.8% from 2025 to 2033. This robust growth trajectory is underpinned by several key factors: the burgeoning diabetic population, particularly in emerging economies; continuous advancements in SMBG technology, enhancing device accuracy and user-friendliness; and heightened awareness regarding the critical role of regular blood glucose monitoring in effective diabetes management. The competitive arena features established industry leaders such as Roche Diagnostics, Abbott Laboratories, and Medtronic, alongside innovative new entrants. However, the market also navigates challenges including price sensitivity, competition from Continuous Glucose Monitoring (CGM) systems, and evolving regulatory frameworks.
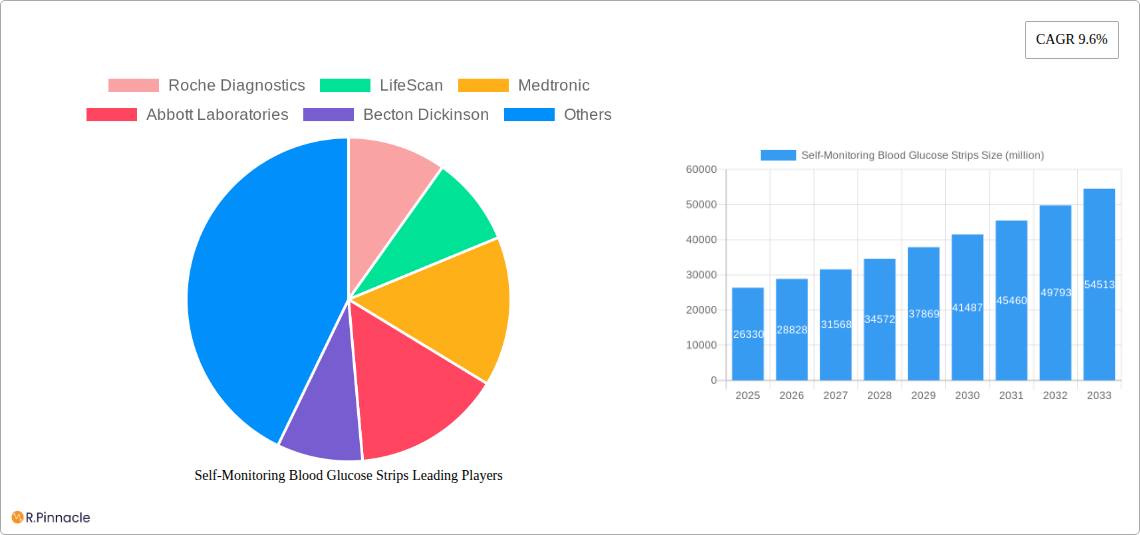
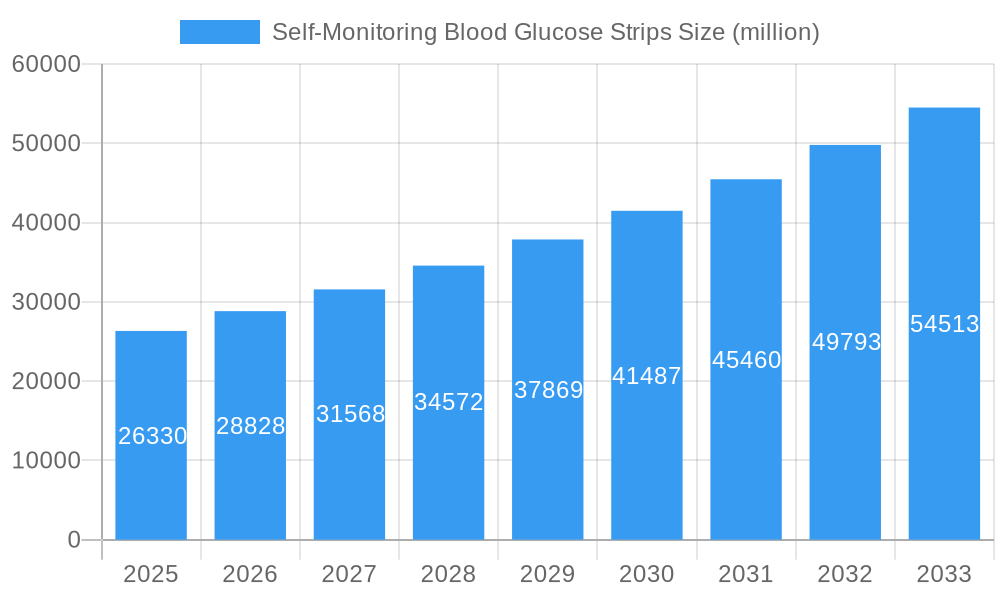
Self-Monitoring Blood Glucose Strips Market Size (In Billion)
Despite the increasing adoption of CGM, SMBG strips maintain a substantial market presence, primarily due to their cost-effectiveness and simplicity, making them ideal for specific demographic segments and less complex diabetes management scenarios. Market segmentation encompasses diverse strip technologies (e.g., electrochemical, optical), distribution channels (retail pharmacies, online, healthcare institutions), and end-user groups (patients, healthcare professionals). Future market dynamics will be shaped by technological innovations focusing on enhanced accuracy, reduced strip size, and seamless integration with smart devices. Furthermore, strategic collaborations between manufacturers and healthcare providers, coupled with comprehensive patient education programs, will be instrumental in steering market evolution. Penetrating underserved regions and developing economical solutions are also pivotal for sustained success within this evolving market.
Self-Monitoring Blood Glucose Strips Company Market Share
Self-Monitoring Blood Glucose Strips Market Report: 2019-2033
This comprehensive report provides an in-depth analysis of the global Self-Monitoring Blood Glucose Strips market, offering invaluable insights for industry professionals, investors, and stakeholders. Covering the period from 2019 to 2033, with a focus on 2025, this report unveils the market's structure, dynamics, dominant players, and future potential. The report leverages extensive data analysis to forecast market growth and identify key trends shaping this vital sector. Millions are used for all values.
Self-Monitoring Blood Glucose Strips Market Structure & Innovation Trends
This section analyzes the competitive landscape of the self-monitoring blood glucose strips market, examining market concentration, innovation drivers, regulatory frameworks, and key industry activities. The report utilizes data from the historical period (2019-2024), base year (2025), and forecast period (2025-2033) to provide a comprehensive overview.
Market Concentration: The market is moderately concentrated, with key players like Roche Diagnostics, LifeScan, Abbott Laboratories, and Medtronic holding significant market share. Precise figures for market share are detailed within the full report. The estimated combined market share of these four players in 2025 is xx%.
Innovation Drivers: Continuous innovation focuses on improving accuracy, ease of use, and cost-effectiveness. Miniaturization, integration with smart devices, and development of less invasive testing methods are key drivers.
Regulatory Frameworks: Stringent regulatory approvals and quality control standards influence market dynamics. The report details specific regulations and their impact on market growth.
Product Substitutes: Continuous glucose monitoring (CGM) systems present a significant alternative, impacting the market share of traditional blood glucose strips.
End-User Demographics: The growing diabetic population, particularly in developing countries, fuels market demand. The report provides a demographic breakdown of end-users.
M&A Activities: The report analyzes significant mergers and acquisitions within the industry, including deal values (in millions) and their impact on market consolidation. For example, xx M&A deals totaling xx million were recorded during the period 2019-2024.
Self-Monitoring Blood Glucose Strips Market Dynamics & Trends
This section delves into the key factors driving market growth, analyzing technological advancements, evolving consumer preferences, and competitive strategies.
The global self-monitoring blood glucose strips market is projected to exhibit a Compound Annual Growth Rate (CAGR) of xx% during the forecast period (2025-2033), driven by several key factors. Rising prevalence of diabetes globally is a primary driver, further amplified by increasing awareness about the importance of regular blood glucose monitoring for effective diabetes management. Technological advancements, such as the development of more accurate, user-friendly, and cost-effective strips, are also contributing to market expansion. The growing adoption of home healthcare and the increasing availability of point-of-care testing devices are also fueling market growth. Furthermore, favorable government initiatives and reimbursement policies in various regions further support the market's expansion. The market penetration of self-monitoring blood glucose strips is expected to reach xx% by 2033. Competitive dynamics, including product innovation, pricing strategies, and distribution networks, significantly influence market growth and share amongst various key players.
Dominant Regions & Segments in Self-Monitoring Blood Glucose Strips
This section identifies leading geographic regions and market segments, analyzing factors contributing to their dominance.
The report identifies [Region Name] as the leading region in the self-monitoring blood glucose strips market. The dominance of this region can be attributed to:
- High Prevalence of Diabetes: A significantly higher prevalence of diabetes compared to other regions.
- Strong Healthcare Infrastructure: Robust healthcare infrastructure, including widespread availability of testing facilities and trained healthcare professionals.
- Favorable Government Policies: Supportive government initiatives promoting diabetes management and access to affordable healthcare.
Detailed analysis of other regions and key market segments is available in the full report.
Self-Monitoring Blood Glucose Strips Product Innovations
The self-monitoring blood glucose strips market is witnessing continuous innovation, with a focus on improving accuracy, convenience, and affordability. Recent advancements include the development of smaller, more precise strips, and integration with smart devices for enhanced data management and remote monitoring capabilities. These advancements improve patient compliance and enable better diabetes management. The market sees ongoing competition to deliver better user experience, faster results, and improved accuracy.
Report Scope & Segmentation Analysis
The report segments the self-monitoring blood glucose strips market by various parameters, including product type, end-user, distribution channel, and region. Each segment's growth projections, market size (in millions), and competitive dynamics are analyzed in detail. Detailed analysis of each segment's growth trajectory and market share in the full report.
Key Drivers of Self-Monitoring Blood Glucose Strips Growth
Several factors drive the growth of the self-monitoring blood glucose strips market. The increasing prevalence of diabetes worldwide is a key driver, along with technological advancements leading to more accurate, convenient, and affordable testing solutions. Favorable government policies and reimbursement programs in several countries further boost market growth. The increasing adoption of home healthcare also contributes to market expansion.
Challenges in the Self-Monitoring Blood Glucose Strips Sector
The self-monitoring blood glucose strips market faces several challenges, including stringent regulatory requirements for product approvals, price competition among manufacturers, and the emergence of alternative technologies like continuous glucose monitoring systems. Supply chain disruptions and fluctuations in raw material prices also pose significant challenges.
Emerging Opportunities in Self-Monitoring Blood Glucose Strips
Despite the challenges, the self-monitoring blood glucose strips market presents several opportunities. The rising prevalence of diabetes in developing countries creates significant untapped market potential. Innovations in strip technology, such as the development of less invasive testing methods, and integration with smart devices, provide further opportunities for growth. Expansion into new markets and the development of cost-effective solutions for low-income populations represent key opportunities.
Leading Players in the Self-Monitoring Blood Glucose Strips Market
- Roche Diagnostics
- LifeScan
- Medtronic
- Abbott Laboratories
- Becton Dickinson
- Beurer
- Animas Corporation
- Bioptik Technology
- DexCom
- GlySens
- Medisana
- Menarini Diagnostics
- Nemaura Medical
- Nipro Diagnostics
- Nova Biomedical
- Owen Mumford
- Senseonics
- TaiDoc Technology
Key Developments in Self-Monitoring Blood Glucose Strips Industry
- [Month, Year]: [Company Name] launched a new self-monitoring blood glucose strip with improved accuracy and ease of use.
- [Month, Year]: [Company Name] announced a strategic partnership to expand its distribution network in [Region].
- [Month, Year]: [Company Name] received regulatory approval for its new self-monitoring blood glucose strip in [Region]. (Further key developments with specific dates and impactful details are included in the full report.)
Future Outlook for Self-Monitoring Blood Glucose Strips Market
The future outlook for the self-monitoring blood glucose strips market remains positive, driven by the continued rise in diabetes prevalence and technological advancements. Opportunities exist for companies to develop innovative products, expand into emerging markets, and leverage strategic partnerships to enhance their market position. The market is expected to experience substantial growth over the forecast period, propelled by technological innovations, supportive regulatory landscapes, and increasing consumer awareness.
Self-Monitoring Blood Glucose Strips Segmentation
-
1. Application
- 1.1. Hospital
- 1.2. Clinic
- 1.3. Household
-
2. Types
- 2.1. Glucose Oxidase
- 2.2. Glucose Dehydrogenase
- 2.3. Other
Self-Monitoring Blood Glucose Strips Segmentation By Geography
-
1. North America
- 1.1. United States
- 1.2. Canada
- 1.3. Mexico
-
2. South America
- 2.1. Brazil
- 2.2. Argentina
- 2.3. Rest of South America
-
3. Europe
- 3.1. United Kingdom
- 3.2. Germany
- 3.3. France
- 3.4. Italy
- 3.5. Spain
- 3.6. Russia
- 3.7. Benelux
- 3.8. Nordics
- 3.9. Rest of Europe
-
4. Middle East & Africa
- 4.1. Turkey
- 4.2. Israel
- 4.3. GCC
- 4.4. North Africa
- 4.5. South Africa
- 4.6. Rest of Middle East & Africa
-
5. Asia Pacific
- 5.1. China
- 5.2. India
- 5.3. Japan
- 5.4. South Korea
- 5.5. ASEAN
- 5.6. Oceania
- 5.7. Rest of Asia Pacific
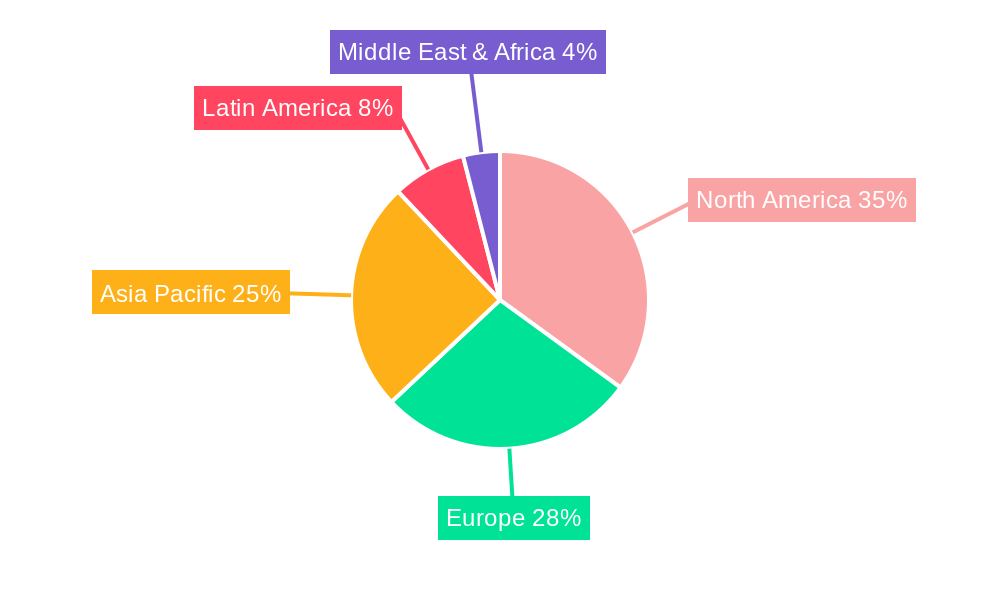
Self-Monitoring Blood Glucose Strips Regional Market Share
Geographic Coverage of Self-Monitoring Blood Glucose Strips
Self-Monitoring Blood Glucose Strips REPORT HIGHLIGHTS
| Aspects | Details |
|---|---|
| Study Period | 2020-2034 |
| Base Year | 2025 |
| Estimated Year | 2026 |
| Forecast Period | 2026-2034 |
| Historical Period | 2020-2025 |
| Growth Rate | CAGR of 8.8% from 2020-2034 |
| Segmentation |
|
Table of Contents
- 1. Introduction
- 1.1. Research Scope
- 1.2. Market Segmentation
- 1.3. Research Objective
- 1.4. Definitions and Assumptions
- 2. Executive Summary
- 2.1. Market Snapshot
- 3. Market Dynamics
- 3.1. Market Drivers
- 3.2. Market Restrains
- 3.3. Market Trends
- 3.4. Market Opportunities
- 4. Market Factor Analysis
- 4.1. Porters Five Forces
- 4.1.1. Bargaining Power of Suppliers
- 4.1.2. Bargaining Power of Buyers
- 4.1.3. Threat of New Entrants
- 4.1.4. Threat of Substitutes
- 4.1.5. Competitive Rivalry
- 4.2. PESTEL analysis
- 4.3. BCG Analysis
- 4.3.1. Stars (High Growth, High Market Share)
- 4.3.2. Cash Cows (Low Growth, High Market Share)
- 4.3.3. Question Mark (High Growth, Low Market Share)
- 4.3.4. Dogs (Low Growth, Low Market Share)
- 4.4. Ansoff Matrix Analysis
- 4.5. Supply Chain Analysis
- 4.6. Regulatory Landscape
- 4.7. Current Market Potential and Opportunity Assessment (TAM–SAM–SOM Framework)
- 4.8. PRI Analyst Note
- 4.1. Porters Five Forces
- 5. Market Analysis, Insights and Forecast 2021-2033
- 5.1. Market Analysis, Insights and Forecast - by Application
- 5.1.1. Hospital
- 5.1.2. Clinic
- 5.1.3. Household
- 5.2. Market Analysis, Insights and Forecast - by Types
- 5.2.1. Glucose Oxidase
- 5.2.2. Glucose Dehydrogenase
- 5.2.3. Other
- 5.3. Market Analysis, Insights and Forecast - by Region
- 5.3.1. North America
- 5.3.2. South America
- 5.3.3. Europe
- 5.3.4. Middle East & Africa
- 5.3.5. Asia Pacific
- 5.1. Market Analysis, Insights and Forecast - by Application
- 6. Global Self-Monitoring Blood Glucose Strips Analysis, Insights and Forecast, 2021-2033
- 6.1. Market Analysis, Insights and Forecast - by Application
- 6.1.1. Hospital
- 6.1.2. Clinic
- 6.1.3. Household
- 6.2. Market Analysis, Insights and Forecast - by Types
- 6.2.1. Glucose Oxidase
- 6.2.2. Glucose Dehydrogenase
- 6.2.3. Other
- 6.1. Market Analysis, Insights and Forecast - by Application
- 7. North America Self-Monitoring Blood Glucose Strips Analysis, Insights and Forecast, 2020-2032
- 7.1. Market Analysis, Insights and Forecast - by Application
- 7.1.1. Hospital
- 7.1.2. Clinic
- 7.1.3. Household
- 7.2. Market Analysis, Insights and Forecast - by Types
- 7.2.1. Glucose Oxidase
- 7.2.2. Glucose Dehydrogenase
- 7.2.3. Other
- 7.1. Market Analysis, Insights and Forecast - by Application
- 8. South America Self-Monitoring Blood Glucose Strips Analysis, Insights and Forecast, 2020-2032
- 8.1. Market Analysis, Insights and Forecast - by Application
- 8.1.1. Hospital
- 8.1.2. Clinic
- 8.1.3. Household
- 8.2. Market Analysis, Insights and Forecast - by Types
- 8.2.1. Glucose Oxidase
- 8.2.2. Glucose Dehydrogenase
- 8.2.3. Other
- 8.1. Market Analysis, Insights and Forecast - by Application
- 9. Europe Self-Monitoring Blood Glucose Strips Analysis, Insights and Forecast, 2020-2032
- 9.1. Market Analysis, Insights and Forecast - by Application
- 9.1.1. Hospital
- 9.1.2. Clinic
- 9.1.3. Household
- 9.2. Market Analysis, Insights and Forecast - by Types
- 9.2.1. Glucose Oxidase
- 9.2.2. Glucose Dehydrogenase
- 9.2.3. Other
- 9.1. Market Analysis, Insights and Forecast - by Application
- 10. Middle East & Africa Self-Monitoring Blood Glucose Strips Analysis, Insights and Forecast, 2020-2032
- 10.1. Market Analysis, Insights and Forecast - by Application
- 10.1.1. Hospital
- 10.1.2. Clinic
- 10.1.3. Household
- 10.2. Market Analysis, Insights and Forecast - by Types
- 10.2.1. Glucose Oxidase
- 10.2.2. Glucose Dehydrogenase
- 10.2.3. Other
- 10.1. Market Analysis, Insights and Forecast - by Application
- 11. Asia Pacific Self-Monitoring Blood Glucose Strips Analysis, Insights and Forecast, 2020-2032
- 11.1. Market Analysis, Insights and Forecast - by Application
- 11.1.1. Hospital
- 11.1.2. Clinic
- 11.1.3. Household
- 11.2. Market Analysis, Insights and Forecast - by Types
- 11.2.1. Glucose Oxidase
- 11.2.2. Glucose Dehydrogenase
- 11.2.3. Other
- 11.1. Market Analysis, Insights and Forecast - by Application
- 12. Competitive Analysis
- 12.1. Company Profiles
- 12.1.1 Roche Diagnostics
- 12.1.1.1. Company Overview
- 12.1.1.2. Products
- 12.1.1.3. Company Financials
- 12.1.1.4. SWOT Analysis
- 12.1.2 LifeScan
- 12.1.2.1. Company Overview
- 12.1.2.2. Products
- 12.1.2.3. Company Financials
- 12.1.2.4. SWOT Analysis
- 12.1.3 Medtronic
- 12.1.3.1. Company Overview
- 12.1.3.2. Products
- 12.1.3.3. Company Financials
- 12.1.3.4. SWOT Analysis
- 12.1.4 Abbott Laboratories
- 12.1.4.1. Company Overview
- 12.1.4.2. Products
- 12.1.4.3. Company Financials
- 12.1.4.4. SWOT Analysis
- 12.1.5 Becton Dickinson
- 12.1.5.1. Company Overview
- 12.1.5.2. Products
- 12.1.5.3. Company Financials
- 12.1.5.4. SWOT Analysis
- 12.1.6 Beurer
- 12.1.6.1. Company Overview
- 12.1.6.2. Products
- 12.1.6.3. Company Financials
- 12.1.6.4. SWOT Analysis
- 12.1.7 Animas Corporation
- 12.1.7.1. Company Overview
- 12.1.7.2. Products
- 12.1.7.3. Company Financials
- 12.1.7.4. SWOT Analysis
- 12.1.8 Bioptik Technology
- 12.1.8.1. Company Overview
- 12.1.8.2. Products
- 12.1.8.3. Company Financials
- 12.1.8.4. SWOT Analysis
- 12.1.9 DexCom
- 12.1.9.1. Company Overview
- 12.1.9.2. Products
- 12.1.9.3. Company Financials
- 12.1.9.4. SWOT Analysis
- 12.1.10 GlySens
- 12.1.10.1. Company Overview
- 12.1.10.2. Products
- 12.1.10.3. Company Financials
- 12.1.10.4. SWOT Analysis
- 12.1.11 Medisana
- 12.1.11.1. Company Overview
- 12.1.11.2. Products
- 12.1.11.3. Company Financials
- 12.1.11.4. SWOT Analysis
- 12.1.12 Menarini Diagnostics
- 12.1.12.1. Company Overview
- 12.1.12.2. Products
- 12.1.12.3. Company Financials
- 12.1.12.4. SWOT Analysis
- 12.1.13 Nemaura Medical
- 12.1.13.1. Company Overview
- 12.1.13.2. Products
- 12.1.13.3. Company Financials
- 12.1.13.4. SWOT Analysis
- 12.1.14 Nipro Diagnostics
- 12.1.14.1. Company Overview
- 12.1.14.2. Products
- 12.1.14.3. Company Financials
- 12.1.14.4. SWOT Analysis
- 12.1.15 Nova Biomedical
- 12.1.15.1. Company Overview
- 12.1.15.2. Products
- 12.1.15.3. Company Financials
- 12.1.15.4. SWOT Analysis
- 12.1.16 Owen Mumford
- 12.1.16.1. Company Overview
- 12.1.16.2. Products
- 12.1.16.3. Company Financials
- 12.1.16.4. SWOT Analysis
- 12.1.17 Senseonics
- 12.1.17.1. Company Overview
- 12.1.17.2. Products
- 12.1.17.3. Company Financials
- 12.1.17.4. SWOT Analysis
- 12.1.18 TaiDoc Technology
- 12.1.18.1. Company Overview
- 12.1.18.2. Products
- 12.1.18.3. Company Financials
- 12.1.18.4. SWOT Analysis
- 12.1.1 Roche Diagnostics
- 12.2. Market Entropy
- 12.2.1 Company's Key Areas Served
- 12.2.2 Recent Developments
- 12.3. Company Market Share Analysis 2025
- 12.3.1 Top 5 Companies Market Share Analysis
- 12.3.2 Top 3 Companies Market Share Analysis
- 12.4. List of Potential Customers
- 13. Research Methodology
List of Figures
- Figure 1: Global Self-Monitoring Blood Glucose Strips Revenue Breakdown (billion, %) by Region 2025 & 2033
- Figure 2: Global Self-Monitoring Blood Glucose Strips Volume Breakdown (K, %) by Region 2025 & 2033
- Figure 3: North America Self-Monitoring Blood Glucose Strips Revenue (billion), by Application 2025 & 2033
- Figure 4: North America Self-Monitoring Blood Glucose Strips Volume (K), by Application 2025 & 2033
- Figure 5: North America Self-Monitoring Blood Glucose Strips Revenue Share (%), by Application 2025 & 2033
- Figure 6: North America Self-Monitoring Blood Glucose Strips Volume Share (%), by Application 2025 & 2033
- Figure 7: North America Self-Monitoring Blood Glucose Strips Revenue (billion), by Types 2025 & 2033
- Figure 8: North America Self-Monitoring Blood Glucose Strips Volume (K), by Types 2025 & 2033
- Figure 9: North America Self-Monitoring Blood Glucose Strips Revenue Share (%), by Types 2025 & 2033
- Figure 10: North America Self-Monitoring Blood Glucose Strips Volume Share (%), by Types 2025 & 2033
- Figure 11: North America Self-Monitoring Blood Glucose Strips Revenue (billion), by Country 2025 & 2033
- Figure 12: North America Self-Monitoring Blood Glucose Strips Volume (K), by Country 2025 & 2033
- Figure 13: North America Self-Monitoring Blood Glucose Strips Revenue Share (%), by Country 2025 & 2033
- Figure 14: North America Self-Monitoring Blood Glucose Strips Volume Share (%), by Country 2025 & 2033
- Figure 15: South America Self-Monitoring Blood Glucose Strips Revenue (billion), by Application 2025 & 2033
- Figure 16: South America Self-Monitoring Blood Glucose Strips Volume (K), by Application 2025 & 2033
- Figure 17: South America Self-Monitoring Blood Glucose Strips Revenue Share (%), by Application 2025 & 2033
- Figure 18: South America Self-Monitoring Blood Glucose Strips Volume Share (%), by Application 2025 & 2033
- Figure 19: South America Self-Monitoring Blood Glucose Strips Revenue (billion), by Types 2025 & 2033
- Figure 20: South America Self-Monitoring Blood Glucose Strips Volume (K), by Types 2025 & 2033
- Figure 21: South America Self-Monitoring Blood Glucose Strips Revenue Share (%), by Types 2025 & 2033
- Figure 22: South America Self-Monitoring Blood Glucose Strips Volume Share (%), by Types 2025 & 2033
- Figure 23: South America Self-Monitoring Blood Glucose Strips Revenue (billion), by Country 2025 & 2033
- Figure 24: South America Self-Monitoring Blood Glucose Strips Volume (K), by Country 2025 & 2033
- Figure 25: South America Self-Monitoring Blood Glucose Strips Revenue Share (%), by Country 2025 & 2033
- Figure 26: South America Self-Monitoring Blood Glucose Strips Volume Share (%), by Country 2025 & 2033
- Figure 27: Europe Self-Monitoring Blood Glucose Strips Revenue (billion), by Application 2025 & 2033
- Figure 28: Europe Self-Monitoring Blood Glucose Strips Volume (K), by Application 2025 & 2033
- Figure 29: Europe Self-Monitoring Blood Glucose Strips Revenue Share (%), by Application 2025 & 2033
- Figure 30: Europe Self-Monitoring Blood Glucose Strips Volume Share (%), by Application 2025 & 2033
- Figure 31: Europe Self-Monitoring Blood Glucose Strips Revenue (billion), by Types 2025 & 2033
- Figure 32: Europe Self-Monitoring Blood Glucose Strips Volume (K), by Types 2025 & 2033
- Figure 33: Europe Self-Monitoring Blood Glucose Strips Revenue Share (%), by Types 2025 & 2033
- Figure 34: Europe Self-Monitoring Blood Glucose Strips Volume Share (%), by Types 2025 & 2033
- Figure 35: Europe Self-Monitoring Blood Glucose Strips Revenue (billion), by Country 2025 & 2033
- Figure 36: Europe Self-Monitoring Blood Glucose Strips Volume (K), by Country 2025 & 2033
- Figure 37: Europe Self-Monitoring Blood Glucose Strips Revenue Share (%), by Country 2025 & 2033
- Figure 38: Europe Self-Monitoring Blood Glucose Strips Volume Share (%), by Country 2025 & 2033
- Figure 39: Middle East & Africa Self-Monitoring Blood Glucose Strips Revenue (billion), by Application 2025 & 2033
- Figure 40: Middle East & Africa Self-Monitoring Blood Glucose Strips Volume (K), by Application 2025 & 2033
- Figure 41: Middle East & Africa Self-Monitoring Blood Glucose Strips Revenue Share (%), by Application 2025 & 2033
- Figure 42: Middle East & Africa Self-Monitoring Blood Glucose Strips Volume Share (%), by Application 2025 & 2033
- Figure 43: Middle East & Africa Self-Monitoring Blood Glucose Strips Revenue (billion), by Types 2025 & 2033
- Figure 44: Middle East & Africa Self-Monitoring Blood Glucose Strips Volume (K), by Types 2025 & 2033
- Figure 45: Middle East & Africa Self-Monitoring Blood Glucose Strips Revenue Share (%), by Types 2025 & 2033
- Figure 46: Middle East & Africa Self-Monitoring Blood Glucose Strips Volume Share (%), by Types 2025 & 2033
- Figure 47: Middle East & Africa Self-Monitoring Blood Glucose Strips Revenue (billion), by Country 2025 & 2033
- Figure 48: Middle East & Africa Self-Monitoring Blood Glucose Strips Volume (K), by Country 2025 & 2033
- Figure 49: Middle East & Africa Self-Monitoring Blood Glucose Strips Revenue Share (%), by Country 2025 & 2033
- Figure 50: Middle East & Africa Self-Monitoring Blood Glucose Strips Volume Share (%), by Country 2025 & 2033
- Figure 51: Asia Pacific Self-Monitoring Blood Glucose Strips Revenue (billion), by Application 2025 & 2033
- Figure 52: Asia Pacific Self-Monitoring Blood Glucose Strips Volume (K), by Application 2025 & 2033
- Figure 53: Asia Pacific Self-Monitoring Blood Glucose Strips Revenue Share (%), by Application 2025 & 2033
- Figure 54: Asia Pacific Self-Monitoring Blood Glucose Strips Volume Share (%), by Application 2025 & 2033
- Figure 55: Asia Pacific Self-Monitoring Blood Glucose Strips Revenue (billion), by Types 2025 & 2033
- Figure 56: Asia Pacific Self-Monitoring Blood Glucose Strips Volume (K), by Types 2025 & 2033
- Figure 57: Asia Pacific Self-Monitoring Blood Glucose Strips Revenue Share (%), by Types 2025 & 2033
- Figure 58: Asia Pacific Self-Monitoring Blood Glucose Strips Volume Share (%), by Types 2025 & 2033
- Figure 59: Asia Pacific Self-Monitoring Blood Glucose Strips Revenue (billion), by Country 2025 & 2033
- Figure 60: Asia Pacific Self-Monitoring Blood Glucose Strips Volume (K), by Country 2025 & 2033
- Figure 61: Asia Pacific Self-Monitoring Blood Glucose Strips Revenue Share (%), by Country 2025 & 2033
- Figure 62: Asia Pacific Self-Monitoring Blood Glucose Strips Volume Share (%), by Country 2025 & 2033
List of Tables
- Table 1: Global Self-Monitoring Blood Glucose Strips Revenue billion Forecast, by Application 2020 & 2033
- Table 2: Global Self-Monitoring Blood Glucose Strips Volume K Forecast, by Application 2020 & 2033
- Table 3: Global Self-Monitoring Blood Glucose Strips Revenue billion Forecast, by Types 2020 & 2033
- Table 4: Global Self-Monitoring Blood Glucose Strips Volume K Forecast, by Types 2020 & 2033
- Table 5: Global Self-Monitoring Blood Glucose Strips Revenue billion Forecast, by Region 2020 & 2033
- Table 6: Global Self-Monitoring Blood Glucose Strips Volume K Forecast, by Region 2020 & 2033
- Table 7: Global Self-Monitoring Blood Glucose Strips Revenue billion Forecast, by Application 2020 & 2033
- Table 8: Global Self-Monitoring Blood Glucose Strips Volume K Forecast, by Application 2020 & 2033
- Table 9: Global Self-Monitoring Blood Glucose Strips Revenue billion Forecast, by Types 2020 & 2033
- Table 10: Global Self-Monitoring Blood Glucose Strips Volume K Forecast, by Types 2020 & 2033
- Table 11: Global Self-Monitoring Blood Glucose Strips Revenue billion Forecast, by Country 2020 & 2033
- Table 12: Global Self-Monitoring Blood Glucose Strips Volume K Forecast, by Country 2020 & 2033
- Table 13: United States Self-Monitoring Blood Glucose Strips Revenue (billion) Forecast, by Application 2020 & 2033
- Table 14: United States Self-Monitoring Blood Glucose Strips Volume (K) Forecast, by Application 2020 & 2033
- Table 15: Canada Self-Monitoring Blood Glucose Strips Revenue (billion) Forecast, by Application 2020 & 2033
- Table 16: Canada Self-Monitoring Blood Glucose Strips Volume (K) Forecast, by Application 2020 & 2033
- Table 17: Mexico Self-Monitoring Blood Glucose Strips Revenue (billion) Forecast, by Application 2020 & 2033
- Table 18: Mexico Self-Monitoring Blood Glucose Strips Volume (K) Forecast, by Application 2020 & 2033
- Table 19: Global Self-Monitoring Blood Glucose Strips Revenue billion Forecast, by Application 2020 & 2033
- Table 20: Global Self-Monitoring Blood Glucose Strips Volume K Forecast, by Application 2020 & 2033
- Table 21: Global Self-Monitoring Blood Glucose Strips Revenue billion Forecast, by Types 2020 & 2033
- Table 22: Global Self-Monitoring Blood Glucose Strips Volume K Forecast, by Types 2020 & 2033
- Table 23: Global Self-Monitoring Blood Glucose Strips Revenue billion Forecast, by Country 2020 & 2033
- Table 24: Global Self-Monitoring Blood Glucose Strips Volume K Forecast, by Country 2020 & 2033
- Table 25: Brazil Self-Monitoring Blood Glucose Strips Revenue (billion) Forecast, by Application 2020 & 2033
- Table 26: Brazil Self-Monitoring Blood Glucose Strips Volume (K) Forecast, by Application 2020 & 2033
- Table 27: Argentina Self-Monitoring Blood Glucose Strips Revenue (billion) Forecast, by Application 2020 & 2033
- Table 28: Argentina Self-Monitoring Blood Glucose Strips Volume (K) Forecast, by Application 2020 & 2033
- Table 29: Rest of South America Self-Monitoring Blood Glucose Strips Revenue (billion) Forecast, by Application 2020 & 2033
- Table 30: Rest of South America Self-Monitoring Blood Glucose Strips Volume (K) Forecast, by Application 2020 & 2033
- Table 31: Global Self-Monitoring Blood Glucose Strips Revenue billion Forecast, by Application 2020 & 2033
- Table 32: Global Self-Monitoring Blood Glucose Strips Volume K Forecast, by Application 2020 & 2033
- Table 33: Global Self-Monitoring Blood Glucose Strips Revenue billion Forecast, by Types 2020 & 2033
- Table 34: Global Self-Monitoring Blood Glucose Strips Volume K Forecast, by Types 2020 & 2033
- Table 35: Global Self-Monitoring Blood Glucose Strips Revenue billion Forecast, by Country 2020 & 2033
- Table 36: Global Self-Monitoring Blood Glucose Strips Volume K Forecast, by Country 2020 & 2033
- Table 37: United Kingdom Self-Monitoring Blood Glucose Strips Revenue (billion) Forecast, by Application 2020 & 2033
- Table 38: United Kingdom Self-Monitoring Blood Glucose Strips Volume (K) Forecast, by Application 2020 & 2033
- Table 39: Germany Self-Monitoring Blood Glucose Strips Revenue (billion) Forecast, by Application 2020 & 2033
- Table 40: Germany Self-Monitoring Blood Glucose Strips Volume (K) Forecast, by Application 2020 & 2033
- Table 41: France Self-Monitoring Blood Glucose Strips Revenue (billion) Forecast, by Application 2020 & 2033
- Table 42: France Self-Monitoring Blood Glucose Strips Volume (K) Forecast, by Application 2020 & 2033
- Table 43: Italy Self-Monitoring Blood Glucose Strips Revenue (billion) Forecast, by Application 2020 & 2033
- Table 44: Italy Self-Monitoring Blood Glucose Strips Volume (K) Forecast, by Application 2020 & 2033
- Table 45: Spain Self-Monitoring Blood Glucose Strips Revenue (billion) Forecast, by Application 2020 & 2033
- Table 46: Spain Self-Monitoring Blood Glucose Strips Volume (K) Forecast, by Application 2020 & 2033
- Table 47: Russia Self-Monitoring Blood Glucose Strips Revenue (billion) Forecast, by Application 2020 & 2033
- Table 48: Russia Self-Monitoring Blood Glucose Strips Volume (K) Forecast, by Application 2020 & 2033
- Table 49: Benelux Self-Monitoring Blood Glucose Strips Revenue (billion) Forecast, by Application 2020 & 2033
- Table 50: Benelux Self-Monitoring Blood Glucose Strips Volume (K) Forecast, by Application 2020 & 2033
- Table 51: Nordics Self-Monitoring Blood Glucose Strips Revenue (billion) Forecast, by Application 2020 & 2033
- Table 52: Nordics Self-Monitoring Blood Glucose Strips Volume (K) Forecast, by Application 2020 & 2033
- Table 53: Rest of Europe Self-Monitoring Blood Glucose Strips Revenue (billion) Forecast, by Application 2020 & 2033
- Table 54: Rest of Europe Self-Monitoring Blood Glucose Strips Volume (K) Forecast, by Application 2020 & 2033
- Table 55: Global Self-Monitoring Blood Glucose Strips Revenue billion Forecast, by Application 2020 & 2033
- Table 56: Global Self-Monitoring Blood Glucose Strips Volume K Forecast, by Application 2020 & 2033
- Table 57: Global Self-Monitoring Blood Glucose Strips Revenue billion Forecast, by Types 2020 & 2033
- Table 58: Global Self-Monitoring Blood Glucose Strips Volume K Forecast, by Types 2020 & 2033
- Table 59: Global Self-Monitoring Blood Glucose Strips Revenue billion Forecast, by Country 2020 & 2033
- Table 60: Global Self-Monitoring Blood Glucose Strips Volume K Forecast, by Country 2020 & 2033
- Table 61: Turkey Self-Monitoring Blood Glucose Strips Revenue (billion) Forecast, by Application 2020 & 2033
- Table 62: Turkey Self-Monitoring Blood Glucose Strips Volume (K) Forecast, by Application 2020 & 2033
- Table 63: Israel Self-Monitoring Blood Glucose Strips Revenue (billion) Forecast, by Application 2020 & 2033
- Table 64: Israel Self-Monitoring Blood Glucose Strips Volume (K) Forecast, by Application 2020 & 2033
- Table 65: GCC Self-Monitoring Blood Glucose Strips Revenue (billion) Forecast, by Application 2020 & 2033
- Table 66: GCC Self-Monitoring Blood Glucose Strips Volume (K) Forecast, by Application 2020 & 2033
- Table 67: North Africa Self-Monitoring Blood Glucose Strips Revenue (billion) Forecast, by Application 2020 & 2033
- Table 68: North Africa Self-Monitoring Blood Glucose Strips Volume (K) Forecast, by Application 2020 & 2033
- Table 69: South Africa Self-Monitoring Blood Glucose Strips Revenue (billion) Forecast, by Application 2020 & 2033
- Table 70: South Africa Self-Monitoring Blood Glucose Strips Volume (K) Forecast, by Application 2020 & 2033
- Table 71: Rest of Middle East & Africa Self-Monitoring Blood Glucose Strips Revenue (billion) Forecast, by Application 2020 & 2033
- Table 72: Rest of Middle East & Africa Self-Monitoring Blood Glucose Strips Volume (K) Forecast, by Application 2020 & 2033
- Table 73: Global Self-Monitoring Blood Glucose Strips Revenue billion Forecast, by Application 2020 & 2033
- Table 74: Global Self-Monitoring Blood Glucose Strips Volume K Forecast, by Application 2020 & 2033
- Table 75: Global Self-Monitoring Blood Glucose Strips Revenue billion Forecast, by Types 2020 & 2033
- Table 76: Global Self-Monitoring Blood Glucose Strips Volume K Forecast, by Types 2020 & 2033
- Table 77: Global Self-Monitoring Blood Glucose Strips Revenue billion Forecast, by Country 2020 & 2033
- Table 78: Global Self-Monitoring Blood Glucose Strips Volume K Forecast, by Country 2020 & 2033
- Table 79: China Self-Monitoring Blood Glucose Strips Revenue (billion) Forecast, by Application 2020 & 2033
- Table 80: China Self-Monitoring Blood Glucose Strips Volume (K) Forecast, by Application 2020 & 2033
- Table 81: India Self-Monitoring Blood Glucose Strips Revenue (billion) Forecast, by Application 2020 & 2033
- Table 82: India Self-Monitoring Blood Glucose Strips Volume (K) Forecast, by Application 2020 & 2033
- Table 83: Japan Self-Monitoring Blood Glucose Strips Revenue (billion) Forecast, by Application 2020 & 2033
- Table 84: Japan Self-Monitoring Blood Glucose Strips Volume (K) Forecast, by Application 2020 & 2033
- Table 85: South Korea Self-Monitoring Blood Glucose Strips Revenue (billion) Forecast, by Application 2020 & 2033
- Table 86: South Korea Self-Monitoring Blood Glucose Strips Volume (K) Forecast, by Application 2020 & 2033
- Table 87: ASEAN Self-Monitoring Blood Glucose Strips Revenue (billion) Forecast, by Application 2020 & 2033
- Table 88: ASEAN Self-Monitoring Blood Glucose Strips Volume (K) Forecast, by Application 2020 & 2033
- Table 89: Oceania Self-Monitoring Blood Glucose Strips Revenue (billion) Forecast, by Application 2020 & 2033
- Table 90: Oceania Self-Monitoring Blood Glucose Strips Volume (K) Forecast, by Application 2020 & 2033
- Table 91: Rest of Asia Pacific Self-Monitoring Blood Glucose Strips Revenue (billion) Forecast, by Application 2020 & 2033
- Table 92: Rest of Asia Pacific Self-Monitoring Blood Glucose Strips Volume (K) Forecast, by Application 2020 & 2033
Frequently Asked Questions
1. What is the projected Compound Annual Growth Rate (CAGR) of the Self-Monitoring Blood Glucose Strips?
The projected CAGR is approximately 8.8%.
2. Which companies are prominent players in the Self-Monitoring Blood Glucose Strips?
Key companies in the market include Roche Diagnostics, LifeScan, Medtronic, Abbott Laboratories, Becton Dickinson, Beurer, Animas Corporation, Bioptik Technology, DexCom, GlySens, Medisana, Menarini Diagnostics, Nemaura Medical, Nipro Diagnostics, Nova Biomedical, Owen Mumford, Senseonics, TaiDoc Technology.
3. What are the main segments of the Self-Monitoring Blood Glucose Strips?
The market segments include Application, Types.
4. Can you provide details about the market size?
The market size is estimated to be USD 15.53 billion as of 2022.
5. What are some drivers contributing to market growth?
N/A
6. What are the notable trends driving market growth?
N/A
7. Are there any restraints impacting market growth?
N/A
8. Can you provide examples of recent developments in the market?
N/A
9. What pricing options are available for accessing the report?
Pricing options include single-user, multi-user, and enterprise licenses priced at USD 3950.00, USD 5925.00, and USD 7900.00 respectively.
10. Is the market size provided in terms of value or volume?
The market size is provided in terms of value, measured in billion and volume, measured in K.
11. Are there any specific market keywords associated with the report?
Yes, the market keyword associated with the report is "Self-Monitoring Blood Glucose Strips," which aids in identifying and referencing the specific market segment covered.
12. How do I determine which pricing option suits my needs best?
The pricing options vary based on user requirements and access needs. Individual users may opt for single-user licenses, while businesses requiring broader access may choose multi-user or enterprise licenses for cost-effective access to the report.
13. Are there any additional resources or data provided in the Self-Monitoring Blood Glucose Strips report?
While the report offers comprehensive insights, it's advisable to review the specific contents or supplementary materials provided to ascertain if additional resources or data are available.
14. How can I stay updated on further developments or reports in the Self-Monitoring Blood Glucose Strips?
To stay informed about further developments, trends, and reports in the Self-Monitoring Blood Glucose Strips, consider subscribing to industry newsletters, following relevant companies and organizations, or regularly checking reputable industry news sources and publications.
Methodology
Step 1 - Identification of Relevant Samples Size from Population Database


Step 2 - Approaches for Defining Global Market Size (Value, Volume* & Price*)

Note*: In applicable scenarios
Step 3 - Data Sources
Primary Research
- Web Analytics
- Survey Reports
- Research Institute
- Latest Research Reports
- Opinion Leaders
Secondary Research
- Annual Reports
- White Paper
- Latest Press Release
- Industry Association
- Paid Database
- Investor Presentations

Step 4 - Data Triangulation
Involves using different sources of information in order to increase the validity of a study
These sources are likely to be stakeholders in a program - participants, other researchers, program staff, other community members, and so on.
Then we put all data in single framework & apply various statistical tools to find out the dynamic on the market.
During the analysis stage, feedback from the stakeholder groups would be compared to determine areas of agreement as well as areas of divergence