

Key Insights
The global Silicon Photonics Components market is poised for substantial expansion, with a projected market size of $2.4 billion in 2025. This robust growth is fueled by an impressive CAGR of 26.9%, indicating a rapidly evolving and highly dynamic industry. The escalating demand for high-speed data transmission, driven by the proliferation of data centers, cloud computing, AI, and 5G infrastructure, serves as a primary catalyst. Silicon photonics technology offers significant advantages over traditional copper-based interconnects, including higher bandwidth, lower power consumption, and miniaturization, making it indispensable for next-generation networking solutions. The continuous innovation in transceiver technologies, particularly the advancements in 100G, 200G, and 400G silicon photonic transceivers, is further accelerating market adoption. These components are crucial for overcoming the bottlenecks in data transfer rates within data centers and enabling more efficient and scalable network architectures.
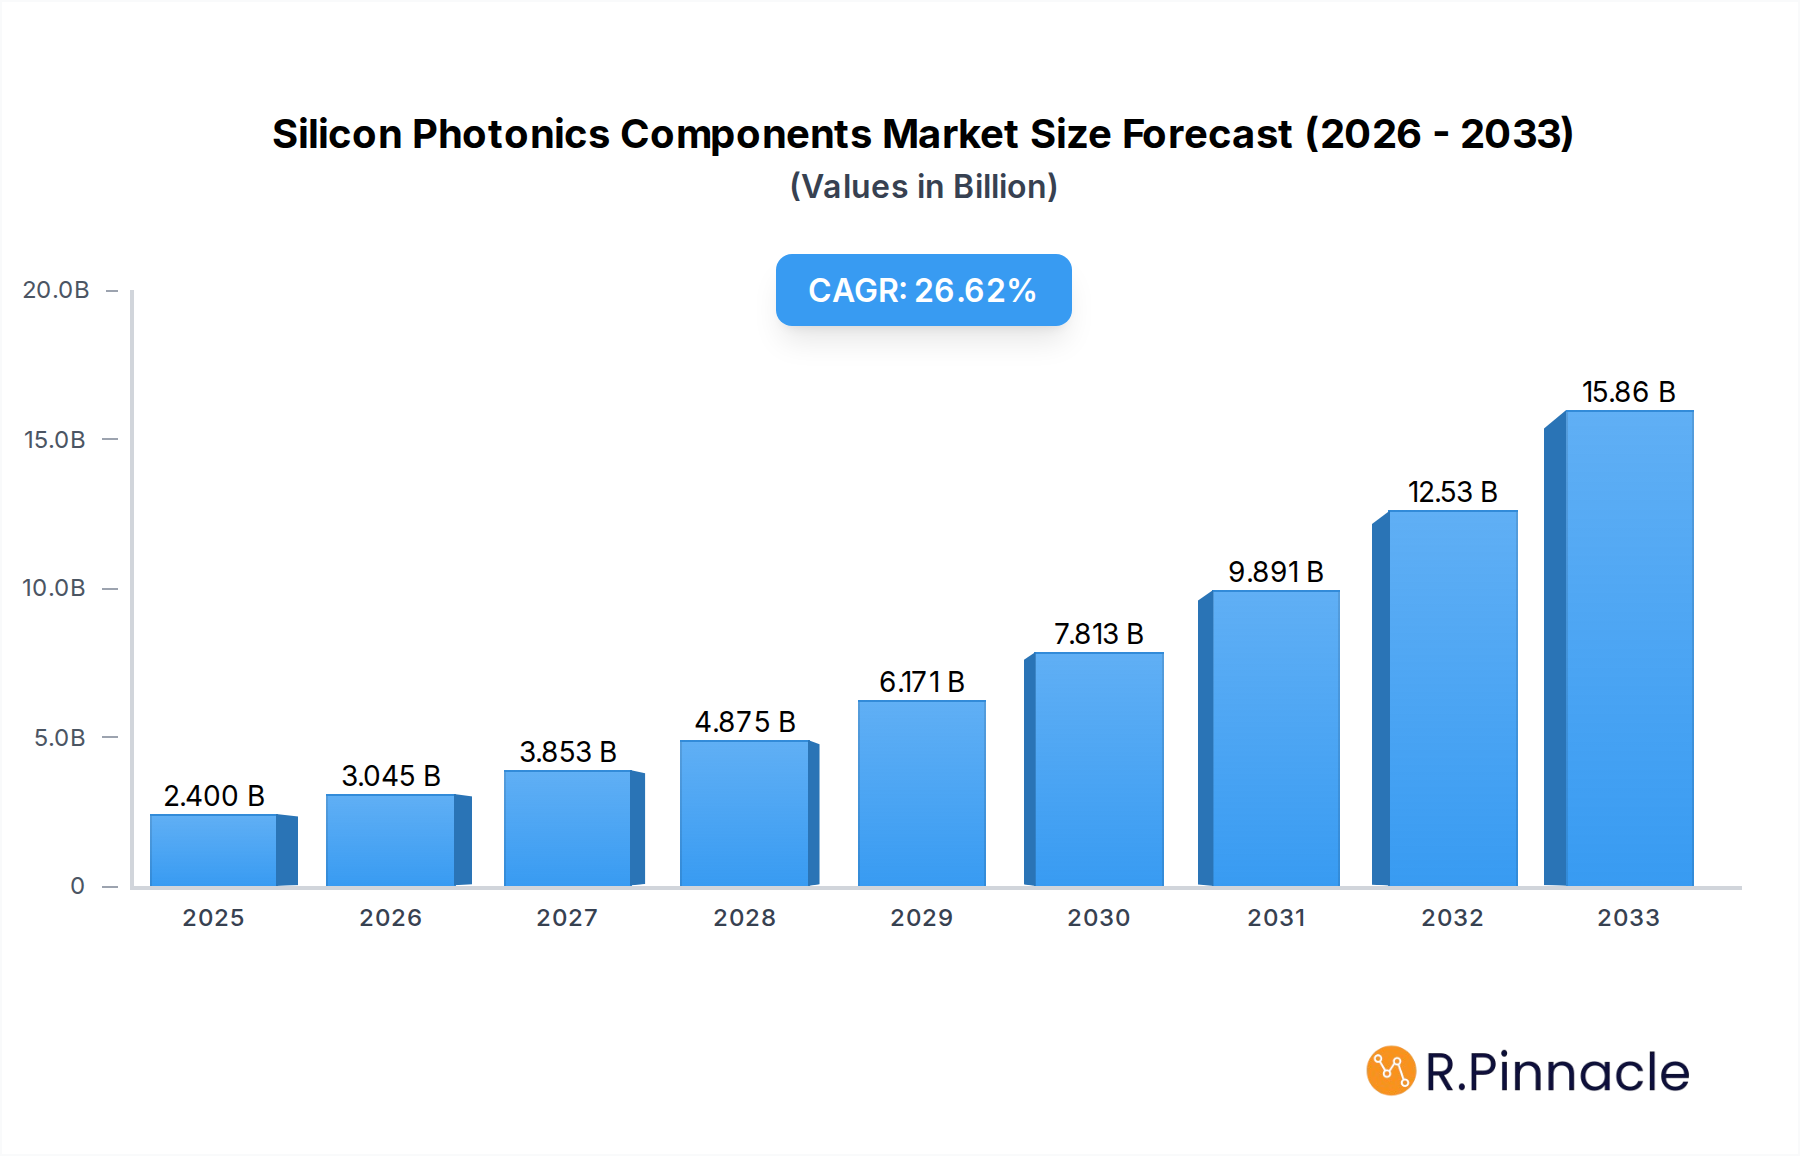
Silicon Photonics Components Market Size (In Billion)
The market is characterized by a strong emphasis on technological advancements and strategic collaborations among key players. While the data center segment represents the dominant application, the non-data center applications, including telecommunications, automotive, and medical imaging, are also showing promising growth trajectories. The forecast period anticipates sustained investment in research and development, leading to the introduction of even more sophisticated silicon photonic solutions. Challenges such as the complexity of manufacturing and the need for specialized expertise are being addressed through strategic partnerships and the development of integrated photonics platforms. Emerging trends like co-packaged optics and optical switching are expected to further diversify and expand the market's scope. The competitive landscape features established technology giants and emerging innovators, all vying to capture market share by delivering high-performance, cost-effective silicon photonics components that meet the ever-increasing demands of the digital economy.

Silicon Photonics Components Company Market Share
This comprehensive report provides an in-depth analysis of the global Silicon Photonics Components market, crucial for understanding the future of high-speed data transmission and optical networking. Leveraging a detailed study period from 2019 to 2033, with a base year of 2025, this report offers actionable insights into market structure, dynamics, regional dominance, product innovations, and key growth drivers. Equip yourself with a billion-dollar understanding of this rapidly evolving industry.
Silicon Photonics Components Market Structure & Innovation Trends
The silicon photonics components market is characterized by a moderately concentrated structure, with a handful of key players dominating significant market share. Innovation is the primary driver, fueled by relentless demand for increased bandwidth and reduced power consumption in data centers and telecommunications. Regulatory frameworks, while evolving, are generally supportive of advancements in optical communication technology. Product substitutes, primarily traditional copper interconnects, are progressively being displaced by silicon photonics solutions in high-performance applications. End-user demographics are increasingly shifting towards hyperscale data centers and enterprise networks demanding greater efficiency. Mergers and acquisitions (M&A) are a significant feature, with substantial M&A deal values indicating consolidation and strategic expansion within the sector. The market share of leading companies is constantly being redefined by their innovation pipeline and manufacturing capabilities.
- Market Concentration: Moderate to high, driven by high R&D investment and manufacturing expertise.
- Innovation Drivers: Exponential data growth, AI/ML workloads, 5G deployment, cloud computing expansion.
- Regulatory Frameworks: Generally conducive to technological advancement, with a focus on standardization.
- Product Substitutes: Limited in high-speed, long-reach applications, but still present in lower-tier connectivity.
- End-User Demographics: Hyperscale cloud providers, telecommunications operators, high-performance computing facilities.
- M&A Activities: Active, with companies acquiring complementary technologies and market access. M&A deal values are projected to reach several billion dollars annually.
Silicon Photonics Components Market Dynamics & Trends
The silicon photonics components market is poised for substantial growth, driven by a confluence of technological advancements and escalating demand for higher data rates. The Compound Annual Growth Rate (CAGR) for this market is projected to be exceptionally strong, likely exceeding 30% over the forecast period. This rapid expansion is fueled by the insatiable appetite for bandwidth in data centers, enabling AI, machine learning, and high-definition video streaming. Technological disruptions, such as advancements in co-packaged optics and on-chip integration, are redefining the competitive landscape, leading to more compact and efficient solutions. Consumer preferences, while indirectly influencing this market, are driven by the demand for seamless, high-speed connectivity across all digital platforms. Competitive dynamics are intensifying, with established semiconductor giants and specialized photonics firms vying for market leadership through continuous innovation and strategic partnerships. Market penetration is steadily increasing as the cost-effectiveness and performance advantages of silicon photonics become more pronounced. The transition from 100G to 200G/400G and beyond is a key trend, pushing the boundaries of optical communication speeds. The inherent scalability of silicon photonics, leveraging existing CMOS manufacturing infrastructure, provides a significant competitive edge. Furthermore, the increasing need for power efficiency in data centers is a major adoption driver, as silicon photonics offers a more energy-efficient alternative to traditional electrical interconnects at higher speeds. The integration of optical components onto silicon chips is reducing complexity and cost, paving the way for wider adoption across various applications. This trend is expected to accelerate over the forecast period.
Dominant Regions & Segments in Silicon Photonics Components
North America is currently the dominant region in the silicon photonics components market, primarily driven by the significant concentration of hyperscale data centers and leading technology companies headquartered in the United States. Economic policies supporting innovation and robust investment in advanced manufacturing infrastructure further bolster this dominance. Within North America, the United States leads in R&D and adoption of cutting-edge silicon photonics technology.
Application Segment Dominance:
Data Center: This segment is the undisputed leader, accounting for the largest market share.
- Key Drivers: Exponential data growth from cloud computing, AI/ML workloads, and video streaming.
- Infrastructure: Massive investments in hyperscale data centers requiring high-bandwidth, low-latency interconnects.
- Technological Advancement: Development of specialized transceivers and optical engines optimized for data center environments.
Non-Data Center: This segment is experiencing rapid growth, though still smaller than the data center segment.
- Key Drivers: 5G network deployment, high-performance computing (HPC), telecommunications infrastructure upgrades, and emerging applications in artificial intelligence hardware.
- Market Penetration: Increasing adoption in metro and long-haul networks, as well as in specialized industrial and defense applications.
Type Segment Dominance:
200G/400G Silicon Photonic Transceiver: This segment is witnessing the most aggressive growth and innovation.
- Demand: Driven by the need for higher speeds to handle increasing data traffic within data centers and between network nodes.
- Technological Maturity: Rapid advancements in silicon photonics enable cost-effective production of these high-performance transceivers.
100G Silicon Photonic Transceiver: While still a significant market, its growth is moderating as the industry transitions to higher speeds.
- Legacy Infrastructure: Continues to be crucial for existing data center and network deployments.
- Cost-Effectiveness: Remains a viable option for certain applications where extreme bandwidth is not paramount.
Others: This segment includes emerging types of silicon photonic components, such as integrated optical sensors, photonic integrated circuits (PICs) for specialized applications, and co-packaged optics.
- Growth Potential: High, driven by novel applications in areas like optical computing, advanced sensing, and modular networking solutions.
The dominance of these segments and regions is shaped by continuous technological innovation, substantial capital investment, and evolving market demands for faster, more efficient, and scalable optical communication solutions.
Silicon Photonics Components Product Innovations
Silicon photonics components are at the forefront of optical communication innovation, enabling unprecedented data transfer rates and energy efficiency. Key product developments include higher-speed transceivers (200G, 400G, 800G, and beyond) with improved reach and reduced power consumption, essential for hyperscale data centers. Advancements in co-packaged optics are integrating photonic components directly onto processor packages, drastically reducing interconnect lengths and latency. Competitive advantages stem from leveraging mature CMOS manufacturing processes, leading to cost scalability and higher integration levels. The ongoing focus is on miniaturization, increased functionality, and lower power footprints.
Report Scope & Segmentation Analysis
This report meticulously analyzes the Silicon Photonics Components market, segmented by Application and Type. The Data Center application segment is projected for robust growth, driven by the insatiable demand for bandwidth to support cloud services, AI, and big data analytics. Its market size is expected to reach several billion dollars by 2033, with a high CAGR. The Non-Data Center segment, encompassing telecommunications, high-performance computing, and emerging applications, also shows promising growth trajectories, albeit from a smaller base.
In terms of Types, the 200G/400G Silicon Photonic Transceiver segment is leading market expansion, fueled by the need for next-generation data transfer speeds. Its market size is set to surge, driven by rapid technological advancements and adoption. The 100G Silicon Photonic Transceiver segment, while mature, continues to hold a significant market share due to existing infrastructure. The Others segment, encompassing novel PICs, co-packaged optics, and specialized components, represents the future of innovation and offers substantial growth potential as new applications emerge. Competitive dynamics within each segment are characterized by intense R&D and strategic collaborations.
Key Drivers of Silicon Photonics Components Growth
The growth of the silicon photonics components market is primarily propelled by several key factors. Firstly, the exponential increase in data traffic, driven by cloud computing, AI/ML, and the proliferation of connected devices, necessitates higher bandwidth solutions. Secondly, the demand for increased energy efficiency in data centers, where power consumption is a major operational cost, makes silicon photonics an attractive alternative to traditional copper interconnects. Thirdly, advancements in fabrication technologies and the leveraging of existing CMOS manufacturing infrastructure are reducing the cost of silicon photonics components, making them more accessible. The deployment of 5G networks also fuels demand for high-speed optical components.
- Technological Factors: Miniaturization, higher integration, co-packaged optics, improved performance.
- Economic Factors: Demand for energy efficiency, cost reduction through CMOS scaling.
- Regulatory Factors: Initiatives promoting faster broadband speeds and digital infrastructure development.
Challenges in the Silicon Photonics Components Sector
Despite its immense potential, the silicon photonics components sector faces several challenges. High research and development costs for novel designs and advanced packaging can be a significant barrier. Supply chain complexities, particularly in securing specialized materials and manufacturing capacity, can impact production timelines and costs. Fierce competition among established players and emerging startups also puts pressure on pricing and market share. Furthermore, the integration of silicon photonics into existing network architectures requires standardization and interoperability efforts, which can slow down widespread adoption. Overcoming these hurdles is crucial for sustained market growth.
- R&D Costs: Significant investment required for innovation and next-generation products.
- Supply Chain Issues: Dependence on specialized materials and manufacturing processes.
- Competitive Pressures: Intense rivalry impacting pricing and market access.
- Standardization: Need for industry-wide agreement on interfaces and protocols.
Emerging Opportunities in Silicon Photonics Components
The silicon photonics components market is ripe with emerging opportunities. The growing demand for optical interconnects in high-performance computing (HPC) for scientific research and AI training presents a significant avenue for growth. The expansion of 5G and future wireless communication technologies will necessitate a robust optical backbone. Furthermore, the burgeoning fields of quantum computing and advanced sensing technologies offer novel applications for silicon photonics. The development of integrated photonic engines for edge computing and the increasing interest in optical engines for artificial intelligence hardware accelerators are also key emerging opportunities.
- High-Performance Computing (HPC): Essential for AI, scientific simulation, and big data analytics.
- 5G and Beyond: Driving demand for faster and more efficient optical infrastructure.
- Quantum Computing & Advanced Sensing: Opening up entirely new application frontiers.
- Edge Computing: Enabling localized, high-speed data processing.
Leading Players in the Silicon Photonics Components Market
- Cisco Systems
- Intel
- MACOM Technology
- GlobalFoundries
- NeoPhotonics
- InPhi
- II-VI
- IBM
- STMicroelectronics
- Rockley Photonics
- Juniper
- FUJITSU
- MELLANOX
- SICOYA
- LUMENTUM
- RANOVUS
Key Developments in Silicon Photonics Components Industry
- 2023: Introduction of 800G silicon photonic transceivers by multiple vendors, enabling higher data rates in data centers.
- 2023: Increased investment in co-packaged optics solutions, promising to revolutionize on-chip interconnectivity.
- 2022/2023: Significant breakthroughs in integrated silicon photonics for lidar applications, opening new markets.
- 2021: Expansion of manufacturing capacity by key foundries to meet growing demand for silicon photonic wafers.
- 2020: Growing adoption of silicon photonics in 5G infrastructure, supporting higher frequencies and bandwidth.
- 2019: Introduction of advanced silicon photonic devices for AI accelerators, enhancing computational efficiency.
Future Outlook for Silicon Photonics Components Market
The future outlook for the silicon photonics components market is exceptionally bright, driven by sustained demand for higher bandwidth, lower power consumption, and increased integration. Continued innovation in transceiver technology, co-packaged optics, and integrated photonic circuits will fuel market expansion across data centers, telecommunications, and emerging applications. Strategic partnerships, acquisitions, and advancements in manufacturing processes will further solidify the market's growth trajectory. The potential for silicon photonics to revolutionize computing, communication, and sensing is immense, positioning it as a critical technology for the digital future.
Silicon Photonics Components Segmentation
-
1. Application
- 1.1. Data Center
- 1.2. Non-Data Center
-
2. Types
- 2.1. 100G Silicon Photonic Transceiver
- 2.2. 200G/400G Silicon Photonic Transceiver
- 2.3. Others
Silicon Photonics Components Segmentation By Geography
-
1. North America
- 1.1. United States
- 1.2. Canada
- 1.3. Mexico
-
2. South America
- 2.1. Brazil
- 2.2. Argentina
- 2.3. Rest of South America
-
3. Europe
- 3.1. United Kingdom
- 3.2. Germany
- 3.3. France
- 3.4. Italy
- 3.5. Spain
- 3.6. Russia
- 3.7. Benelux
- 3.8. Nordics
- 3.9. Rest of Europe
-
4. Middle East & Africa
- 4.1. Turkey
- 4.2. Israel
- 4.3. GCC
- 4.4. North Africa
- 4.5. South Africa
- 4.6. Rest of Middle East & Africa
-
5. Asia Pacific
- 5.1. China
- 5.2. India
- 5.3. Japan
- 5.4. South Korea
- 5.5. ASEAN
- 5.6. Oceania
- 5.7. Rest of Asia Pacific
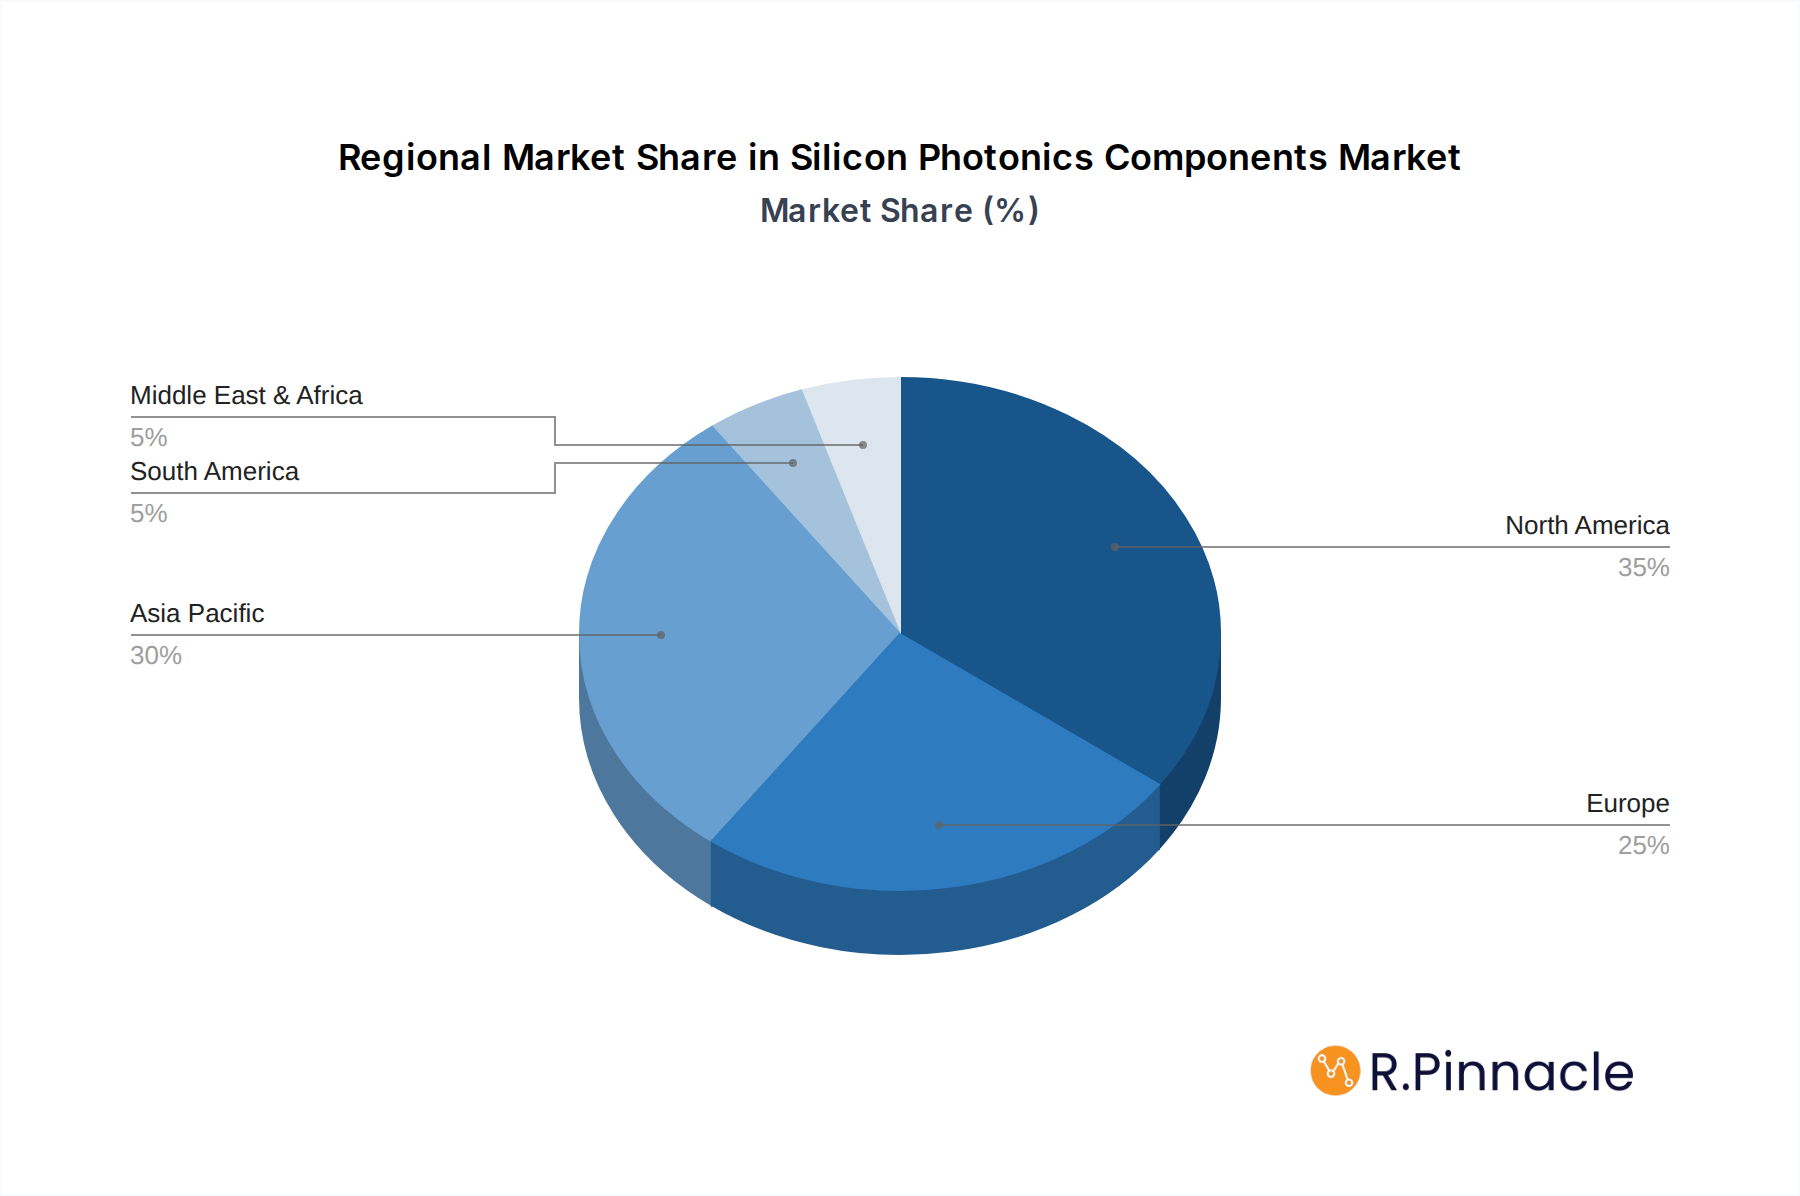
Silicon Photonics Components Regional Market Share
Geographic Coverage of Silicon Photonics Components
Silicon Photonics Components REPORT HIGHLIGHTS
| Aspects | Details |
|---|---|
| Study Period | 2020-2034 |
| Base Year | 2025 |
| Estimated Year | 2026 |
| Forecast Period | 2026-2034 |
| Historical Period | 2020-2025 |
| Growth Rate | CAGR of 26.9% from 2020-2034 |
| Segmentation |
|
Table of Contents
- 1. Introduction
- 1.1. Research Scope
- 1.2. Market Segmentation
- 1.3. Research Methodology
- 1.4. Definitions and Assumptions
- 2. Executive Summary
- 2.1. Introduction
- 3. Market Dynamics
- 3.1. Introduction
- 3.2. Market Drivers
- 3.3. Market Restrains
- 3.4. Market Trends
- 4. Market Factor Analysis
- 4.1. Porters Five Forces
- 4.2. Supply/Value Chain
- 4.3. PESTEL analysis
- 4.4. Market Entropy
- 4.5. Patent/Trademark Analysis
- 5. Global Silicon Photonics Components Analysis, Insights and Forecast, 2020-2032
- 5.1. Market Analysis, Insights and Forecast - by Application
- 5.1.1. Data Center
- 5.1.2. Non-Data Center
- 5.2. Market Analysis, Insights and Forecast - by Types
- 5.2.1. 100G Silicon Photonic Transceiver
- 5.2.2. 200G/400G Silicon Photonic Transceiver
- 5.2.3. Others
- 5.3. Market Analysis, Insights and Forecast - by Region
- 5.3.1. North America
- 5.3.2. South America
- 5.3.3. Europe
- 5.3.4. Middle East & Africa
- 5.3.5. Asia Pacific
- 5.1. Market Analysis, Insights and Forecast - by Application
- 6. North America Silicon Photonics Components Analysis, Insights and Forecast, 2020-2032
- 6.1. Market Analysis, Insights and Forecast - by Application
- 6.1.1. Data Center
- 6.1.2. Non-Data Center
- 6.2. Market Analysis, Insights and Forecast - by Types
- 6.2.1. 100G Silicon Photonic Transceiver
- 6.2.2. 200G/400G Silicon Photonic Transceiver
- 6.2.3. Others
- 6.1. Market Analysis, Insights and Forecast - by Application
- 7. South America Silicon Photonics Components Analysis, Insights and Forecast, 2020-2032
- 7.1. Market Analysis, Insights and Forecast - by Application
- 7.1.1. Data Center
- 7.1.2. Non-Data Center
- 7.2. Market Analysis, Insights and Forecast - by Types
- 7.2.1. 100G Silicon Photonic Transceiver
- 7.2.2. 200G/400G Silicon Photonic Transceiver
- 7.2.3. Others
- 7.1. Market Analysis, Insights and Forecast - by Application
- 8. Europe Silicon Photonics Components Analysis, Insights and Forecast, 2020-2032
- 8.1. Market Analysis, Insights and Forecast - by Application
- 8.1.1. Data Center
- 8.1.2. Non-Data Center
- 8.2. Market Analysis, Insights and Forecast - by Types
- 8.2.1. 100G Silicon Photonic Transceiver
- 8.2.2. 200G/400G Silicon Photonic Transceiver
- 8.2.3. Others
- 8.1. Market Analysis, Insights and Forecast - by Application
- 9. Middle East & Africa Silicon Photonics Components Analysis, Insights and Forecast, 2020-2032
- 9.1. Market Analysis, Insights and Forecast - by Application
- 9.1.1. Data Center
- 9.1.2. Non-Data Center
- 9.2. Market Analysis, Insights and Forecast - by Types
- 9.2.1. 100G Silicon Photonic Transceiver
- 9.2.2. 200G/400G Silicon Photonic Transceiver
- 9.2.3. Others
- 9.1. Market Analysis, Insights and Forecast - by Application
- 10. Asia Pacific Silicon Photonics Components Analysis, Insights and Forecast, 2020-2032
- 10.1. Market Analysis, Insights and Forecast - by Application
- 10.1.1. Data Center
- 10.1.2. Non-Data Center
- 10.2. Market Analysis, Insights and Forecast - by Types
- 10.2.1. 100G Silicon Photonic Transceiver
- 10.2.2. 200G/400G Silicon Photonic Transceiver
- 10.2.3. Others
- 10.1. Market Analysis, Insights and Forecast - by Application
- 11. Competitive Analysis
- 11.1. Global Market Share Analysis 2025
- 11.2. Company Profiles
- 11.2.1 Cisco Systems
- 11.2.1.1. Overview
- 11.2.1.2. Products
- 11.2.1.3. SWOT Analysis
- 11.2.1.4. Recent Developments
- 11.2.1.5. Financials (Based on Availability)
- 11.2.2 Intel
- 11.2.2.1. Overview
- 11.2.2.2. Products
- 11.2.2.3. SWOT Analysis
- 11.2.2.4. Recent Developments
- 11.2.2.5. Financials (Based on Availability)
- 11.2.3 MACOM Technology
- 11.2.3.1. Overview
- 11.2.3.2. Products
- 11.2.3.3. SWOT Analysis
- 11.2.3.4. Recent Developments
- 11.2.3.5. Financials (Based on Availability)
- 11.2.4 GlobalFoundries
- 11.2.4.1. Overview
- 11.2.4.2. Products
- 11.2.4.3. SWOT Analysis
- 11.2.4.4. Recent Developments
- 11.2.4.5. Financials (Based on Availability)
- 11.2.5 NeoPhotonics
- 11.2.5.1. Overview
- 11.2.5.2. Products
- 11.2.5.3. SWOT Analysis
- 11.2.5.4. Recent Developments
- 11.2.5.5. Financials (Based on Availability)
- 11.2.6 InPhi
- 11.2.6.1. Overview
- 11.2.6.2. Products
- 11.2.6.3. SWOT Analysis
- 11.2.6.4. Recent Developments
- 11.2.6.5. Financials (Based on Availability)
- 11.2.7 II-VI
- 11.2.7.1. Overview
- 11.2.7.2. Products
- 11.2.7.3. SWOT Analysis
- 11.2.7.4. Recent Developments
- 11.2.7.5. Financials (Based on Availability)
- 11.2.8 IBM
- 11.2.8.1. Overview
- 11.2.8.2. Products
- 11.2.8.3. SWOT Analysis
- 11.2.8.4. Recent Developments
- 11.2.8.5. Financials (Based on Availability)
- 11.2.9 STMicroelectronics
- 11.2.9.1. Overview
- 11.2.9.2. Products
- 11.2.9.3. SWOT Analysis
- 11.2.9.4. Recent Developments
- 11.2.9.5. Financials (Based on Availability)
- 11.2.10 Rockley Photonics
- 11.2.10.1. Overview
- 11.2.10.2. Products
- 11.2.10.3. SWOT Analysis
- 11.2.10.4. Recent Developments
- 11.2.10.5. Financials (Based on Availability)
- 11.2.11 Juniper
- 11.2.11.1. Overview
- 11.2.11.2. Products
- 11.2.11.3. SWOT Analysis
- 11.2.11.4. Recent Developments
- 11.2.11.5. Financials (Based on Availability)
- 11.2.12 FUJITSU
- 11.2.12.1. Overview
- 11.2.12.2. Products
- 11.2.12.3. SWOT Analysis
- 11.2.12.4. Recent Developments
- 11.2.12.5. Financials (Based on Availability)
- 11.2.13 MELLANOX
- 11.2.13.1. Overview
- 11.2.13.2. Products
- 11.2.13.3. SWOT Analysis
- 11.2.13.4. Recent Developments
- 11.2.13.5. Financials (Based on Availability)
- 11.2.14 SICOYA
- 11.2.14.1. Overview
- 11.2.14.2. Products
- 11.2.14.3. SWOT Analysis
- 11.2.14.4. Recent Developments
- 11.2.14.5. Financials (Based on Availability)
- 11.2.15 LUMENTUM
- 11.2.15.1. Overview
- 11.2.15.2. Products
- 11.2.15.3. SWOT Analysis
- 11.2.15.4. Recent Developments
- 11.2.15.5. Financials (Based on Availability)
- 11.2.16 RANOVUS
- 11.2.16.1. Overview
- 11.2.16.2. Products
- 11.2.16.3. SWOT Analysis
- 11.2.16.4. Recent Developments
- 11.2.16.5. Financials (Based on Availability)
- 11.2.1 Cisco Systems
List of Figures
- Figure 1: Global Silicon Photonics Components Revenue Breakdown (undefined, %) by Region 2025 & 2033
- Figure 2: North America Silicon Photonics Components Revenue (undefined), by Application 2025 & 2033
- Figure 3: North America Silicon Photonics Components Revenue Share (%), by Application 2025 & 2033
- Figure 4: North America Silicon Photonics Components Revenue (undefined), by Types 2025 & 2033
- Figure 5: North America Silicon Photonics Components Revenue Share (%), by Types 2025 & 2033
- Figure 6: North America Silicon Photonics Components Revenue (undefined), by Country 2025 & 2033
- Figure 7: North America Silicon Photonics Components Revenue Share (%), by Country 2025 & 2033
- Figure 8: South America Silicon Photonics Components Revenue (undefined), by Application 2025 & 2033
- Figure 9: South America Silicon Photonics Components Revenue Share (%), by Application 2025 & 2033
- Figure 10: South America Silicon Photonics Components Revenue (undefined), by Types 2025 & 2033
- Figure 11: South America Silicon Photonics Components Revenue Share (%), by Types 2025 & 2033
- Figure 12: South America Silicon Photonics Components Revenue (undefined), by Country 2025 & 2033
- Figure 13: South America Silicon Photonics Components Revenue Share (%), by Country 2025 & 2033
- Figure 14: Europe Silicon Photonics Components Revenue (undefined), by Application 2025 & 2033
- Figure 15: Europe Silicon Photonics Components Revenue Share (%), by Application 2025 & 2033
- Figure 16: Europe Silicon Photonics Components Revenue (undefined), by Types 2025 & 2033
- Figure 17: Europe Silicon Photonics Components Revenue Share (%), by Types 2025 & 2033
- Figure 18: Europe Silicon Photonics Components Revenue (undefined), by Country 2025 & 2033
- Figure 19: Europe Silicon Photonics Components Revenue Share (%), by Country 2025 & 2033
- Figure 20: Middle East & Africa Silicon Photonics Components Revenue (undefined), by Application 2025 & 2033
- Figure 21: Middle East & Africa Silicon Photonics Components Revenue Share (%), by Application 2025 & 2033
- Figure 22: Middle East & Africa Silicon Photonics Components Revenue (undefined), by Types 2025 & 2033
- Figure 23: Middle East & Africa Silicon Photonics Components Revenue Share (%), by Types 2025 & 2033
- Figure 24: Middle East & Africa Silicon Photonics Components Revenue (undefined), by Country 2025 & 2033
- Figure 25: Middle East & Africa Silicon Photonics Components Revenue Share (%), by Country 2025 & 2033
- Figure 26: Asia Pacific Silicon Photonics Components Revenue (undefined), by Application 2025 & 2033
- Figure 27: Asia Pacific Silicon Photonics Components Revenue Share (%), by Application 2025 & 2033
- Figure 28: Asia Pacific Silicon Photonics Components Revenue (undefined), by Types 2025 & 2033
- Figure 29: Asia Pacific Silicon Photonics Components Revenue Share (%), by Types 2025 & 2033
- Figure 30: Asia Pacific Silicon Photonics Components Revenue (undefined), by Country 2025 & 2033
- Figure 31: Asia Pacific Silicon Photonics Components Revenue Share (%), by Country 2025 & 2033
List of Tables
- Table 1: Global Silicon Photonics Components Revenue undefined Forecast, by Application 2020 & 2033
- Table 2: Global Silicon Photonics Components Revenue undefined Forecast, by Types 2020 & 2033
- Table 3: Global Silicon Photonics Components Revenue undefined Forecast, by Region 2020 & 2033
- Table 4: Global Silicon Photonics Components Revenue undefined Forecast, by Application 2020 & 2033
- Table 5: Global Silicon Photonics Components Revenue undefined Forecast, by Types 2020 & 2033
- Table 6: Global Silicon Photonics Components Revenue undefined Forecast, by Country 2020 & 2033
- Table 7: United States Silicon Photonics Components Revenue (undefined) Forecast, by Application 2020 & 2033
- Table 8: Canada Silicon Photonics Components Revenue (undefined) Forecast, by Application 2020 & 2033
- Table 9: Mexico Silicon Photonics Components Revenue (undefined) Forecast, by Application 2020 & 2033
- Table 10: Global Silicon Photonics Components Revenue undefined Forecast, by Application 2020 & 2033
- Table 11: Global Silicon Photonics Components Revenue undefined Forecast, by Types 2020 & 2033
- Table 12: Global Silicon Photonics Components Revenue undefined Forecast, by Country 2020 & 2033
- Table 13: Brazil Silicon Photonics Components Revenue (undefined) Forecast, by Application 2020 & 2033
- Table 14: Argentina Silicon Photonics Components Revenue (undefined) Forecast, by Application 2020 & 2033
- Table 15: Rest of South America Silicon Photonics Components Revenue (undefined) Forecast, by Application 2020 & 2033
- Table 16: Global Silicon Photonics Components Revenue undefined Forecast, by Application 2020 & 2033
- Table 17: Global Silicon Photonics Components Revenue undefined Forecast, by Types 2020 & 2033
- Table 18: Global Silicon Photonics Components Revenue undefined Forecast, by Country 2020 & 2033
- Table 19: United Kingdom Silicon Photonics Components Revenue (undefined) Forecast, by Application 2020 & 2033
- Table 20: Germany Silicon Photonics Components Revenue (undefined) Forecast, by Application 2020 & 2033
- Table 21: France Silicon Photonics Components Revenue (undefined) Forecast, by Application 2020 & 2033
- Table 22: Italy Silicon Photonics Components Revenue (undefined) Forecast, by Application 2020 & 2033
- Table 23: Spain Silicon Photonics Components Revenue (undefined) Forecast, by Application 2020 & 2033
- Table 24: Russia Silicon Photonics Components Revenue (undefined) Forecast, by Application 2020 & 2033
- Table 25: Benelux Silicon Photonics Components Revenue (undefined) Forecast, by Application 2020 & 2033
- Table 26: Nordics Silicon Photonics Components Revenue (undefined) Forecast, by Application 2020 & 2033
- Table 27: Rest of Europe Silicon Photonics Components Revenue (undefined) Forecast, by Application 2020 & 2033
- Table 28: Global Silicon Photonics Components Revenue undefined Forecast, by Application 2020 & 2033
- Table 29: Global Silicon Photonics Components Revenue undefined Forecast, by Types 2020 & 2033
- Table 30: Global Silicon Photonics Components Revenue undefined Forecast, by Country 2020 & 2033
- Table 31: Turkey Silicon Photonics Components Revenue (undefined) Forecast, by Application 2020 & 2033
- Table 32: Israel Silicon Photonics Components Revenue (undefined) Forecast, by Application 2020 & 2033
- Table 33: GCC Silicon Photonics Components Revenue (undefined) Forecast, by Application 2020 & 2033
- Table 34: North Africa Silicon Photonics Components Revenue (undefined) Forecast, by Application 2020 & 2033
- Table 35: South Africa Silicon Photonics Components Revenue (undefined) Forecast, by Application 2020 & 2033
- Table 36: Rest of Middle East & Africa Silicon Photonics Components Revenue (undefined) Forecast, by Application 2020 & 2033
- Table 37: Global Silicon Photonics Components Revenue undefined Forecast, by Application 2020 & 2033
- Table 38: Global Silicon Photonics Components Revenue undefined Forecast, by Types 2020 & 2033
- Table 39: Global Silicon Photonics Components Revenue undefined Forecast, by Country 2020 & 2033
- Table 40: China Silicon Photonics Components Revenue (undefined) Forecast, by Application 2020 & 2033
- Table 41: India Silicon Photonics Components Revenue (undefined) Forecast, by Application 2020 & 2033
- Table 42: Japan Silicon Photonics Components Revenue (undefined) Forecast, by Application 2020 & 2033
- Table 43: South Korea Silicon Photonics Components Revenue (undefined) Forecast, by Application 2020 & 2033
- Table 44: ASEAN Silicon Photonics Components Revenue (undefined) Forecast, by Application 2020 & 2033
- Table 45: Oceania Silicon Photonics Components Revenue (undefined) Forecast, by Application 2020 & 2033
- Table 46: Rest of Asia Pacific Silicon Photonics Components Revenue (undefined) Forecast, by Application 2020 & 2033
Frequently Asked Questions
1. What is the projected Compound Annual Growth Rate (CAGR) of the Silicon Photonics Components?
The projected CAGR is approximately 26.9%.
2. Which companies are prominent players in the Silicon Photonics Components?
Key companies in the market include Cisco Systems, Intel, MACOM Technology, GlobalFoundries, NeoPhotonics, InPhi, II-VI, IBM, STMicroelectronics, Rockley Photonics, Juniper, FUJITSU, MELLANOX, SICOYA, LUMENTUM, RANOVUS.
3. What are the main segments of the Silicon Photonics Components?
The market segments include Application, Types.
4. Can you provide details about the market size?
The market size is estimated to be USD XXX N/A as of 2022.
5. What are some drivers contributing to market growth?
N/A
6. What are the notable trends driving market growth?
N/A
7. Are there any restraints impacting market growth?
N/A
8. Can you provide examples of recent developments in the market?
N/A
9. What pricing options are available for accessing the report?
Pricing options include single-user, multi-user, and enterprise licenses priced at USD 4900.00, USD 7350.00, and USD 9800.00 respectively.
10. Is the market size provided in terms of value or volume?
The market size is provided in terms of value, measured in N/A.
11. Are there any specific market keywords associated with the report?
Yes, the market keyword associated with the report is "Silicon Photonics Components," which aids in identifying and referencing the specific market segment covered.
12. How do I determine which pricing option suits my needs best?
The pricing options vary based on user requirements and access needs. Individual users may opt for single-user licenses, while businesses requiring broader access may choose multi-user or enterprise licenses for cost-effective access to the report.
13. Are there any additional resources or data provided in the Silicon Photonics Components report?
While the report offers comprehensive insights, it's advisable to review the specific contents or supplementary materials provided to ascertain if additional resources or data are available.
14. How can I stay updated on further developments or reports in the Silicon Photonics Components?
To stay informed about further developments, trends, and reports in the Silicon Photonics Components, consider subscribing to industry newsletters, following relevant companies and organizations, or regularly checking reputable industry news sources and publications.
Methodology
Step 1 - Identification of Relevant Samples Size from Population Database


Step 2 - Approaches for Defining Global Market Size (Value, Volume* & Price*)

Note*: In applicable scenarios
Step 3 - Data Sources
Primary Research
- Web Analytics
- Survey Reports
- Research Institute
- Latest Research Reports
- Opinion Leaders
Secondary Research
- Annual Reports
- White Paper
- Latest Press Release
- Industry Association
- Paid Database
- Investor Presentations

Step 4 - Data Triangulation
Involves using different sources of information in order to increase the validity of a study
These sources are likely to be stakeholders in a program - participants, other researchers, program staff, other community members, and so on.
Then we put all data in single framework & apply various statistical tools to find out the dynamic on the market.
During the analysis stage, feedback from the stakeholder groups would be compared to determine areas of agreement as well as areas of divergence