

Key Insights
The global Smart Card in Government market is poised for robust expansion, projected to reach a significant USD 5.8 billion in 2025. This growth trajectory is underpinned by a compelling Compound Annual Growth Rate (CAGR) of 6.3% anticipated over the forecast period, indicating sustained demand and increasing adoption of smart card technologies within public sector entities. The primary drivers for this expansion include the escalating need for secure identification and authentication systems, the imperative to enhance border security and manage entrances and exits efficiently, and the ongoing digital transformation initiatives within governments worldwide. As nations increasingly prioritize data security and citizen privacy, smart cards offer a robust and tamper-resistant solution for a multitude of governmental applications, from national ID programs and e-passports to access control in sensitive areas and secure digital service delivery. The market's dynamism is further fueled by advancements in chip technology, contactless capabilities, and the integration of biometric features, all contributing to a more secure and user-friendly experience for citizens and government officials alike.
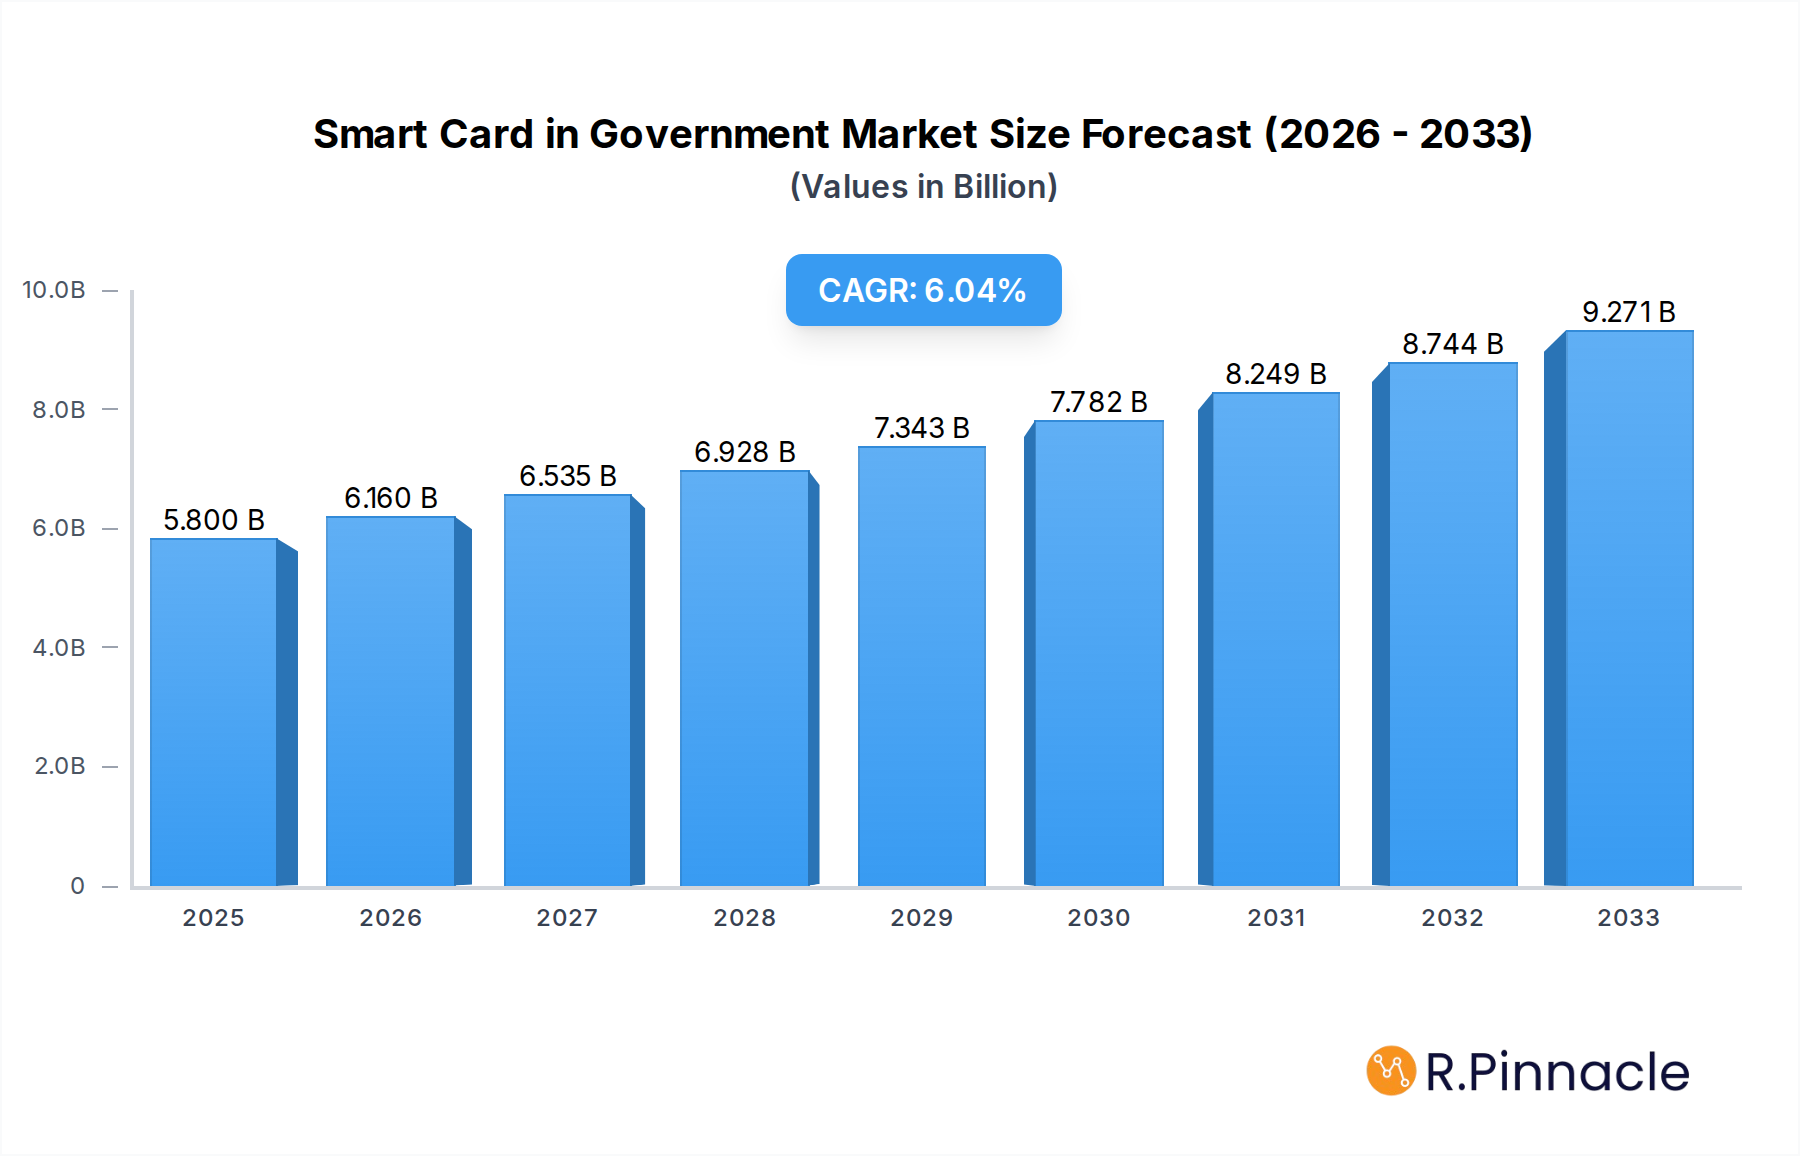
Smart Card in Government Market Size (In Billion)
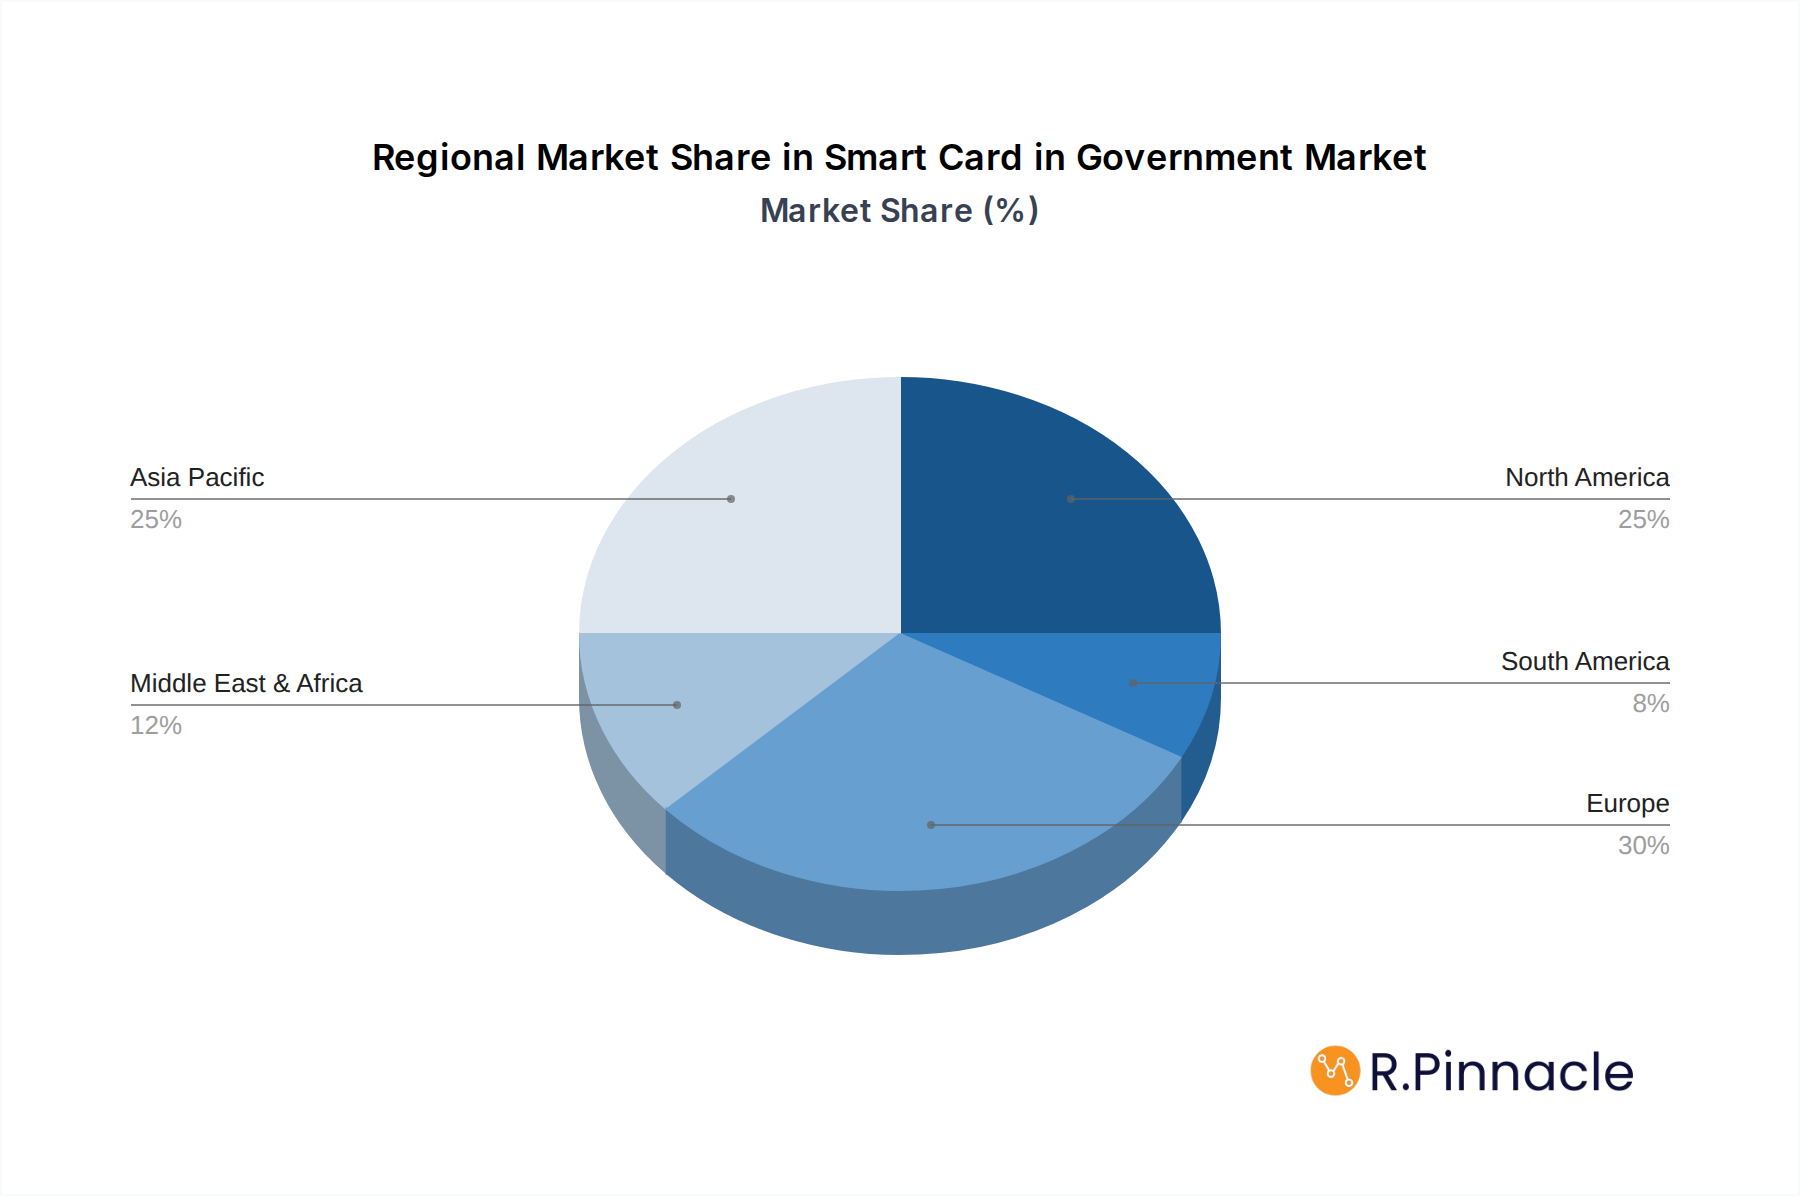
The market is segmented into key applications such as Identification and Authentication, Entrance and Exit, and Other government functions. The Identification and Authentication segment is expected to dominate due to the widespread implementation of national ID programs and the demand for secure digital identities. Contactless smart cards are gaining significant traction over their contact counterparts, driven by convenience and speed, especially in high-volume transaction environments like border control and public transportation. Key industry players such as Gemalto, Giesecke & Devrient, and Morpho (Safran) are actively innovating and expanding their offerings to cater to the evolving demands of government agencies. Regional analysis reveals that Asia Pacific, led by China and India, is expected to exhibit the fastest growth, fueled by large populations and aggressive government initiatives for digitization and security. North America and Europe continue to be significant markets, driven by established digital identity programs and stringent security regulations. However, the market also faces restraints such as the initial high cost of implementation and the need for robust infrastructure and interoperability standards across different government departments.

Smart Card in Government Company Market Share
This in-depth report delivers a pivotal analysis of the Smart Card in Government market, offering unparalleled insights for industry professionals. Covering a study period from 2019 to 2033, with a base and estimated year of 2025, this report provides a robust forecast period of 2025–2033 and historical context from 2019–2024. We delve into critical aspects of this rapidly evolving sector, empowering stakeholders with data-driven strategies for growth and innovation. Our comprehensive research explores market concentration, cutting-edge innovations, evolving regulatory landscapes, the threat of product substitutes, detailed end-user demographics, and significant M&A activities, projected to reach several billion in transaction values.
Smart Card in Government Market Structure & Innovation Trends
The Smart Card in Government market exhibits a moderate to high level of concentration, with key players dominating significant market share, estimated to exceed XX billion in total market value. Innovation is a primary driver, fueled by advancements in secure chip technology, contactless communication protocols, and the integration of biometric authentication. Regulatory frameworks, such as data privacy laws and government mandates for secure identification, play a crucial role in shaping market dynamics and adoption rates, influencing an estimated XX billion in compliance-related spending. The threat of product substitutes, while present in the form of mobile IDs or cloud-based authentication, remains limited due to the inherent security and established infrastructure of smart cards, impacting an estimated XX billion in potential displacement. End-user demographics are increasingly diverse, encompassing citizens requiring identification for services, government employees for access control, and law enforcement for secure data management, representing a user base valued in the billions. Mergers and acquisitions (M&A) are strategically significant, with estimated deal values reaching billions, as companies aim to consolidate market presence and expand technological capabilities.
- Market Concentration: Dominated by a few key global and regional players.
- Innovation Drivers: Secure chip technology, contactless capabilities, biometric integration, IoT compatibility.
- Regulatory Frameworks: Data protection, national ID programs, secure access mandates.
- Product Substitutes: Mobile IDs, cloud-based authentication (limited impact in core government applications).
- End-User Demographics: Citizens, government employees, law enforcement, military.
- M&A Activities: Strategic consolidation for market share and technology acquisition.
Smart Card in Government Market Dynamics & Trends
The Smart Card in Government market is poised for significant expansion, driven by a confluence of technological advancements, robust government initiatives, and an increasing demand for secure and efficient digital identities. The market is experiencing a Compound Annual Growth Rate (CAGR) of approximately XX%, projected to propel its value to over hundreds of billions by the forecast period's end. Market penetration is steadily increasing, particularly in developing economies seeking to modernize their identification and authentication systems. Key growth drivers include the escalating need for secure citizen identification for accessing public services, the implementation of e-passports and national ID programs, and the enhanced security requirements for border control and critical infrastructure access. Technological disruptions, such as the evolution of secure element technology, advancements in cryptography, and the integration of contactless payment functionalities, are further stimulating market growth. Consumer preferences are shifting towards user-friendly, highly secure solutions, making smart cards an attractive option. Competitive dynamics are characterized by intense innovation, strategic partnerships, and a focus on end-to-end security solutions. The expansion of digital government services and the increasing reliance on secure data management are creating a sustained demand for smart card solutions, estimated to contribute billions annually to the market. The ongoing digitalization of government operations globally acts as a significant catalyst, fostering a more interconnected and secure digital ecosystem. The increasing adoption of smart cards in areas like healthcare, transportation, and voting systems further broadens the market's scope.
Dominant Regions & Segments in Smart Card in Government
The Smart Card in Government market is witnessing dominant growth and adoption across several key regions and segments. North America and Europe currently lead in market share, driven by established government digital transformation initiatives, stringent security regulations, and high disposable incomes that facilitate investment in advanced technologies. Asia Pacific, however, is emerging as the fastest-growing region, fueled by large-scale national ID programs, increasing government spending on digitalization, and a rapidly expanding smart card manufacturing base. China, in particular, is a powerhouse in this region, contributing significantly to both production and adoption, with an estimated market contribution of hundreds of billions.
Within the Application segment, Identification and Authentication is the most dominant, encompassing national ID cards, driver's licenses, and e-passports. This segment's dominance is a direct result of governments worldwide prioritizing secure citizen identification and access to government services, representing an estimated billions in annual spending. The Entrance and Exit segment, covering border control, secure facility access, and transportation, also shows substantial growth, driven by national security concerns and the need for efficient movement of people. This segment is estimated to be worth billions annually.
In terms of Types, Contactless Smart Cards are rapidly gaining prominence over Contact Smart Cards. The convenience, speed, and hygiene offered by contactless technology are driving this shift, particularly in high-volume transaction environments like public transportation and access control. The market for contactless solutions is projected to reach hundreds of billions by the forecast period's end.
- Leading Region: North America and Europe (established dominance), Asia Pacific (fastest-growing).
- Dominant Application Segment: Identification and Authentication (national IDs, e-passports, driver's licenses).
- Key Drivers for Identification & Authentication: Secure citizen services, national security, e-governance.
- Strong Growth Application Segment: Entrance and Exit (border control, secure access, transportation).
- Dominant Card Type: Contactless Smart Cards (convenience, speed, hygiene).
- Key Drivers for Contactless: Modernization of infrastructure, user experience, efficiency.
Smart Card in Government Product Innovations
Product innovations in the Smart Card in Government sector are heavily focused on enhancing security, usability, and interoperability. Advancements in secure microcontroller chips with increased processing power and memory enable more sophisticated encryption algorithms and larger data storage capacities. The integration of advanced biometric authentication, such as fingerprint or facial recognition, directly onto the card or in conjunction with it, is a significant trend, providing an additional layer of security valued in the billions. Furthermore, the development of dual-interface cards, offering both contact and contactless functionality, enhances versatility and caters to diverse application needs. The focus is on creating tamper-proof and highly durable cards that can withstand rigorous use while maintaining data integrity, contributing to an estimated XX billion in R&D investments.
Report Scope & Segmentation Analysis
This report meticulously segments the Smart Card in Government market to provide granular insights. The Application segmentation includes Identification and Authentication, the largest segment driven by national ID and passport programs, with projected growth to billions. Entrance and Exit applications, including border control and secure access, are also a significant contributor, expected to reach billions. The Other application category encompasses diverse uses like welfare distribution and vaccination records, showing steady growth to hundreds of millions. In terms of Types, Contact Smart Cards continue to hold a substantial market share, particularly in legacy systems, estimated at billions. However, Contactless Smart Cards are the fastest-growing segment, projected to surge to hundreds of billions due to their superior convenience and speed.
- Application: Identification and Authentication: Dominant, focused on national IDs, passports, and driver's licenses. Projected market size: billions.
- Application: Entrance and Exit: Significant growth in border control, secure facility access, and transportation. Projected market size: billions.
- Application: Other: Niche applications like welfare and healthcare, steady growth. Projected market size: hundreds of millions.
- Type: Contact Smart Card: Established presence, declining growth rate. Projected market size: billions.
- Type: Contactless Smart Card: Fastest-growing segment, driven by convenience and modern infrastructure. Projected market size: hundreds of billions.
Key Drivers of Smart Card in Government Growth
The growth of the Smart Card in Government market is propelled by a multifaceted interplay of technological, economic, and regulatory factors. Governments worldwide are increasingly prioritizing secure and reliable identification systems to streamline public services, combat fraud, and enhance national security. The digital transformation initiatives undertaken by numerous governments are creating a fertile ground for smart card adoption, particularly in areas like e-governance, e-passports, and national ID programs. Economic factors, such as increased government spending on infrastructure upgrades and the drive for more efficient public service delivery, also play a crucial role. Furthermore, evolving regulatory frameworks mandating the use of secure identification for various government functions provide a strong impetus for market expansion, influencing an estimated XX billion in government procurement annually.
- Technological Advancements: Improved security features, contactless capabilities, and biometric integration.
- Government Initiatives: Digital transformation, e-governance programs, national ID and e-passport projects.
- Economic Factors: Increased government spending on infrastructure, drive for efficiency in public services.
- Regulatory Frameworks: Mandates for secure identification, data privacy laws, and security standards.
Challenges in the Smart Card in Government Sector
Despite its robust growth trajectory, the Smart Card in Government sector faces several challenges that could impede its full potential. High initial implementation costs associated with infrastructure upgrades, card personalization, and system integration can be a significant barrier for some governments, potentially impacting an estimated billions in upfront investment. Evolving cybersecurity threats and the constant need to stay ahead of sophisticated hacking attempts necessitate continuous investment in advanced security protocols and regular updates, adding to operational expenses. Regulatory hurdles and the complexity of harmonizing different national and international standards can also slow down adoption and interoperability. Furthermore, the supply chain disruptions, as witnessed in recent global events, can impact the availability and cost of essential components, affecting an estimated XX billion in production costs.
- High Implementation Costs: Infrastructure, personalization, and integration expenses.
- Cybersecurity Threats: Constant need for updated security protocols.
- Regulatory Complexity: Harmonizing standards and compliance.
- Supply Chain Vulnerabilities: Component availability and cost fluctuations.
Emerging Opportunities in Smart Card in Government
The Smart Card in Government market is ripe with emerging opportunities driven by technological convergence and evolving societal needs. The integration of smart cards with the Internet of Things (IoT) presents a significant opportunity for secure device identification and data management in government applications, potentially unlocking billions in new use cases. The growing demand for enhanced border security and seamless travel experiences is driving the adoption of advanced e-passports and automated border control systems utilizing smart card technology. Furthermore, the increasing focus on digital inclusion and financial empowerment is opening avenues for smart cards in welfare distribution, secure digital payments for government services, and digital identity solutions for unbanked populations, representing a potential market of hundreds of billions. The continued evolution of contactless payment and access control technologies also offers substantial growth prospects, with an estimated XX billion in potential expansion.
- IoT Integration: Secure device identification and data management.
- Enhanced Border Security: Advanced e-passports and automated border control.
- Digital Inclusion: Welfare distribution, secure payments, digital identity for the unbanked.
- Contactless Technology Expansion: Payment and access control across government services.
Leading Players in the Smart Card in Government Market
- Gemalto
- Giesecke & Devrient
- Oberthur Technologies
- Morpho (Safran)
- VALID
- Eastcompeace
- Wuhan Tianyu
- Datang
- Kona I
- CPI Card Group
- Watchdata Systems Co. Ltd
- Hengbao
Key Developments in Smart Card in Government Industry
- 2023 November: Gemalto launches advanced secure element for next-generation e-passports, enhancing biometric data security.
- 2023 October: Giesecke & Devrient partners with a major European government for a nationwide digital identity solution leveraging smart card technology.
- 2023 September: Morpho (Safran) secures a significant contract for secure access control systems for critical government infrastructure in Southeast Asia.
- 2022 December: VALID expands its contactless smart card production capacity to meet the growing demand for public transportation and citizen ID programs.
- 2022 June: Eastcompeace announces a breakthrough in embedded secure elements for highly secure government communication devices.
- 2021 November: Wuhan Tianyu showcases innovative smart card solutions for smart city initiatives, including secure citizen access and utility management.
Future Outlook for Smart Card in Government Market
The future outlook for the Smart Card in Government market is exceptionally promising, with continued strong growth anticipated over the next decade. The increasing global imperative for robust digital security, coupled with governments' commitment to modernizing their infrastructure and citizen services, will be the primary growth accelerators. The persistent evolution of secure technologies, including advancements in quantum-resistant cryptography and embedded artificial intelligence within smart cards, will further fortify their position. Opportunities for expansion into new application areas, such as secure voting systems, digital health records, and verifiable credentials, will unlock significant market potential, contributing to an estimated hundreds of billions in future value. Strategic collaborations between technology providers and government agencies will be crucial in driving innovation and ensuring widespread, secure adoption.
Smart Card in Government Segmentation
-
1. Application
- 1.1. Identification and Authentication
- 1.2. Entrance and Exit
- 1.3. Other
-
2. Types
- 2.1. Contact Smart Card
- 2.2. Contactless Smart Card
Smart Card in Government Segmentation By Geography
-
1. North America
- 1.1. United States
- 1.2. Canada
- 1.3. Mexico
-
2. South America
- 2.1. Brazil
- 2.2. Argentina
- 2.3. Rest of South America
-
3. Europe
- 3.1. United Kingdom
- 3.2. Germany
- 3.3. France
- 3.4. Italy
- 3.5. Spain
- 3.6. Russia
- 3.7. Benelux
- 3.8. Nordics
- 3.9. Rest of Europe
-
4. Middle East & Africa
- 4.1. Turkey
- 4.2. Israel
- 4.3. GCC
- 4.4. North Africa
- 4.5. South Africa
- 4.6. Rest of Middle East & Africa
-
5. Asia Pacific
- 5.1. China
- 5.2. India
- 5.3. Japan
- 5.4. South Korea
- 5.5. ASEAN
- 5.6. Oceania
- 5.7. Rest of Asia Pacific
Smart Card in Government Regional Market Share
Geographic Coverage of Smart Card in Government
Smart Card in Government REPORT HIGHLIGHTS
| Aspects | Details |
|---|---|
| Study Period | 2020-2034 |
| Base Year | 2025 |
| Estimated Year | 2026 |
| Forecast Period | 2026-2034 |
| Historical Period | 2020-2025 |
| Growth Rate | CAGR of 6.3% from 2020-2034 |
| Segmentation |
|
Table of Contents
- 1. Introduction
- 1.1. Research Scope
- 1.2. Market Segmentation
- 1.3. Research Methodology
- 1.4. Definitions and Assumptions
- 2. Executive Summary
- 2.1. Introduction
- 3. Market Dynamics
- 3.1. Introduction
- 3.2. Market Drivers
- 3.3. Market Restrains
- 3.4. Market Trends
- 4. Market Factor Analysis
- 4.1. Porters Five Forces
- 4.2. Supply/Value Chain
- 4.3. PESTEL analysis
- 4.4. Market Entropy
- 4.5. Patent/Trademark Analysis
- 5. Global Smart Card in Government Analysis, Insights and Forecast, 2020-2032
- 5.1. Market Analysis, Insights and Forecast - by Application
- 5.1.1. Identification and Authentication
- 5.1.2. Entrance and Exit
- 5.1.3. Other
- 5.2. Market Analysis, Insights and Forecast - by Types
- 5.2.1. Contact Smart Card
- 5.2.2. Contactless Smart Card
- 5.3. Market Analysis, Insights and Forecast - by Region
- 5.3.1. North America
- 5.3.2. South America
- 5.3.3. Europe
- 5.3.4. Middle East & Africa
- 5.3.5. Asia Pacific
- 5.1. Market Analysis, Insights and Forecast - by Application
- 6. North America Smart Card in Government Analysis, Insights and Forecast, 2020-2032
- 6.1. Market Analysis, Insights and Forecast - by Application
- 6.1.1. Identification and Authentication
- 6.1.2. Entrance and Exit
- 6.1.3. Other
- 6.2. Market Analysis, Insights and Forecast - by Types
- 6.2.1. Contact Smart Card
- 6.2.2. Contactless Smart Card
- 6.1. Market Analysis, Insights and Forecast - by Application
- 7. South America Smart Card in Government Analysis, Insights and Forecast, 2020-2032
- 7.1. Market Analysis, Insights and Forecast - by Application
- 7.1.1. Identification and Authentication
- 7.1.2. Entrance and Exit
- 7.1.3. Other
- 7.2. Market Analysis, Insights and Forecast - by Types
- 7.2.1. Contact Smart Card
- 7.2.2. Contactless Smart Card
- 7.1. Market Analysis, Insights and Forecast - by Application
- 8. Europe Smart Card in Government Analysis, Insights and Forecast, 2020-2032
- 8.1. Market Analysis, Insights and Forecast - by Application
- 8.1.1. Identification and Authentication
- 8.1.2. Entrance and Exit
- 8.1.3. Other
- 8.2. Market Analysis, Insights and Forecast - by Types
- 8.2.1. Contact Smart Card
- 8.2.2. Contactless Smart Card
- 8.1. Market Analysis, Insights and Forecast - by Application
- 9. Middle East & Africa Smart Card in Government Analysis, Insights and Forecast, 2020-2032
- 9.1. Market Analysis, Insights and Forecast - by Application
- 9.1.1. Identification and Authentication
- 9.1.2. Entrance and Exit
- 9.1.3. Other
- 9.2. Market Analysis, Insights and Forecast - by Types
- 9.2.1. Contact Smart Card
- 9.2.2. Contactless Smart Card
- 9.1. Market Analysis, Insights and Forecast - by Application
- 10. Asia Pacific Smart Card in Government Analysis, Insights and Forecast, 2020-2032
- 10.1. Market Analysis, Insights and Forecast - by Application
- 10.1.1. Identification and Authentication
- 10.1.2. Entrance and Exit
- 10.1.3. Other
- 10.2. Market Analysis, Insights and Forecast - by Types
- 10.2.1. Contact Smart Card
- 10.2.2. Contactless Smart Card
- 10.1. Market Analysis, Insights and Forecast - by Application
- 11. Competitive Analysis
- 11.1. Global Market Share Analysis 2025
- 11.2. Company Profiles
- 11.2.1 Gemalto
- 11.2.1.1. Overview
- 11.2.1.2. Products
- 11.2.1.3. SWOT Analysis
- 11.2.1.4. Recent Developments
- 11.2.1.5. Financials (Based on Availability)
- 11.2.2 Giesecke & Devrient
- 11.2.2.1. Overview
- 11.2.2.2. Products
- 11.2.2.3. SWOT Analysis
- 11.2.2.4. Recent Developments
- 11.2.2.5. Financials (Based on Availability)
- 11.2.3 Oberthur Technologies
- 11.2.3.1. Overview
- 11.2.3.2. Products
- 11.2.3.3. SWOT Analysis
- 11.2.3.4. Recent Developments
- 11.2.3.5. Financials (Based on Availability)
- 11.2.4 Morpho (Safran)
- 11.2.4.1. Overview
- 11.2.4.2. Products
- 11.2.4.3. SWOT Analysis
- 11.2.4.4. Recent Developments
- 11.2.4.5. Financials (Based on Availability)
- 11.2.5 VALID
- 11.2.5.1. Overview
- 11.2.5.2. Products
- 11.2.5.3. SWOT Analysis
- 11.2.5.4. Recent Developments
- 11.2.5.5. Financials (Based on Availability)
- 11.2.6 Eastcompeace
- 11.2.6.1. Overview
- 11.2.6.2. Products
- 11.2.6.3. SWOT Analysis
- 11.2.6.4. Recent Developments
- 11.2.6.5. Financials (Based on Availability)
- 11.2.7 Wuhan Tianyu
- 11.2.7.1. Overview
- 11.2.7.2. Products
- 11.2.7.3. SWOT Analysis
- 11.2.7.4. Recent Developments
- 11.2.7.5. Financials (Based on Availability)
- 11.2.8 Datang
- 11.2.8.1. Overview
- 11.2.8.2. Products
- 11.2.8.3. SWOT Analysis
- 11.2.8.4. Recent Developments
- 11.2.8.5. Financials (Based on Availability)
- 11.2.9 Kona I
- 11.2.9.1. Overview
- 11.2.9.2. Products
- 11.2.9.3. SWOT Analysis
- 11.2.9.4. Recent Developments
- 11.2.9.5. Financials (Based on Availability)
- 11.2.10 CPI Card Group
- 11.2.10.1. Overview
- 11.2.10.2. Products
- 11.2.10.3. SWOT Analysis
- 11.2.10.4. Recent Developments
- 11.2.10.5. Financials (Based on Availability)
- 11.2.11 Watchdata Systems Co. Ltd
- 11.2.11.1. Overview
- 11.2.11.2. Products
- 11.2.11.3. SWOT Analysis
- 11.2.11.4. Recent Developments
- 11.2.11.5. Financials (Based on Availability)
- 11.2.12 Hengbao
- 11.2.12.1. Overview
- 11.2.12.2. Products
- 11.2.12.3. SWOT Analysis
- 11.2.12.4. Recent Developments
- 11.2.12.5. Financials (Based on Availability)
- 11.2.1 Gemalto
List of Figures
- Figure 1: Global Smart Card in Government Revenue Breakdown (billion, %) by Region 2025 & 2033
- Figure 2: Global Smart Card in Government Volume Breakdown (K, %) by Region 2025 & 2033
- Figure 3: North America Smart Card in Government Revenue (billion), by Application 2025 & 2033
- Figure 4: North America Smart Card in Government Volume (K), by Application 2025 & 2033
- Figure 5: North America Smart Card in Government Revenue Share (%), by Application 2025 & 2033
- Figure 6: North America Smart Card in Government Volume Share (%), by Application 2025 & 2033
- Figure 7: North America Smart Card in Government Revenue (billion), by Types 2025 & 2033
- Figure 8: North America Smart Card in Government Volume (K), by Types 2025 & 2033
- Figure 9: North America Smart Card in Government Revenue Share (%), by Types 2025 & 2033
- Figure 10: North America Smart Card in Government Volume Share (%), by Types 2025 & 2033
- Figure 11: North America Smart Card in Government Revenue (billion), by Country 2025 & 2033
- Figure 12: North America Smart Card in Government Volume (K), by Country 2025 & 2033
- Figure 13: North America Smart Card in Government Revenue Share (%), by Country 2025 & 2033
- Figure 14: North America Smart Card in Government Volume Share (%), by Country 2025 & 2033
- Figure 15: South America Smart Card in Government Revenue (billion), by Application 2025 & 2033
- Figure 16: South America Smart Card in Government Volume (K), by Application 2025 & 2033
- Figure 17: South America Smart Card in Government Revenue Share (%), by Application 2025 & 2033
- Figure 18: South America Smart Card in Government Volume Share (%), by Application 2025 & 2033
- Figure 19: South America Smart Card in Government Revenue (billion), by Types 2025 & 2033
- Figure 20: South America Smart Card in Government Volume (K), by Types 2025 & 2033
- Figure 21: South America Smart Card in Government Revenue Share (%), by Types 2025 & 2033
- Figure 22: South America Smart Card in Government Volume Share (%), by Types 2025 & 2033
- Figure 23: South America Smart Card in Government Revenue (billion), by Country 2025 & 2033
- Figure 24: South America Smart Card in Government Volume (K), by Country 2025 & 2033
- Figure 25: South America Smart Card in Government Revenue Share (%), by Country 2025 & 2033
- Figure 26: South America Smart Card in Government Volume Share (%), by Country 2025 & 2033
- Figure 27: Europe Smart Card in Government Revenue (billion), by Application 2025 & 2033
- Figure 28: Europe Smart Card in Government Volume (K), by Application 2025 & 2033
- Figure 29: Europe Smart Card in Government Revenue Share (%), by Application 2025 & 2033
- Figure 30: Europe Smart Card in Government Volume Share (%), by Application 2025 & 2033
- Figure 31: Europe Smart Card in Government Revenue (billion), by Types 2025 & 2033
- Figure 32: Europe Smart Card in Government Volume (K), by Types 2025 & 2033
- Figure 33: Europe Smart Card in Government Revenue Share (%), by Types 2025 & 2033
- Figure 34: Europe Smart Card in Government Volume Share (%), by Types 2025 & 2033
- Figure 35: Europe Smart Card in Government Revenue (billion), by Country 2025 & 2033
- Figure 36: Europe Smart Card in Government Volume (K), by Country 2025 & 2033
- Figure 37: Europe Smart Card in Government Revenue Share (%), by Country 2025 & 2033
- Figure 38: Europe Smart Card in Government Volume Share (%), by Country 2025 & 2033
- Figure 39: Middle East & Africa Smart Card in Government Revenue (billion), by Application 2025 & 2033
- Figure 40: Middle East & Africa Smart Card in Government Volume (K), by Application 2025 & 2033
- Figure 41: Middle East & Africa Smart Card in Government Revenue Share (%), by Application 2025 & 2033
- Figure 42: Middle East & Africa Smart Card in Government Volume Share (%), by Application 2025 & 2033
- Figure 43: Middle East & Africa Smart Card in Government Revenue (billion), by Types 2025 & 2033
- Figure 44: Middle East & Africa Smart Card in Government Volume (K), by Types 2025 & 2033
- Figure 45: Middle East & Africa Smart Card in Government Revenue Share (%), by Types 2025 & 2033
- Figure 46: Middle East & Africa Smart Card in Government Volume Share (%), by Types 2025 & 2033
- Figure 47: Middle East & Africa Smart Card in Government Revenue (billion), by Country 2025 & 2033
- Figure 48: Middle East & Africa Smart Card in Government Volume (K), by Country 2025 & 2033
- Figure 49: Middle East & Africa Smart Card in Government Revenue Share (%), by Country 2025 & 2033
- Figure 50: Middle East & Africa Smart Card in Government Volume Share (%), by Country 2025 & 2033
- Figure 51: Asia Pacific Smart Card in Government Revenue (billion), by Application 2025 & 2033
- Figure 52: Asia Pacific Smart Card in Government Volume (K), by Application 2025 & 2033
- Figure 53: Asia Pacific Smart Card in Government Revenue Share (%), by Application 2025 & 2033
- Figure 54: Asia Pacific Smart Card in Government Volume Share (%), by Application 2025 & 2033
- Figure 55: Asia Pacific Smart Card in Government Revenue (billion), by Types 2025 & 2033
- Figure 56: Asia Pacific Smart Card in Government Volume (K), by Types 2025 & 2033
- Figure 57: Asia Pacific Smart Card in Government Revenue Share (%), by Types 2025 & 2033
- Figure 58: Asia Pacific Smart Card in Government Volume Share (%), by Types 2025 & 2033
- Figure 59: Asia Pacific Smart Card in Government Revenue (billion), by Country 2025 & 2033
- Figure 60: Asia Pacific Smart Card in Government Volume (K), by Country 2025 & 2033
- Figure 61: Asia Pacific Smart Card in Government Revenue Share (%), by Country 2025 & 2033
- Figure 62: Asia Pacific Smart Card in Government Volume Share (%), by Country 2025 & 2033
List of Tables
- Table 1: Global Smart Card in Government Revenue billion Forecast, by Application 2020 & 2033
- Table 2: Global Smart Card in Government Volume K Forecast, by Application 2020 & 2033
- Table 3: Global Smart Card in Government Revenue billion Forecast, by Types 2020 & 2033
- Table 4: Global Smart Card in Government Volume K Forecast, by Types 2020 & 2033
- Table 5: Global Smart Card in Government Revenue billion Forecast, by Region 2020 & 2033
- Table 6: Global Smart Card in Government Volume K Forecast, by Region 2020 & 2033
- Table 7: Global Smart Card in Government Revenue billion Forecast, by Application 2020 & 2033
- Table 8: Global Smart Card in Government Volume K Forecast, by Application 2020 & 2033
- Table 9: Global Smart Card in Government Revenue billion Forecast, by Types 2020 & 2033
- Table 10: Global Smart Card in Government Volume K Forecast, by Types 2020 & 2033
- Table 11: Global Smart Card in Government Revenue billion Forecast, by Country 2020 & 2033
- Table 12: Global Smart Card in Government Volume K Forecast, by Country 2020 & 2033
- Table 13: United States Smart Card in Government Revenue (billion) Forecast, by Application 2020 & 2033
- Table 14: United States Smart Card in Government Volume (K) Forecast, by Application 2020 & 2033
- Table 15: Canada Smart Card in Government Revenue (billion) Forecast, by Application 2020 & 2033
- Table 16: Canada Smart Card in Government Volume (K) Forecast, by Application 2020 & 2033
- Table 17: Mexico Smart Card in Government Revenue (billion) Forecast, by Application 2020 & 2033
- Table 18: Mexico Smart Card in Government Volume (K) Forecast, by Application 2020 & 2033
- Table 19: Global Smart Card in Government Revenue billion Forecast, by Application 2020 & 2033
- Table 20: Global Smart Card in Government Volume K Forecast, by Application 2020 & 2033
- Table 21: Global Smart Card in Government Revenue billion Forecast, by Types 2020 & 2033
- Table 22: Global Smart Card in Government Volume K Forecast, by Types 2020 & 2033
- Table 23: Global Smart Card in Government Revenue billion Forecast, by Country 2020 & 2033
- Table 24: Global Smart Card in Government Volume K Forecast, by Country 2020 & 2033
- Table 25: Brazil Smart Card in Government Revenue (billion) Forecast, by Application 2020 & 2033
- Table 26: Brazil Smart Card in Government Volume (K) Forecast, by Application 2020 & 2033
- Table 27: Argentina Smart Card in Government Revenue (billion) Forecast, by Application 2020 & 2033
- Table 28: Argentina Smart Card in Government Volume (K) Forecast, by Application 2020 & 2033
- Table 29: Rest of South America Smart Card in Government Revenue (billion) Forecast, by Application 2020 & 2033
- Table 30: Rest of South America Smart Card in Government Volume (K) Forecast, by Application 2020 & 2033
- Table 31: Global Smart Card in Government Revenue billion Forecast, by Application 2020 & 2033
- Table 32: Global Smart Card in Government Volume K Forecast, by Application 2020 & 2033
- Table 33: Global Smart Card in Government Revenue billion Forecast, by Types 2020 & 2033
- Table 34: Global Smart Card in Government Volume K Forecast, by Types 2020 & 2033
- Table 35: Global Smart Card in Government Revenue billion Forecast, by Country 2020 & 2033
- Table 36: Global Smart Card in Government Volume K Forecast, by Country 2020 & 2033
- Table 37: United Kingdom Smart Card in Government Revenue (billion) Forecast, by Application 2020 & 2033
- Table 38: United Kingdom Smart Card in Government Volume (K) Forecast, by Application 2020 & 2033
- Table 39: Germany Smart Card in Government Revenue (billion) Forecast, by Application 2020 & 2033
- Table 40: Germany Smart Card in Government Volume (K) Forecast, by Application 2020 & 2033
- Table 41: France Smart Card in Government Revenue (billion) Forecast, by Application 2020 & 2033
- Table 42: France Smart Card in Government Volume (K) Forecast, by Application 2020 & 2033
- Table 43: Italy Smart Card in Government Revenue (billion) Forecast, by Application 2020 & 2033
- Table 44: Italy Smart Card in Government Volume (K) Forecast, by Application 2020 & 2033
- Table 45: Spain Smart Card in Government Revenue (billion) Forecast, by Application 2020 & 2033
- Table 46: Spain Smart Card in Government Volume (K) Forecast, by Application 2020 & 2033
- Table 47: Russia Smart Card in Government Revenue (billion) Forecast, by Application 2020 & 2033
- Table 48: Russia Smart Card in Government Volume (K) Forecast, by Application 2020 & 2033
- Table 49: Benelux Smart Card in Government Revenue (billion) Forecast, by Application 2020 & 2033
- Table 50: Benelux Smart Card in Government Volume (K) Forecast, by Application 2020 & 2033
- Table 51: Nordics Smart Card in Government Revenue (billion) Forecast, by Application 2020 & 2033
- Table 52: Nordics Smart Card in Government Volume (K) Forecast, by Application 2020 & 2033
- Table 53: Rest of Europe Smart Card in Government Revenue (billion) Forecast, by Application 2020 & 2033
- Table 54: Rest of Europe Smart Card in Government Volume (K) Forecast, by Application 2020 & 2033
- Table 55: Global Smart Card in Government Revenue billion Forecast, by Application 2020 & 2033
- Table 56: Global Smart Card in Government Volume K Forecast, by Application 2020 & 2033
- Table 57: Global Smart Card in Government Revenue billion Forecast, by Types 2020 & 2033
- Table 58: Global Smart Card in Government Volume K Forecast, by Types 2020 & 2033
- Table 59: Global Smart Card in Government Revenue billion Forecast, by Country 2020 & 2033
- Table 60: Global Smart Card in Government Volume K Forecast, by Country 2020 & 2033
- Table 61: Turkey Smart Card in Government Revenue (billion) Forecast, by Application 2020 & 2033
- Table 62: Turkey Smart Card in Government Volume (K) Forecast, by Application 2020 & 2033
- Table 63: Israel Smart Card in Government Revenue (billion) Forecast, by Application 2020 & 2033
- Table 64: Israel Smart Card in Government Volume (K) Forecast, by Application 2020 & 2033
- Table 65: GCC Smart Card in Government Revenue (billion) Forecast, by Application 2020 & 2033
- Table 66: GCC Smart Card in Government Volume (K) Forecast, by Application 2020 & 2033
- Table 67: North Africa Smart Card in Government Revenue (billion) Forecast, by Application 2020 & 2033
- Table 68: North Africa Smart Card in Government Volume (K) Forecast, by Application 2020 & 2033
- Table 69: South Africa Smart Card in Government Revenue (billion) Forecast, by Application 2020 & 2033
- Table 70: South Africa Smart Card in Government Volume (K) Forecast, by Application 2020 & 2033
- Table 71: Rest of Middle East & Africa Smart Card in Government Revenue (billion) Forecast, by Application 2020 & 2033
- Table 72: Rest of Middle East & Africa Smart Card in Government Volume (K) Forecast, by Application 2020 & 2033
- Table 73: Global Smart Card in Government Revenue billion Forecast, by Application 2020 & 2033
- Table 74: Global Smart Card in Government Volume K Forecast, by Application 2020 & 2033
- Table 75: Global Smart Card in Government Revenue billion Forecast, by Types 2020 & 2033
- Table 76: Global Smart Card in Government Volume K Forecast, by Types 2020 & 2033
- Table 77: Global Smart Card in Government Revenue billion Forecast, by Country 2020 & 2033
- Table 78: Global Smart Card in Government Volume K Forecast, by Country 2020 & 2033
- Table 79: China Smart Card in Government Revenue (billion) Forecast, by Application 2020 & 2033
- Table 80: China Smart Card in Government Volume (K) Forecast, by Application 2020 & 2033
- Table 81: India Smart Card in Government Revenue (billion) Forecast, by Application 2020 & 2033
- Table 82: India Smart Card in Government Volume (K) Forecast, by Application 2020 & 2033
- Table 83: Japan Smart Card in Government Revenue (billion) Forecast, by Application 2020 & 2033
- Table 84: Japan Smart Card in Government Volume (K) Forecast, by Application 2020 & 2033
- Table 85: South Korea Smart Card in Government Revenue (billion) Forecast, by Application 2020 & 2033
- Table 86: South Korea Smart Card in Government Volume (K) Forecast, by Application 2020 & 2033
- Table 87: ASEAN Smart Card in Government Revenue (billion) Forecast, by Application 2020 & 2033
- Table 88: ASEAN Smart Card in Government Volume (K) Forecast, by Application 2020 & 2033
- Table 89: Oceania Smart Card in Government Revenue (billion) Forecast, by Application 2020 & 2033
- Table 90: Oceania Smart Card in Government Volume (K) Forecast, by Application 2020 & 2033
- Table 91: Rest of Asia Pacific Smart Card in Government Revenue (billion) Forecast, by Application 2020 & 2033
- Table 92: Rest of Asia Pacific Smart Card in Government Volume (K) Forecast, by Application 2020 & 2033
Frequently Asked Questions
1. What is the projected Compound Annual Growth Rate (CAGR) of the Smart Card in Government?
The projected CAGR is approximately 6.3%.
2. Which companies are prominent players in the Smart Card in Government?
Key companies in the market include Gemalto, Giesecke & Devrient, Oberthur Technologies, Morpho (Safran), VALID, Eastcompeace, Wuhan Tianyu, Datang, Kona I, CPI Card Group, Watchdata Systems Co. Ltd, Hengbao.
3. What are the main segments of the Smart Card in Government?
The market segments include Application, Types.
4. Can you provide details about the market size?
The market size is estimated to be USD 5.8 billion as of 2022.
5. What are some drivers contributing to market growth?
N/A
6. What are the notable trends driving market growth?
N/A
7. Are there any restraints impacting market growth?
N/A
8. Can you provide examples of recent developments in the market?
N/A
9. What pricing options are available for accessing the report?
Pricing options include single-user, multi-user, and enterprise licenses priced at USD 3350.00, USD 5025.00, and USD 6700.00 respectively.
10. Is the market size provided in terms of value or volume?
The market size is provided in terms of value, measured in billion and volume, measured in K.
11. Are there any specific market keywords associated with the report?
Yes, the market keyword associated with the report is "Smart Card in Government," which aids in identifying and referencing the specific market segment covered.
12. How do I determine which pricing option suits my needs best?
The pricing options vary based on user requirements and access needs. Individual users may opt for single-user licenses, while businesses requiring broader access may choose multi-user or enterprise licenses for cost-effective access to the report.
13. Are there any additional resources or data provided in the Smart Card in Government report?
While the report offers comprehensive insights, it's advisable to review the specific contents or supplementary materials provided to ascertain if additional resources or data are available.
14. How can I stay updated on further developments or reports in the Smart Card in Government?
To stay informed about further developments, trends, and reports in the Smart Card in Government, consider subscribing to industry newsletters, following relevant companies and organizations, or regularly checking reputable industry news sources and publications.
Methodology
Step 1 - Identification of Relevant Samples Size from Population Database


Step 2 - Approaches for Defining Global Market Size (Value, Volume* & Price*)

Note*: In applicable scenarios
Step 3 - Data Sources
Primary Research
- Web Analytics
- Survey Reports
- Research Institute
- Latest Research Reports
- Opinion Leaders
Secondary Research
- Annual Reports
- White Paper
- Latest Press Release
- Industry Association
- Paid Database
- Investor Presentations

Step 4 - Data Triangulation
Involves using different sources of information in order to increase the validity of a study
These sources are likely to be stakeholders in a program - participants, other researchers, program staff, other community members, and so on.
Then we put all data in single framework & apply various statistical tools to find out the dynamic on the market.
During the analysis stage, feedback from the stakeholder groups would be compared to determine areas of agreement as well as areas of divergence