


Key Insights
The global smart healthcare market is experiencing significant expansion, driven by the rising incidence of chronic conditions, increased adoption of telehealth, and the growing demand for remote patient monitoring. The market is projected for substantial growth through 2033. Key growth drivers include telemedicine, electronic health records (EHRs), and mHealth applications, which are revolutionizing healthcare by improving access, enhancing patient engagement, and streamlining operations. The integration of smart devices, such as smart pills and RFID cabinets, further optimizes medication management and inventory control. While data security and privacy remain challenges, government support for digital health initiatives and increased investment in technological advancements are mitigating these concerns. North America currently leads the market due to its advanced healthcare infrastructure and high adoption rates of smart healthcare technologies. However, the Asia-Pacific region presents considerable growth potential, fueled by rising disposable incomes and increasing healthcare expenditure.

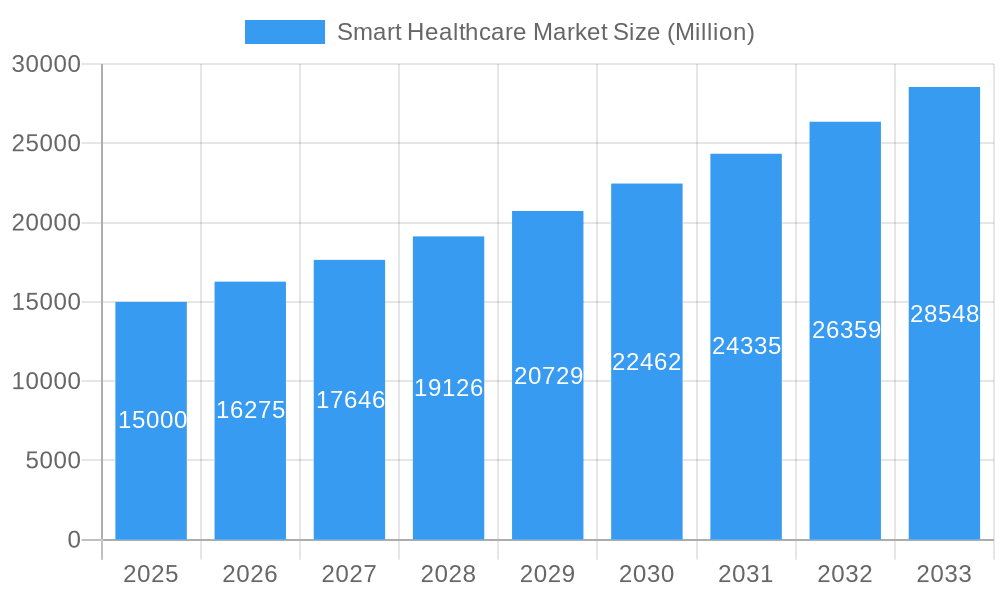
Smart Healthcare Market Market Size (In Billion)

The competitive landscape features established leaders such as Medtronic, GE Healthcare, and Philips, alongside innovative emerging companies specializing in niche smart healthcare segments. Strategic alliances, mergers, and acquisitions are influencing market dynamics, fostering product innovation and expanding market reach. Future growth is expected to be shaped by the integration of artificial intelligence (AI) and machine learning (ML) into smart healthcare solutions, the advancement of personalized medicine, and the development of sophisticated wearable health monitoring devices. Enhanced data analytics capabilities and interoperability across healthcare systems will also be critical to the market's trajectory. The smart healthcare market is poised for sustained expansion, offering significant opportunities for both established and emerging players to capitalize on the escalating demand for innovative healthcare solutions.
Smart Healthcare Market Company Market Share
Smart Healthcare Market Overview: 2025-2033 Forecast
This report offers a detailed analysis of the smart healthcare market, projecting robust growth from 2025 to 2033. It provides strategic insights for industry professionals, investors, and stakeholders navigating this dynamic sector. The analysis encompasses market segmentation, key players, technological trends, and emerging opportunities, with a focus on revenue growth and market share. The base year for this analysis is 2025, with a forecast period spanning 2025-2033. The historical data covers 2019-2024. The market size across all segments is projected to reach 252.39 billion, with a compound annual growth rate (CAGR) of 13.41%.
Smart Healthcare Market Structure & Innovation Trends
The Smart Healthcare market is characterized by a moderately concentrated structure, with several major players holding significant market share. Medtronic (Given Imaging Inc), Life Sense, Oracle Corporation (Cerner Corporation), GE Healthcare, Abbott Laboratories, Siemens Healthineers AG, Next Gen Healthcare, Koninklijke Philips NV, McKesson Corporation, Olympus Corporation, Capsule Technologies Inc, and Samsung Healthcare are key contributors. While precise market share figures are proprietary, Medtronic and Philips likely hold leading positions, followed by other multinational corporations. The market exhibits significant innovation, driven by advancements in AI, IoT, and machine learning. Regulatory frameworks, varying across geographies, influence market dynamics. M&A activity has been moderate, with deal values totaling approximately $xx Million in the past five years, reflecting strategic consolidation and expansion efforts. Product substitutes, such as traditional healthcare systems, face increasing competition due to the efficiency and enhanced patient outcomes offered by smart healthcare solutions. End-user demographics show a growing preference for convenient and personalized care, driving adoption across various age groups and health conditions.
- Market Concentration: Moderately concentrated, with several dominant players.
- Innovation Drivers: AI, IoT, Machine Learning.
- Regulatory Frameworks: Vary by region, impacting market access and adoption.
- M&A Activity: Moderate, with total deal values estimated at $xx Million (2019-2024).
- Product Substitutes: Traditional healthcare systems.
- End-User Demographics: Growing demand for personalized and convenient healthcare.
Smart Healthcare Market Dynamics & Trends
The Smart Healthcare market is experiencing significant growth, driven by several key factors. The increasing prevalence of chronic diseases, rising demand for remote patient monitoring, and growing adoption of digital health technologies are primary catalysts. Technological disruptions, such as the development of AI-powered diagnostic tools and the integration of wearable sensors, are transforming healthcare delivery. Consumer preferences are shifting towards personalized and proactive healthcare solutions, influencing market demand. The competitive landscape is dynamic, with both established players and new entrants vying for market share. The compound annual growth rate (CAGR) during the forecast period (2025-2033) is estimated to be xx%, with market penetration projected to reach xx% by 2033.
Dominant Regions & Segments in Smart Healthcare Market
The North American region currently dominates the Smart Healthcare market, driven by high technological adoption rates, substantial investments in healthcare infrastructure, and favorable regulatory environments. However, Asia-Pacific is poised for significant growth due to increasing healthcare expenditure, expanding internet penetration, and favorable government initiatives.
By Product Type:
- Telemedicine: High growth driven by remote patient monitoring needs.
- Electronic Health Records (EHRs): Significant market share due to regulatory mandates and improved data management.
- mHealth: Rapid expansion fuelled by smartphone penetration and app usage.
- Smart Pills and Syringes: Emerging market with potential for growth in drug delivery.
- Smart RFID Cabinets: Growing adoption in hospitals and pharmacies for inventory control.
- Other Product Types: Steady growth from various niche technologies.
By Application:
- Monitoring: Largest segment, driven by the need for remote patient monitoring.
- Treatment: Growing adoption of smart devices for drug delivery and therapy.
- Storage and Inventory Management: Significant market share, driven by hospital efficiency needs.
- Other Applications: Steady growth from emerging applications.
By End User:
- Hospitals: Largest segment, driven by the need for improved efficiency and patient care.
- Home Care Settings: Growing segment, fuelled by the rising elderly population and preference for home-based care.
- Other End Users: Steady growth from various settings, like clinics and diagnostic centers.
Smart Healthcare Market Product Innovations
Recent product innovations have focused on enhancing the capabilities of existing smart healthcare solutions and expanding their applications. This includes the development of AI-powered diagnostic tools that improve accuracy and speed of diagnosis, and advanced wearable sensors capable of real-time patient monitoring. Miniaturized smart pills and syringes are streamlining drug delivery and improving patient compliance. The integration of IoT and cloud computing is enabling seamless data sharing and remote patient management. The market fit for these innovations is strong, addressing pressing needs for cost-effective, efficient, and accessible healthcare.
Report Scope & Segmentation Analysis
This report comprehensively analyzes the Smart Healthcare market across various segments. The segmentation considers product type (Telemedicine, EHRs, mHealth, Smart Pills and Syringes, Smart RFID Cabinets, Other), application (Monitoring, Treatment, Storage and Inventory Management, Other), and end-user (Hospitals, Home Care Settings, Other). Growth projections vary significantly across segments, with Telemedicine, mHealth, and monitoring applications demonstrating the highest growth potential. Market sizes are provided for each segment, alongside a competitive analysis of leading players in each area.
Key Drivers of Smart Healthcare Market Growth
Technological advancements, particularly in AI, IoT, and big data analytics, are propelling Smart Healthcare market growth. Government initiatives supporting digital health, coupled with rising healthcare expenditure and an aging population, further boost market expansion. The increasing demand for remote patient monitoring and personalized medicine is also a significant driver. For example, the increasing adoption of telehealth platforms and the expansion of 5G networks have created significant opportunities.
Challenges in the Smart Healthcare Market Sector
Data security and privacy concerns represent a major challenge. The high cost of implementation and maintenance of smart healthcare systems can limit adoption, particularly in resource-constrained settings. Regulatory hurdles related to data privacy and interoperability also create obstacles. Supply chain disruptions impacting device manufacturing and deployment can further hinder market growth. The lack of skilled professionals capable of handling the advanced technology presents a significant challenge.
Emerging Opportunities in Smart Healthcare Market
The integration of AI and machine learning offers significant opportunities for developing sophisticated diagnostic and treatment tools. The expansion of 5G networks and increased IoT device availability will create opportunities for enhanced remote patient monitoring capabilities. The growing focus on preventive healthcare will drive demand for smart wearables and preventative health applications. New markets in developing economies, coupled with improving healthcare infrastructure and increased access to technology, present significant expansion potential.
Leading Players in the Smart Healthcare Market Market
Key Developments in Smart Healthcare Market Industry
- March 2022: Intuitive MB launched a medical building operating system leveraging IoT, AI, and machine learning for "smart" hospitals.
- March 2022: Commonwealth Bank launched "Smart Health," improving payments and claims for Australian private health insurers.
Future Outlook for Smart Healthcare Market Market
The Smart Healthcare market is poised for continued strong growth, driven by technological innovation, increasing demand for remote patient monitoring, and the expansion of digital healthcare services. Strategic partnerships and collaborations between technology companies and healthcare providers will further fuel market expansion. The focus on preventative healthcare, personalized medicine, and value-based care will create significant opportunities for growth in the coming years.
Smart Healthcare Market Segmentation
-
1. Product Type
- 1.1. Telemedicine
- 1.2. Electronic Health Records
- 1.3. mHealth
- 1.4. Smart Pills and Syringes
- 1.5. Smart RFID Cabinets
- 1.6. Other Product Types
-
2. Application
- 2.1. Storage and Inventory Management
- 2.2. Monitoring
- 2.3. Treatment
- 2.4. Other Applications
-
3. End User
- 3.1. Hospitals
- 3.2. Home Care Settings
- 3.3. Other End Users
Smart Healthcare Market Segmentation By Geography
-
1. North America
- 1.1. United States
- 1.2. Canada
- 1.3. Mexico
-
2. Europe
- 2.1. Germany
- 2.2. United Kingdom
- 2.3. France
- 2.4. Spain
- 2.5. Italy
- 2.6. Rest of Europe
-
3. Asia Pacific
- 3.1. China
- 3.2. Japan
- 3.3. India
- 3.4. Australia
- 3.5. South Korea
- 3.6. Rest of Asia Pacific
-
4. Middle East and Africa
- 4.1. GCC
- 4.2. South Africa
- 4.3. Rest of Middle East and Africa
-
5. South America
- 5.1. Brazil
- 5.2. Argentina
- 5.3. Rest of South America

Smart Healthcare Market Regional Market Share
Geographic Coverage of Smart Healthcare Market
Smart Healthcare Market REPORT HIGHLIGHTS
| Aspects | Details |
|---|---|
| Study Period | 2020-2034 |
| Base Year | 2025 |
| Estimated Year | 2026 |
| Forecast Period | 2026-2034 |
| Historical Period | 2020-2025 |
| Growth Rate | CAGR of 13.41% from 2020-2034 |
| Segmentation |
|
Table of Contents
- 1. Introduction
- 1.1. Research Scope
- 1.2. Market Segmentation
- 1.3. Research Methodology
- 1.4. Definitions and Assumptions
- 2. Executive Summary
- 2.1. Introduction
- 3. Market Dynamics
- 3.1. Introduction
- 3.2. Market Drivers
- 3.2.1. Technological Advancements in Smart Healthcare Products; Booming Internet of Things (IoT) in the Healthcare Industry
- 3.3. Market Restrains
- 3.3.1. High Cost of Smart Healthcare Products
- 3.4. Market Trends
- 3.4.1. The mHealth Segment is Expected to Observe Good Growth in the Market
- 4. Market Factor Analysis
- 4.1. Porters Five Forces
- 4.2. Supply/Value Chain
- 4.3. PESTEL analysis
- 4.4. Market Entropy
- 4.5. Patent/Trademark Analysis
- 5. Global Smart Healthcare Market Analysis, Insights and Forecast, 2020-2032
- 5.1. Market Analysis, Insights and Forecast - by Product Type
- 5.1.1. Telemedicine
- 5.1.2. Electronic Health Records
- 5.1.3. mHealth
- 5.1.4. Smart Pills and Syringes
- 5.1.5. Smart RFID Cabinets
- 5.1.6. Other Product Types
- 5.2. Market Analysis, Insights and Forecast - by Application
- 5.2.1. Storage and Inventory Management
- 5.2.2. Monitoring
- 5.2.3. Treatment
- 5.2.4. Other Applications
- 5.3. Market Analysis, Insights and Forecast - by End User
- 5.3.1. Hospitals
- 5.3.2. Home Care Settings
- 5.3.3. Other End Users
- 5.4. Market Analysis, Insights and Forecast - by Region
- 5.4.1. North America
- 5.4.2. Europe
- 5.4.3. Asia Pacific
- 5.4.4. Middle East and Africa
- 5.4.5. South America
- 5.1. Market Analysis, Insights and Forecast - by Product Type
- 6. North America Smart Healthcare Market Analysis, Insights and Forecast, 2020-2032
- 6.1. Market Analysis, Insights and Forecast - by Product Type
- 6.1.1. Telemedicine
- 6.1.2. Electronic Health Records
- 6.1.3. mHealth
- 6.1.4. Smart Pills and Syringes
- 6.1.5. Smart RFID Cabinets
- 6.1.6. Other Product Types
- 6.2. Market Analysis, Insights and Forecast - by Application
- 6.2.1. Storage and Inventory Management
- 6.2.2. Monitoring
- 6.2.3. Treatment
- 6.2.4. Other Applications
- 6.3. Market Analysis, Insights and Forecast - by End User
- 6.3.1. Hospitals
- 6.3.2. Home Care Settings
- 6.3.3. Other End Users
- 6.1. Market Analysis, Insights and Forecast - by Product Type
- 7. Europe Smart Healthcare Market Analysis, Insights and Forecast, 2020-2032
- 7.1. Market Analysis, Insights and Forecast - by Product Type
- 7.1.1. Telemedicine
- 7.1.2. Electronic Health Records
- 7.1.3. mHealth
- 7.1.4. Smart Pills and Syringes
- 7.1.5. Smart RFID Cabinets
- 7.1.6. Other Product Types
- 7.2. Market Analysis, Insights and Forecast - by Application
- 7.2.1. Storage and Inventory Management
- 7.2.2. Monitoring
- 7.2.3. Treatment
- 7.2.4. Other Applications
- 7.3. Market Analysis, Insights and Forecast - by End User
- 7.3.1. Hospitals
- 7.3.2. Home Care Settings
- 7.3.3. Other End Users
- 7.1. Market Analysis, Insights and Forecast - by Product Type
- 8. Asia Pacific Smart Healthcare Market Analysis, Insights and Forecast, 2020-2032
- 8.1. Market Analysis, Insights and Forecast - by Product Type
- 8.1.1. Telemedicine
- 8.1.2. Electronic Health Records
- 8.1.3. mHealth
- 8.1.4. Smart Pills and Syringes
- 8.1.5. Smart RFID Cabinets
- 8.1.6. Other Product Types
- 8.2. Market Analysis, Insights and Forecast - by Application
- 8.2.1. Storage and Inventory Management
- 8.2.2. Monitoring
- 8.2.3. Treatment
- 8.2.4. Other Applications
- 8.3. Market Analysis, Insights and Forecast - by End User
- 8.3.1. Hospitals
- 8.3.2. Home Care Settings
- 8.3.3. Other End Users
- 8.1. Market Analysis, Insights and Forecast - by Product Type
- 9. Middle East and Africa Smart Healthcare Market Analysis, Insights and Forecast, 2020-2032
- 9.1. Market Analysis, Insights and Forecast - by Product Type
- 9.1.1. Telemedicine
- 9.1.2. Electronic Health Records
- 9.1.3. mHealth
- 9.1.4. Smart Pills and Syringes
- 9.1.5. Smart RFID Cabinets
- 9.1.6. Other Product Types
- 9.2. Market Analysis, Insights and Forecast - by Application
- 9.2.1. Storage and Inventory Management
- 9.2.2. Monitoring
- 9.2.3. Treatment
- 9.2.4. Other Applications
- 9.3. Market Analysis, Insights and Forecast - by End User
- 9.3.1. Hospitals
- 9.3.2. Home Care Settings
- 9.3.3. Other End Users
- 9.1. Market Analysis, Insights and Forecast - by Product Type
- 10. South America Smart Healthcare Market Analysis, Insights and Forecast, 2020-2032
- 10.1. Market Analysis, Insights and Forecast - by Product Type
- 10.1.1. Telemedicine
- 10.1.2. Electronic Health Records
- 10.1.3. mHealth
- 10.1.4. Smart Pills and Syringes
- 10.1.5. Smart RFID Cabinets
- 10.1.6. Other Product Types
- 10.2. Market Analysis, Insights and Forecast - by Application
- 10.2.1. Storage and Inventory Management
- 10.2.2. Monitoring
- 10.2.3. Treatment
- 10.2.4. Other Applications
- 10.3. Market Analysis, Insights and Forecast - by End User
- 10.3.1. Hospitals
- 10.3.2. Home Care Settings
- 10.3.3. Other End Users
- 10.1. Market Analysis, Insights and Forecast - by Product Type
- 11. Competitive Analysis
- 11.1. Global Market Share Analysis 2025
- 11.2. Company Profiles
- 11.2.1 Medtronic (Given Imaging Inc )
- 11.2.1.1. Overview
- 11.2.1.2. Products
- 11.2.1.3. SWOT Analysis
- 11.2.1.4. Recent Developments
- 11.2.1.5. Financials (Based on Availability)
- 11.2.2 Life Sense
- 11.2.2.1. Overview
- 11.2.2.2. Products
- 11.2.2.3. SWOT Analysis
- 11.2.2.4. Recent Developments
- 11.2.2.5. Financials (Based on Availability)
- 11.2.3 Oracle Corporation (Cerner Corporation)
- 11.2.3.1. Overview
- 11.2.3.2. Products
- 11.2.3.3. SWOT Analysis
- 11.2.3.4. Recent Developments
- 11.2.3.5. Financials (Based on Availability)
- 11.2.4 GE Healthcare
- 11.2.4.1. Overview
- 11.2.4.2. Products
- 11.2.4.3. SWOT Analysis
- 11.2.4.4. Recent Developments
- 11.2.4.5. Financials (Based on Availability)
- 11.2.5 Abbott Laboratories
- 11.2.5.1. Overview
- 11.2.5.2. Products
- 11.2.5.3. SWOT Analysis
- 11.2.5.4. Recent Developments
- 11.2.5.5. Financials (Based on Availability)
- 11.2.6 Siemens Healthineers AG
- 11.2.6.1. Overview
- 11.2.6.2. Products
- 11.2.6.3. SWOT Analysis
- 11.2.6.4. Recent Developments
- 11.2.6.5. Financials (Based on Availability)
- 11.2.7 Next Gen Healthcare
- 11.2.7.1. Overview
- 11.2.7.2. Products
- 11.2.7.3. SWOT Analysis
- 11.2.7.4. Recent Developments
- 11.2.7.5. Financials (Based on Availability)
- 11.2.8 Koninklijke Philips NV
- 11.2.8.1. Overview
- 11.2.8.2. Products
- 11.2.8.3. SWOT Analysis
- 11.2.8.4. Recent Developments
- 11.2.8.5. Financials (Based on Availability)
- 11.2.9 McKesson Corporation
- 11.2.9.1. Overview
- 11.2.9.2. Products
- 11.2.9.3. SWOT Analysis
- 11.2.9.4. Recent Developments
- 11.2.9.5. Financials (Based on Availability)
- 11.2.10 Olympus Corporation
- 11.2.10.1. Overview
- 11.2.10.2. Products
- 11.2.10.3. SWOT Analysis
- 11.2.10.4. Recent Developments
- 11.2.10.5. Financials (Based on Availability)
- 11.2.11 Capsule Technologies Inc
- 11.2.11.1. Overview
- 11.2.11.2. Products
- 11.2.11.3. SWOT Analysis
- 11.2.11.4. Recent Developments
- 11.2.11.5. Financials (Based on Availability)
- 11.2.12 Samsung Healthcare
- 11.2.12.1. Overview
- 11.2.12.2. Products
- 11.2.12.3. SWOT Analysis
- 11.2.12.4. Recent Developments
- 11.2.12.5. Financials (Based on Availability)
- 11.2.1 Medtronic (Given Imaging Inc )
List of Figures
- Figure 1: Global Smart Healthcare Market Revenue Breakdown (billion, %) by Region 2025 & 2033
- Figure 2: Global Smart Healthcare Market Volume Breakdown (K Unit, %) by Region 2025 & 2033
- Figure 3: North America Smart Healthcare Market Revenue (billion), by Product Type 2025 & 2033
- Figure 4: North America Smart Healthcare Market Volume (K Unit), by Product Type 2025 & 2033
- Figure 5: North America Smart Healthcare Market Revenue Share (%), by Product Type 2025 & 2033
- Figure 6: North America Smart Healthcare Market Volume Share (%), by Product Type 2025 & 2033
- Figure 7: North America Smart Healthcare Market Revenue (billion), by Application 2025 & 2033
- Figure 8: North America Smart Healthcare Market Volume (K Unit), by Application 2025 & 2033
- Figure 9: North America Smart Healthcare Market Revenue Share (%), by Application 2025 & 2033
- Figure 10: North America Smart Healthcare Market Volume Share (%), by Application 2025 & 2033
- Figure 11: North America Smart Healthcare Market Revenue (billion), by End User 2025 & 2033
- Figure 12: North America Smart Healthcare Market Volume (K Unit), by End User 2025 & 2033
- Figure 13: North America Smart Healthcare Market Revenue Share (%), by End User 2025 & 2033
- Figure 14: North America Smart Healthcare Market Volume Share (%), by End User 2025 & 2033
- Figure 15: North America Smart Healthcare Market Revenue (billion), by Country 2025 & 2033
- Figure 16: North America Smart Healthcare Market Volume (K Unit), by Country 2025 & 2033
- Figure 17: North America Smart Healthcare Market Revenue Share (%), by Country 2025 & 2033
- Figure 18: North America Smart Healthcare Market Volume Share (%), by Country 2025 & 2033
- Figure 19: Europe Smart Healthcare Market Revenue (billion), by Product Type 2025 & 2033
- Figure 20: Europe Smart Healthcare Market Volume (K Unit), by Product Type 2025 & 2033
- Figure 21: Europe Smart Healthcare Market Revenue Share (%), by Product Type 2025 & 2033
- Figure 22: Europe Smart Healthcare Market Volume Share (%), by Product Type 2025 & 2033
- Figure 23: Europe Smart Healthcare Market Revenue (billion), by Application 2025 & 2033
- Figure 24: Europe Smart Healthcare Market Volume (K Unit), by Application 2025 & 2033
- Figure 25: Europe Smart Healthcare Market Revenue Share (%), by Application 2025 & 2033
- Figure 26: Europe Smart Healthcare Market Volume Share (%), by Application 2025 & 2033
- Figure 27: Europe Smart Healthcare Market Revenue (billion), by End User 2025 & 2033
- Figure 28: Europe Smart Healthcare Market Volume (K Unit), by End User 2025 & 2033
- Figure 29: Europe Smart Healthcare Market Revenue Share (%), by End User 2025 & 2033
- Figure 30: Europe Smart Healthcare Market Volume Share (%), by End User 2025 & 2033
- Figure 31: Europe Smart Healthcare Market Revenue (billion), by Country 2025 & 2033
- Figure 32: Europe Smart Healthcare Market Volume (K Unit), by Country 2025 & 2033
- Figure 33: Europe Smart Healthcare Market Revenue Share (%), by Country 2025 & 2033
- Figure 34: Europe Smart Healthcare Market Volume Share (%), by Country 2025 & 2033
- Figure 35: Asia Pacific Smart Healthcare Market Revenue (billion), by Product Type 2025 & 2033
- Figure 36: Asia Pacific Smart Healthcare Market Volume (K Unit), by Product Type 2025 & 2033
- Figure 37: Asia Pacific Smart Healthcare Market Revenue Share (%), by Product Type 2025 & 2033
- Figure 38: Asia Pacific Smart Healthcare Market Volume Share (%), by Product Type 2025 & 2033
- Figure 39: Asia Pacific Smart Healthcare Market Revenue (billion), by Application 2025 & 2033
- Figure 40: Asia Pacific Smart Healthcare Market Volume (K Unit), by Application 2025 & 2033
- Figure 41: Asia Pacific Smart Healthcare Market Revenue Share (%), by Application 2025 & 2033
- Figure 42: Asia Pacific Smart Healthcare Market Volume Share (%), by Application 2025 & 2033
- Figure 43: Asia Pacific Smart Healthcare Market Revenue (billion), by End User 2025 & 2033
- Figure 44: Asia Pacific Smart Healthcare Market Volume (K Unit), by End User 2025 & 2033
- Figure 45: Asia Pacific Smart Healthcare Market Revenue Share (%), by End User 2025 & 2033
- Figure 46: Asia Pacific Smart Healthcare Market Volume Share (%), by End User 2025 & 2033
- Figure 47: Asia Pacific Smart Healthcare Market Revenue (billion), by Country 2025 & 2033
- Figure 48: Asia Pacific Smart Healthcare Market Volume (K Unit), by Country 2025 & 2033
- Figure 49: Asia Pacific Smart Healthcare Market Revenue Share (%), by Country 2025 & 2033
- Figure 50: Asia Pacific Smart Healthcare Market Volume Share (%), by Country 2025 & 2033
- Figure 51: Middle East and Africa Smart Healthcare Market Revenue (billion), by Product Type 2025 & 2033
- Figure 52: Middle East and Africa Smart Healthcare Market Volume (K Unit), by Product Type 2025 & 2033
- Figure 53: Middle East and Africa Smart Healthcare Market Revenue Share (%), by Product Type 2025 & 2033
- Figure 54: Middle East and Africa Smart Healthcare Market Volume Share (%), by Product Type 2025 & 2033
- Figure 55: Middle East and Africa Smart Healthcare Market Revenue (billion), by Application 2025 & 2033
- Figure 56: Middle East and Africa Smart Healthcare Market Volume (K Unit), by Application 2025 & 2033
- Figure 57: Middle East and Africa Smart Healthcare Market Revenue Share (%), by Application 2025 & 2033
- Figure 58: Middle East and Africa Smart Healthcare Market Volume Share (%), by Application 2025 & 2033
- Figure 59: Middle East and Africa Smart Healthcare Market Revenue (billion), by End User 2025 & 2033
- Figure 60: Middle East and Africa Smart Healthcare Market Volume (K Unit), by End User 2025 & 2033
- Figure 61: Middle East and Africa Smart Healthcare Market Revenue Share (%), by End User 2025 & 2033
- Figure 62: Middle East and Africa Smart Healthcare Market Volume Share (%), by End User 2025 & 2033
- Figure 63: Middle East and Africa Smart Healthcare Market Revenue (billion), by Country 2025 & 2033
- Figure 64: Middle East and Africa Smart Healthcare Market Volume (K Unit), by Country 2025 & 2033
- Figure 65: Middle East and Africa Smart Healthcare Market Revenue Share (%), by Country 2025 & 2033
- Figure 66: Middle East and Africa Smart Healthcare Market Volume Share (%), by Country 2025 & 2033
- Figure 67: South America Smart Healthcare Market Revenue (billion), by Product Type 2025 & 2033
- Figure 68: South America Smart Healthcare Market Volume (K Unit), by Product Type 2025 & 2033
- Figure 69: South America Smart Healthcare Market Revenue Share (%), by Product Type 2025 & 2033
- Figure 70: South America Smart Healthcare Market Volume Share (%), by Product Type 2025 & 2033
- Figure 71: South America Smart Healthcare Market Revenue (billion), by Application 2025 & 2033
- Figure 72: South America Smart Healthcare Market Volume (K Unit), by Application 2025 & 2033
- Figure 73: South America Smart Healthcare Market Revenue Share (%), by Application 2025 & 2033
- Figure 74: South America Smart Healthcare Market Volume Share (%), by Application 2025 & 2033
- Figure 75: South America Smart Healthcare Market Revenue (billion), by End User 2025 & 2033
- Figure 76: South America Smart Healthcare Market Volume (K Unit), by End User 2025 & 2033
- Figure 77: South America Smart Healthcare Market Revenue Share (%), by End User 2025 & 2033
- Figure 78: South America Smart Healthcare Market Volume Share (%), by End User 2025 & 2033
- Figure 79: South America Smart Healthcare Market Revenue (billion), by Country 2025 & 2033
- Figure 80: South America Smart Healthcare Market Volume (K Unit), by Country 2025 & 2033
- Figure 81: South America Smart Healthcare Market Revenue Share (%), by Country 2025 & 2033
- Figure 82: South America Smart Healthcare Market Volume Share (%), by Country 2025 & 2033
List of Tables
- Table 1: Global Smart Healthcare Market Revenue billion Forecast, by Product Type 2020 & 2033
- Table 2: Global Smart Healthcare Market Volume K Unit Forecast, by Product Type 2020 & 2033
- Table 3: Global Smart Healthcare Market Revenue billion Forecast, by Application 2020 & 2033
- Table 4: Global Smart Healthcare Market Volume K Unit Forecast, by Application 2020 & 2033
- Table 5: Global Smart Healthcare Market Revenue billion Forecast, by End User 2020 & 2033
- Table 6: Global Smart Healthcare Market Volume K Unit Forecast, by End User 2020 & 2033
- Table 7: Global Smart Healthcare Market Revenue billion Forecast, by Region 2020 & 2033
- Table 8: Global Smart Healthcare Market Volume K Unit Forecast, by Region 2020 & 2033
- Table 9: Global Smart Healthcare Market Revenue billion Forecast, by Product Type 2020 & 2033
- Table 10: Global Smart Healthcare Market Volume K Unit Forecast, by Product Type 2020 & 2033
- Table 11: Global Smart Healthcare Market Revenue billion Forecast, by Application 2020 & 2033
- Table 12: Global Smart Healthcare Market Volume K Unit Forecast, by Application 2020 & 2033
- Table 13: Global Smart Healthcare Market Revenue billion Forecast, by End User 2020 & 2033
- Table 14: Global Smart Healthcare Market Volume K Unit Forecast, by End User 2020 & 2033
- Table 15: Global Smart Healthcare Market Revenue billion Forecast, by Country 2020 & 2033
- Table 16: Global Smart Healthcare Market Volume K Unit Forecast, by Country 2020 & 2033
- Table 17: United States Smart Healthcare Market Revenue (billion) Forecast, by Application 2020 & 2033
- Table 18: United States Smart Healthcare Market Volume (K Unit) Forecast, by Application 2020 & 2033
- Table 19: Canada Smart Healthcare Market Revenue (billion) Forecast, by Application 2020 & 2033
- Table 20: Canada Smart Healthcare Market Volume (K Unit) Forecast, by Application 2020 & 2033
- Table 21: Mexico Smart Healthcare Market Revenue (billion) Forecast, by Application 2020 & 2033
- Table 22: Mexico Smart Healthcare Market Volume (K Unit) Forecast, by Application 2020 & 2033
- Table 23: Global Smart Healthcare Market Revenue billion Forecast, by Product Type 2020 & 2033
- Table 24: Global Smart Healthcare Market Volume K Unit Forecast, by Product Type 2020 & 2033
- Table 25: Global Smart Healthcare Market Revenue billion Forecast, by Application 2020 & 2033
- Table 26: Global Smart Healthcare Market Volume K Unit Forecast, by Application 2020 & 2033
- Table 27: Global Smart Healthcare Market Revenue billion Forecast, by End User 2020 & 2033
- Table 28: Global Smart Healthcare Market Volume K Unit Forecast, by End User 2020 & 2033
- Table 29: Global Smart Healthcare Market Revenue billion Forecast, by Country 2020 & 2033
- Table 30: Global Smart Healthcare Market Volume K Unit Forecast, by Country 2020 & 2033
- Table 31: Germany Smart Healthcare Market Revenue (billion) Forecast, by Application 2020 & 2033
- Table 32: Germany Smart Healthcare Market Volume (K Unit) Forecast, by Application 2020 & 2033
- Table 33: United Kingdom Smart Healthcare Market Revenue (billion) Forecast, by Application 2020 & 2033
- Table 34: United Kingdom Smart Healthcare Market Volume (K Unit) Forecast, by Application 2020 & 2033
- Table 35: France Smart Healthcare Market Revenue (billion) Forecast, by Application 2020 & 2033
- Table 36: France Smart Healthcare Market Volume (K Unit) Forecast, by Application 2020 & 2033
- Table 37: Spain Smart Healthcare Market Revenue (billion) Forecast, by Application 2020 & 2033
- Table 38: Spain Smart Healthcare Market Volume (K Unit) Forecast, by Application 2020 & 2033
- Table 39: Italy Smart Healthcare Market Revenue (billion) Forecast, by Application 2020 & 2033
- Table 40: Italy Smart Healthcare Market Volume (K Unit) Forecast, by Application 2020 & 2033
- Table 41: Rest of Europe Smart Healthcare Market Revenue (billion) Forecast, by Application 2020 & 2033
- Table 42: Rest of Europe Smart Healthcare Market Volume (K Unit) Forecast, by Application 2020 & 2033
- Table 43: Global Smart Healthcare Market Revenue billion Forecast, by Product Type 2020 & 2033
- Table 44: Global Smart Healthcare Market Volume K Unit Forecast, by Product Type 2020 & 2033
- Table 45: Global Smart Healthcare Market Revenue billion Forecast, by Application 2020 & 2033
- Table 46: Global Smart Healthcare Market Volume K Unit Forecast, by Application 2020 & 2033
- Table 47: Global Smart Healthcare Market Revenue billion Forecast, by End User 2020 & 2033
- Table 48: Global Smart Healthcare Market Volume K Unit Forecast, by End User 2020 & 2033
- Table 49: Global Smart Healthcare Market Revenue billion Forecast, by Country 2020 & 2033
- Table 50: Global Smart Healthcare Market Volume K Unit Forecast, by Country 2020 & 2033
- Table 51: China Smart Healthcare Market Revenue (billion) Forecast, by Application 2020 & 2033
- Table 52: China Smart Healthcare Market Volume (K Unit) Forecast, by Application 2020 & 2033
- Table 53: Japan Smart Healthcare Market Revenue (billion) Forecast, by Application 2020 & 2033
- Table 54: Japan Smart Healthcare Market Volume (K Unit) Forecast, by Application 2020 & 2033
- Table 55: India Smart Healthcare Market Revenue (billion) Forecast, by Application 2020 & 2033
- Table 56: India Smart Healthcare Market Volume (K Unit) Forecast, by Application 2020 & 2033
- Table 57: Australia Smart Healthcare Market Revenue (billion) Forecast, by Application 2020 & 2033
- Table 58: Australia Smart Healthcare Market Volume (K Unit) Forecast, by Application 2020 & 2033
- Table 59: South Korea Smart Healthcare Market Revenue (billion) Forecast, by Application 2020 & 2033
- Table 60: South Korea Smart Healthcare Market Volume (K Unit) Forecast, by Application 2020 & 2033
- Table 61: Rest of Asia Pacific Smart Healthcare Market Revenue (billion) Forecast, by Application 2020 & 2033
- Table 62: Rest of Asia Pacific Smart Healthcare Market Volume (K Unit) Forecast, by Application 2020 & 2033
- Table 63: Global Smart Healthcare Market Revenue billion Forecast, by Product Type 2020 & 2033
- Table 64: Global Smart Healthcare Market Volume K Unit Forecast, by Product Type 2020 & 2033
- Table 65: Global Smart Healthcare Market Revenue billion Forecast, by Application 2020 & 2033
- Table 66: Global Smart Healthcare Market Volume K Unit Forecast, by Application 2020 & 2033
- Table 67: Global Smart Healthcare Market Revenue billion Forecast, by End User 2020 & 2033
- Table 68: Global Smart Healthcare Market Volume K Unit Forecast, by End User 2020 & 2033
- Table 69: Global Smart Healthcare Market Revenue billion Forecast, by Country 2020 & 2033
- Table 70: Global Smart Healthcare Market Volume K Unit Forecast, by Country 2020 & 2033
- Table 71: GCC Smart Healthcare Market Revenue (billion) Forecast, by Application 2020 & 2033
- Table 72: GCC Smart Healthcare Market Volume (K Unit) Forecast, by Application 2020 & 2033
- Table 73: South Africa Smart Healthcare Market Revenue (billion) Forecast, by Application 2020 & 2033
- Table 74: South Africa Smart Healthcare Market Volume (K Unit) Forecast, by Application 2020 & 2033
- Table 75: Rest of Middle East and Africa Smart Healthcare Market Revenue (billion) Forecast, by Application 2020 & 2033
- Table 76: Rest of Middle East and Africa Smart Healthcare Market Volume (K Unit) Forecast, by Application 2020 & 2033
- Table 77: Global Smart Healthcare Market Revenue billion Forecast, by Product Type 2020 & 2033
- Table 78: Global Smart Healthcare Market Volume K Unit Forecast, by Product Type 2020 & 2033
- Table 79: Global Smart Healthcare Market Revenue billion Forecast, by Application 2020 & 2033
- Table 80: Global Smart Healthcare Market Volume K Unit Forecast, by Application 2020 & 2033
- Table 81: Global Smart Healthcare Market Revenue billion Forecast, by End User 2020 & 2033
- Table 82: Global Smart Healthcare Market Volume K Unit Forecast, by End User 2020 & 2033
- Table 83: Global Smart Healthcare Market Revenue billion Forecast, by Country 2020 & 2033
- Table 84: Global Smart Healthcare Market Volume K Unit Forecast, by Country 2020 & 2033
- Table 85: Brazil Smart Healthcare Market Revenue (billion) Forecast, by Application 2020 & 2033
- Table 86: Brazil Smart Healthcare Market Volume (K Unit) Forecast, by Application 2020 & 2033
- Table 87: Argentina Smart Healthcare Market Revenue (billion) Forecast, by Application 2020 & 2033
- Table 88: Argentina Smart Healthcare Market Volume (K Unit) Forecast, by Application 2020 & 2033
- Table 89: Rest of South America Smart Healthcare Market Revenue (billion) Forecast, by Application 2020 & 2033
- Table 90: Rest of South America Smart Healthcare Market Volume (K Unit) Forecast, by Application 2020 & 2033
Frequently Asked Questions
1. What is the projected Compound Annual Growth Rate (CAGR) of the Smart Healthcare Market?
The projected CAGR is approximately 13.41%.
2. Which companies are prominent players in the Smart Healthcare Market?
Key companies in the market include Medtronic (Given Imaging Inc ), Life Sense, Oracle Corporation (Cerner Corporation), GE Healthcare, Abbott Laboratories, Siemens Healthineers AG, Next Gen Healthcare, Koninklijke Philips NV, McKesson Corporation, Olympus Corporation, Capsule Technologies Inc , Samsung Healthcare.
3. What are the main segments of the Smart Healthcare Market?
The market segments include Product Type, Application, End User.
4. Can you provide details about the market size?
The market size is estimated to be USD 252.39 billion as of 2022.
5. What are some drivers contributing to market growth?
Technological Advancements in Smart Healthcare Products; Booming Internet of Things (IoT) in the Healthcare Industry.
6. What are the notable trends driving market growth?
The mHealth Segment is Expected to Observe Good Growth in the Market.
7. Are there any restraints impacting market growth?
High Cost of Smart Healthcare Products.
8. Can you provide examples of recent developments in the market?
In March 2022, Intuitive MB launched its medical building operating system, which uses the Internet of Things (IoT), artificial intelligence (AI), and machine learning technologies to create "smart" hospitals and medical office buildings.
9. What pricing options are available for accessing the report?
Pricing options include single-user, multi-user, and enterprise licenses priced at USD 4750, USD 5250, and USD 8750 respectively.
10. Is the market size provided in terms of value or volume?
The market size is provided in terms of value, measured in billion and volume, measured in K Unit.
11. Are there any specific market keywords associated with the report?
Yes, the market keyword associated with the report is "Smart Healthcare Market," which aids in identifying and referencing the specific market segment covered.
12. How do I determine which pricing option suits my needs best?
The pricing options vary based on user requirements and access needs. Individual users may opt for single-user licenses, while businesses requiring broader access may choose multi-user or enterprise licenses for cost-effective access to the report.
13. Are there any additional resources or data provided in the Smart Healthcare Market report?
While the report offers comprehensive insights, it's advisable to review the specific contents or supplementary materials provided to ascertain if additional resources or data are available.
14. How can I stay updated on further developments or reports in the Smart Healthcare Market?
To stay informed about further developments, trends, and reports in the Smart Healthcare Market, consider subscribing to industry newsletters, following relevant companies and organizations, or regularly checking reputable industry news sources and publications.
Methodology
Step 1 - Identification of Relevant Samples Size from Population Database


Step 2 - Approaches for Defining Global Market Size (Value, Volume* & Price*)

Note*: In applicable scenarios
Step 3 - Data Sources
Primary Research
- Web Analytics
- Survey Reports
- Research Institute
- Latest Research Reports
- Opinion Leaders
Secondary Research
- Annual Reports
- White Paper
- Latest Press Release
- Industry Association
- Paid Database
- Investor Presentations

Step 4 - Data Triangulation
Involves using different sources of information in order to increase the validity of a study
These sources are likely to be stakeholders in a program - participants, other researchers, program staff, other community members, and so on.
Then we put all data in single framework & apply various statistical tools to find out the dynamic on the market.
During the analysis stage, feedback from the stakeholder groups would be compared to determine areas of agreement as well as areas of divergence