Key Insights
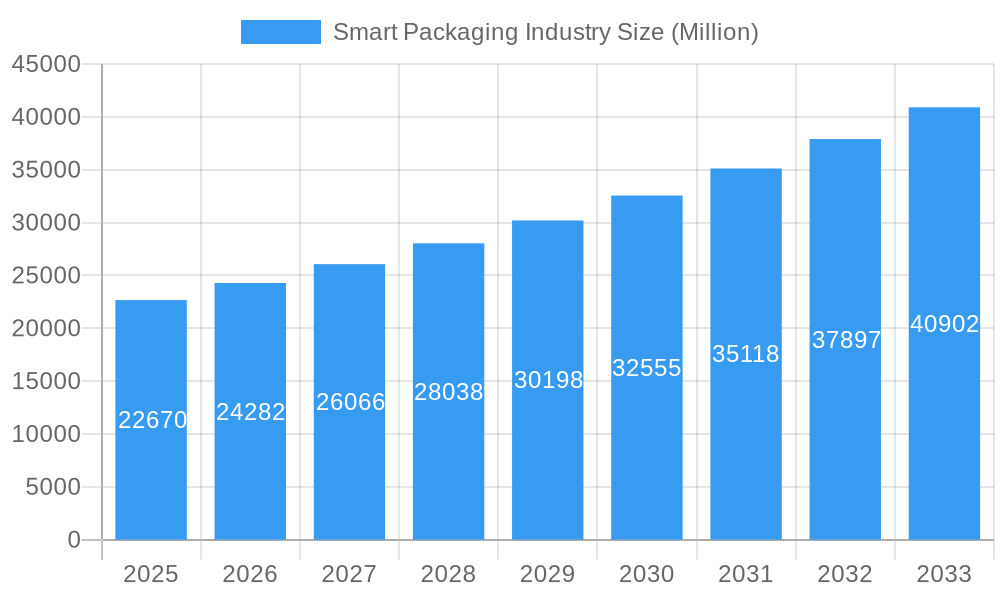
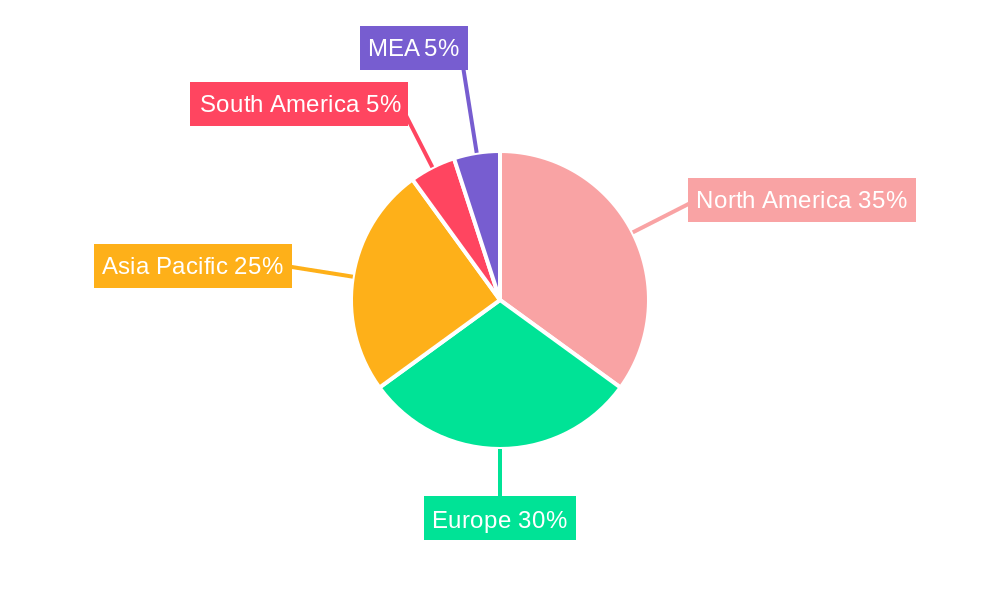
The smart packaging market, valued at $22.67 billion in 2025, is experiencing robust growth, projected to expand at a compound annual growth rate (CAGR) of 7.12% from 2025 to 2033. This growth is driven by several key factors. Increasing consumer demand for convenience, enhanced product safety, and improved supply chain traceability are fueling the adoption of active and intelligent packaging solutions. E-commerce expansion and the need for efficient logistics are also significant contributors. The food and beverage sector currently dominates the end-user landscape, benefiting from technologies that extend shelf life and maintain product freshness. However, significant growth potential exists within the healthcare and personal care sectors, driven by the need for tamper-evident packaging and enhanced medication management systems. While challenges remain, such as the high initial investment costs associated with implementing smart packaging technologies and consumer awareness and acceptance, ongoing technological advancements and the development of cost-effective solutions are mitigating these restraints. The competitive landscape is characterized by a mix of established packaging material manufacturers and technology providers, fostering innovation and driving market expansion. Geographic growth is expected across all regions, with North America and Europe maintaining substantial market shares, while Asia-Pacific demonstrates the highest growth potential due to rising consumer spending and industrialization.
Smart Packaging Industry Market Size (In Billion)
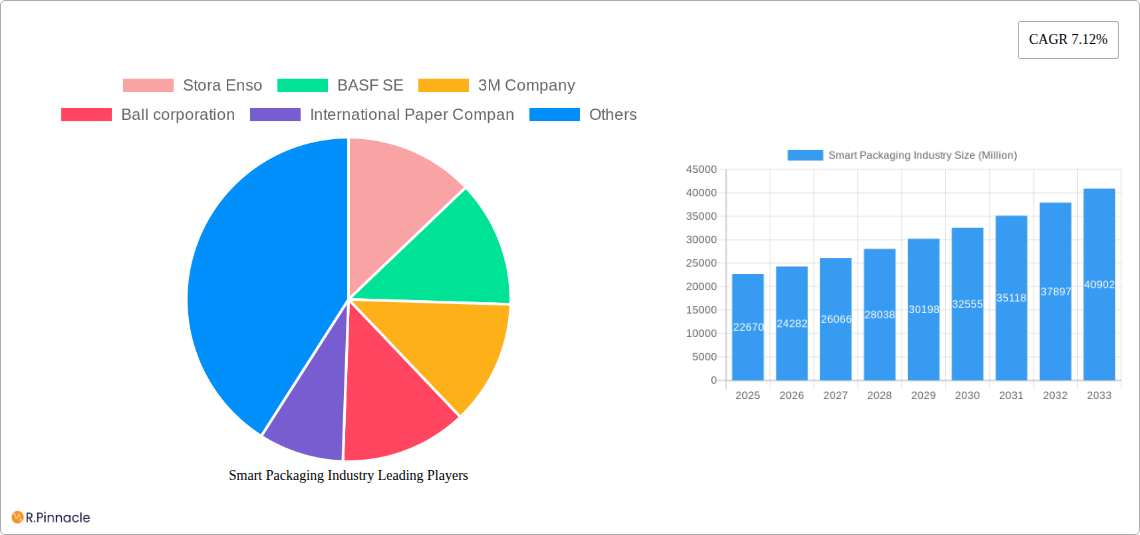
The competitive landscape is fiercely contested, with key players such as Stora Enso, BASF SE, 3M Company, Ball Corporation, International Paper Company, Amcor PLC, Avery Dennison Corporation, Huhtamaki OYJ, Zebra Technologies Corporation, and Sealed Air Corporation vying for market share through product innovation, strategic partnerships, and geographic expansion. The market is segmented by technology (active and intelligent packaging) and end-user vertical (food, beverage, healthcare, personal care, and others). Active packaging, focusing on extending shelf life and maintaining product quality, currently holds a larger market share. However, intelligent packaging, leveraging technologies like RFID and sensors for enhanced traceability and consumer engagement, is witnessing rapid growth and is expected to gain significant traction in the coming years, driven by increasing demand for supply chain visibility and brand authenticity. Market expansion will be influenced by regulatory changes, consumer preferences, and the continuous evolution of packaging technologies.
Smart Packaging Industry Company Market Share
Smart Packaging Industry Market Report: 2019-2033
This comprehensive report provides a detailed analysis of the global smart packaging market, offering invaluable insights for industry professionals, investors, and stakeholders. With a study period spanning 2019-2033, a base year of 2025, and a forecast period of 2025-2033, this report delivers crucial data for strategic decision-making. The market is segmented by technology (Active and Intelligent Packaging) and end-user vertical (Food, Beverage, Healthcare, Personal Care, and Other). The report projects a market valued at xx Million by 2033, exhibiting a robust CAGR of xx%.
Smart Packaging Industry Market Structure & Innovation Trends
The smart packaging market is characterized by a blend of consolidation and burgeoning innovation. While established giants like Amcor PLC, Stora Enso, and 3M Company continue to hold substantial influence, commanding an estimated xx% of the global market share in 2025, a vibrant ecosystem of agile, specialized firms is increasingly carving out niches with cutting-edge technologies. This dynamic interplay fuels continuous innovation, driven by several pivotal factors:
- Sustainability Imperative: A significant catalyst is the escalating consumer and regulatory demand for environmentally responsible packaging. This is spurring intense research and development into advanced biodegradable, compostable, and recyclable smart materials, alongside solutions that minimize packaging footprint.
- Ubiquitous Sensor Integration: The miniaturization and cost-effectiveness of sensor technologies are enabling real-time, granular monitoring of product conditions. This includes tracking temperature, humidity, shock, and even gas levels, crucial for preserving product integrity and extending shelf life, particularly for sensitive goods like pharmaceuticals and fresh produce.
- Digital Transformation through RFID and Enhanced Printing: The widespread adoption of Radio-Frequency Identification (RFID) tags and sophisticated digital printing techniques is revolutionizing supply chain visibility and brand interaction. These technologies facilitate seamless track-and-trace capabilities, counterfeit prevention, and offer dynamic platforms for consumer engagement through augmented reality or personalized information delivery.
Navigating a complex landscape, regulatory frameworks, particularly those emphasizing sustainability mandates and stringent food safety standards, are profoundly shaping market trajectories. While traditional packaging remains a substitute, the inherent advantages of smart packaging—encompassing superior product quality preservation, significant waste reduction, and a markedly enhanced consumer experience—are proving to be powerful growth differentiators. The sector is also witnessing a surge in Mergers and Acquisitions (M&A), with cumulative deal values exceeding xx Million over the past five years. This heightened M&A activity, exemplified by the strategic xx Million acquisition of Company X by Company Y in [Year], underscores the market's dynamism and its potential for further consolidation as key players seek to expand their technological portfolios and market reach.
Smart Packaging Industry Market Dynamics & Trends
The smart packaging market is experiencing a period of robust and accelerated growth. This expansion is intrinsically linked to evolving consumer expectations for convenience, paramount product safety, and increasingly engaging brand experiences. Across diverse end-user industries, the adoption of smart packaging is becoming a strategic imperative. Technological breakthroughs, including the maturation of advanced sensor technologies, the pervasive integration of RFID, and the seamless incorporation of the Internet of Things (IoT), are acting as powerful accelerators for market penetration. Simultaneously, a pronounced shift in consumer preferences towards sustainable and transparent packaging solutions is creating fertile ground for the development and uptake of eco-conscious smart packaging alternatives. Market penetration is steadily advancing, with particularly strong traction observed in developed economies. The competitive landscape is defined by relentless innovation, the formation of strategic alliances, and dynamic M&A activity. Projections indicate the market is poised to achieve a Compound Annual Growth Rate (CAGR) of xx% during the forecast period, largely propelled by sustained consumer demand and ongoing technological advancements. Nevertheless, potential headwinds such as volatile raw material prices and broader economic uncertainties warrant careful consideration and contingency planning.
Dominant Regions & Segments in Smart Packaging Industry
North America currently holds the largest market share in the smart packaging industry, driven by high consumer disposable income, advanced infrastructure, and a strong focus on product safety and traceability. Within the technology segments, intelligent packaging, incorporating features like RFID and sensors, is experiencing faster growth compared to active packaging. The food and beverage industry is the dominant end-user vertical, with healthcare following closely.
- Key Drivers in North America:
- Strong regulatory support for food safety and traceability.
- High adoption of advanced technologies.
- Well-established supply chains.
- Key Drivers in Europe:
- Growing emphasis on sustainability.
- Stringent environmental regulations.
- Well-developed logistics infrastructure.
- High consumer awareness of environmental issues.
The Asia-Pacific region is expected to show significant growth in the coming years, driven by rapid economic expansion, rising middle-class disposable incomes, and increasing demand for packaged goods.
Smart Packaging Industry Product Innovations
Recent innovations encompass the development of biodegradable and compostable smart packaging materials, integration of advanced sensor technologies for real-time product monitoring, and the use of digital printing for personalized branding and enhanced consumer engagement. These innovations offer significant competitive advantages, including enhanced product safety, reduced waste, and improved brand loyalty. The market is also seeing the emergence of smart packaging solutions that integrate with mobile applications, providing consumers with product information and traceability details.
Report Scope & Segmentation Analysis
This report comprehensively segments the smart packaging market by technology (Active Packaging and Intelligent Packaging) and end-user vertical (Food, Beverage, Healthcare, Personal Care, and Other).
By Technology:
- Active Packaging: This segment is projected to reach xx Million by 2033, driven by increasing demand for extended shelf life and improved product freshness. The competitive landscape is moderately fragmented.
- Intelligent Packaging: This segment is expected to grow at a faster rate, reaching xx Million by 2033, driven by rising adoption of RFID and sensor technologies for enhanced traceability and brand interaction. The market is characterized by increased competition from both established players and new entrants.
By End-User Vertical:
Each segment (Food, Beverage, Healthcare, Personal Care, Other) will be analyzed individually with growth projections and competitive landscape information provided for each.
Key Drivers of Smart Packaging Industry Growth
The relentless advancement of technology, particularly in the realms of sophisticated sensor development, ubiquitous RFID integration, and precision digital printing, stands as a cornerstone of smart packaging's growth. Complementing these technological leaps are compelling economic factors. Rising disposable incomes in burgeoning emerging markets, coupled with an overall increase in consumer expenditure on packaged goods, are creating a significant demand base. Furthermore, the increasing stringency of food safety regulations worldwide, alongside a growing and vocal consumer demand for packaging that is both sustainable and environmentally friendly, are acting as powerful catalysts, accelerating the adoption and innovation within the smart packaging sector.
Challenges in the Smart Packaging Industry Sector
Despite its promising trajectory, the smart packaging industry encounters several significant hurdles. The substantial initial capital outlay required for implementing advanced smart packaging technologies can be a formidable barrier, particularly for small to medium-sized enterprises. Moreover, the intricate process of integrating these novel technologies seamlessly into established, often complex, supply chain infrastructures presents considerable operational challenges. Regulatory complexities, including evolving material safety standards and growing concerns around data privacy and security associated with connected packaging, can also impede market expansion. Intensifying competitive pressures and a pervasive price sensitivity in certain market segments further contribute to limiting the industry's overall growth potential. The cumulative impact of these factors is estimated to potentially restrain market expansion by approximately xx% over the forecast period.
Emerging Opportunities in Smart Packaging Industry
The emergence of new materials, such as biodegradable and compostable options, presents significant opportunities. Integration with IoT and blockchain technology holds the potential to further enhance traceability and product security. Growing consumer demand for personalized and customized packaging opens new avenues for product innovation and market expansion.
Leading Players in the Smart Packaging Industry Market
Key Developments in Smart Packaging Industry
- January 2023: Avery Dennison announced a major investment exceeding USD 100 Million to expand its RFID manufacturing capacity in Mexico, aiming to become the world's largest RFID provider and create a more connected supply chain.
- March 2023: Amcor partnered with NfiniteNanotechnology Inc. on a research project to validate nanocoating technology for improved recyclable and compostable packaging.
Future Outlook for Smart Packaging Industry Market
The smart packaging market is poised for significant growth, driven by continued technological innovation, increasing consumer demand for sustainable and convenient packaging solutions, and expanding adoption across various industries. Strategic partnerships, M&A activity, and investments in research and development will further accelerate market expansion, creating substantial opportunities for industry players.
Smart Packaging Industry Segmentation
-
1. Technology
- 1.1. Active Packaging
- 1.2. Intelligent Packaging
-
2. End-user Vertical
- 2.1. Food
- 2.2. Beverage
- 2.3. Healthcare
- 2.4. Personal Care
- 2.5. Other End-user Verticals
Smart Packaging Industry Segmentation By Geography
-
1. North America
- 1.1. United States
- 1.2. Canada
-
2. Europe
- 2.1. Germany
- 2.2. United Kingdom
- 2.3. France
- 2.4. Rest of Europe
-
3. Asia Pacific
- 3.1. China
- 3.2. Japan
- 3.3. India
- 3.4. Rest of Asia Pacific
- 4. Latin America
- 5. Middle East and Africa
Smart Packaging Industry Regional Market Share
Geographic Coverage of Smart Packaging Industry
Smart Packaging Industry REPORT HIGHLIGHTS
| Aspects | Details |
|---|---|
| Study Period | 2020-2034 |
| Base Year | 2025 |
| Estimated Year | 2026 |
| Forecast Period | 2026-2034 |
| Historical Period | 2020-2025 |
| Growth Rate | CAGR of 7.12% from 2020-2034 |
| Segmentation |
|
Table of Contents
- 1. Introduction
- 1.1. Research Scope
- 1.2. Market Segmentation
- 1.3. Research Objective
- 1.4. Definitions and Assumptions
- 2. Executive Summary
- 2.1. Market Snapshot
- 3. Market Dynamics
- 3.1. Market Drivers
- 3.2. Market Restrains
- 3.3. Market Trends
- 3.4. Market Opportunities
- 4. Market Factor Analysis
- 4.1. Porters Five Forces
- 4.1.1. Bargaining Power of Suppliers
- 4.1.2. Bargaining Power of Buyers
- 4.1.3. Threat of New Entrants
- 4.1.4. Threat of Substitutes
- 4.1.5. Competitive Rivalry
- 4.2. PESTEL analysis
- 4.3. BCG Analysis
- 4.3.1. Stars (High Growth, High Market Share)
- 4.3.2. Cash Cows (Low Growth, High Market Share)
- 4.3.3. Question Mark (High Growth, Low Market Share)
- 4.3.4. Dogs (Low Growth, Low Market Share)
- 4.4. Ansoff Matrix Analysis
- 4.5. Supply Chain Analysis
- 4.6. Regulatory Landscape
- 4.7. Current Market Potential and Opportunity Assessment (TAM–SAM–SOM Framework)
- 4.8. PRI Analyst Note
- 4.1. Porters Five Forces
- 5. Market Analysis, Insights and Forecast 2021-2033
- 5.1. Market Analysis, Insights and Forecast - by Technology
- 5.1.1. Active Packaging
- 5.1.2. Intelligent Packaging
- 5.2. Market Analysis, Insights and Forecast - by End-user Vertical
- 5.2.1. Food
- 5.2.2. Beverage
- 5.2.3. Healthcare
- 5.2.4. Personal Care
- 5.2.5. Other End-user Verticals
- 5.3. Market Analysis, Insights and Forecast - by Region
- 5.3.1. North America
- 5.3.2. Europe
- 5.3.3. Asia Pacific
- 5.3.4. Latin America
- 5.3.5. Middle East and Africa
- 5.1. Market Analysis, Insights and Forecast - by Technology
- 6. Global Smart Packaging Industry Analysis, Insights and Forecast, 2021-2033
- 6.1. Market Analysis, Insights and Forecast - by Technology
- 6.1.1. Active Packaging
- 6.1.2. Intelligent Packaging
- 6.2. Market Analysis, Insights and Forecast - by End-user Vertical
- 6.2.1. Food
- 6.2.2. Beverage
- 6.2.3. Healthcare
- 6.2.4. Personal Care
- 6.2.5. Other End-user Verticals
- 6.1. Market Analysis, Insights and Forecast - by Technology
- 7. North America Smart Packaging Industry Analysis, Insights and Forecast, 2020-2032
- 7.1. Market Analysis, Insights and Forecast - by Technology
- 7.1.1. Active Packaging
- 7.1.2. Intelligent Packaging
- 7.2. Market Analysis, Insights and Forecast - by End-user Vertical
- 7.2.1. Food
- 7.2.2. Beverage
- 7.2.3. Healthcare
- 7.2.4. Personal Care
- 7.2.5. Other End-user Verticals
- 7.1. Market Analysis, Insights and Forecast - by Technology
- 8. Europe Smart Packaging Industry Analysis, Insights and Forecast, 2020-2032
- 8.1. Market Analysis, Insights and Forecast - by Technology
- 8.1.1. Active Packaging
- 8.1.2. Intelligent Packaging
- 8.2. Market Analysis, Insights and Forecast - by End-user Vertical
- 8.2.1. Food
- 8.2.2. Beverage
- 8.2.3. Healthcare
- 8.2.4. Personal Care
- 8.2.5. Other End-user Verticals
- 8.1. Market Analysis, Insights and Forecast - by Technology
- 9. Asia Pacific Smart Packaging Industry Analysis, Insights and Forecast, 2020-2032
- 9.1. Market Analysis, Insights and Forecast - by Technology
- 9.1.1. Active Packaging
- 9.1.2. Intelligent Packaging
- 9.2. Market Analysis, Insights and Forecast - by End-user Vertical
- 9.2.1. Food
- 9.2.2. Beverage
- 9.2.3. Healthcare
- 9.2.4. Personal Care
- 9.2.5. Other End-user Verticals
- 9.1. Market Analysis, Insights and Forecast - by Technology
- 10. Latin America Smart Packaging Industry Analysis, Insights and Forecast, 2020-2032
- 10.1. Market Analysis, Insights and Forecast - by Technology
- 10.1.1. Active Packaging
- 10.1.2. Intelligent Packaging
- 10.2. Market Analysis, Insights and Forecast - by End-user Vertical
- 10.2.1. Food
- 10.2.2. Beverage
- 10.2.3. Healthcare
- 10.2.4. Personal Care
- 10.2.5. Other End-user Verticals
- 10.1. Market Analysis, Insights and Forecast - by Technology
- 11. Middle East and Africa Smart Packaging Industry Analysis, Insights and Forecast, 2020-2032
- 11.1. Market Analysis, Insights and Forecast - by Technology
- 11.1.1. Active Packaging
- 11.1.2. Intelligent Packaging
- 11.2. Market Analysis, Insights and Forecast - by End-user Vertical
- 11.2.1. Food
- 11.2.2. Beverage
- 11.2.3. Healthcare
- 11.2.4. Personal Care
- 11.2.5. Other End-user Verticals
- 11.1. Market Analysis, Insights and Forecast - by Technology
- 12. Competitive Analysis
- 12.1. Company Profiles
- 12.1.1 Stora Enso
- 12.1.1.1. Company Overview
- 12.1.1.2. Products
- 12.1.1.3. Company Financials
- 12.1.1.4. SWOT Analysis
- 12.1.2 BASF SE
- 12.1.2.1. Company Overview
- 12.1.2.2. Products
- 12.1.2.3. Company Financials
- 12.1.2.4. SWOT Analysis
- 12.1.3 3M Company
- 12.1.3.1. Company Overview
- 12.1.3.2. Products
- 12.1.3.3. Company Financials
- 12.1.3.4. SWOT Analysis
- 12.1.4 Ball corporation
- 12.1.4.1. Company Overview
- 12.1.4.2. Products
- 12.1.4.3. Company Financials
- 12.1.4.4. SWOT Analysis
- 12.1.5 International Paper Compan
- 12.1.5.1. Company Overview
- 12.1.5.2. Products
- 12.1.5.3. Company Financials
- 12.1.5.4. SWOT Analysis
- 12.1.6 Amcor PLC
- 12.1.6.1. Company Overview
- 12.1.6.2. Products
- 12.1.6.3. Company Financials
- 12.1.6.4. SWOT Analysis
- 12.1.7 Avery Dennison Corporation
- 12.1.7.1. Company Overview
- 12.1.7.2. Products
- 12.1.7.3. Company Financials
- 12.1.7.4. SWOT Analysis
- 12.1.8 Huhtamaki OYJ
- 12.1.8.1. Company Overview
- 12.1.8.2. Products
- 12.1.8.3. Company Financials
- 12.1.8.4. SWOT Analysis
- 12.1.9 Zebra Technologies Corporation
- 12.1.9.1. Company Overview
- 12.1.9.2. Products
- 12.1.9.3. Company Financials
- 12.1.9.4. SWOT Analysis
- 12.1.10 Sealed Air Corporation
- 12.1.10.1. Company Overview
- 12.1.10.2. Products
- 12.1.10.3. Company Financials
- 12.1.10.4. SWOT Analysis
- 12.1.1 Stora Enso
- 12.2. Market Entropy
- 12.2.1 Company's Key Areas Served
- 12.2.2 Recent Developments
- 12.3. Company Market Share Analysis 2025
- 12.3.1 Top 5 Companies Market Share Analysis
- 12.3.2 Top 3 Companies Market Share Analysis
- 12.4. List of Potential Customers
- 13. Research Methodology
List of Figures
- Figure 1: Global Smart Packaging Industry Revenue Breakdown (Million, %) by Region 2025 & 2033
- Figure 2: North America Smart Packaging Industry Revenue (Million), by Technology 2025 & 2033
- Figure 3: North America Smart Packaging Industry Revenue Share (%), by Technology 2025 & 2033
- Figure 4: North America Smart Packaging Industry Revenue (Million), by End-user Vertical 2025 & 2033
- Figure 5: North America Smart Packaging Industry Revenue Share (%), by End-user Vertical 2025 & 2033
- Figure 6: North America Smart Packaging Industry Revenue (Million), by Country 2025 & 2033
- Figure 7: North America Smart Packaging Industry Revenue Share (%), by Country 2025 & 2033
- Figure 8: Europe Smart Packaging Industry Revenue (Million), by Technology 2025 & 2033
- Figure 9: Europe Smart Packaging Industry Revenue Share (%), by Technology 2025 & 2033
- Figure 10: Europe Smart Packaging Industry Revenue (Million), by End-user Vertical 2025 & 2033
- Figure 11: Europe Smart Packaging Industry Revenue Share (%), by End-user Vertical 2025 & 2033
- Figure 12: Europe Smart Packaging Industry Revenue (Million), by Country 2025 & 2033
- Figure 13: Europe Smart Packaging Industry Revenue Share (%), by Country 2025 & 2033
- Figure 14: Asia Pacific Smart Packaging Industry Revenue (Million), by Technology 2025 & 2033
- Figure 15: Asia Pacific Smart Packaging Industry Revenue Share (%), by Technology 2025 & 2033
- Figure 16: Asia Pacific Smart Packaging Industry Revenue (Million), by End-user Vertical 2025 & 2033
- Figure 17: Asia Pacific Smart Packaging Industry Revenue Share (%), by End-user Vertical 2025 & 2033
- Figure 18: Asia Pacific Smart Packaging Industry Revenue (Million), by Country 2025 & 2033
- Figure 19: Asia Pacific Smart Packaging Industry Revenue Share (%), by Country 2025 & 2033
- Figure 20: Latin America Smart Packaging Industry Revenue (Million), by Technology 2025 & 2033
- Figure 21: Latin America Smart Packaging Industry Revenue Share (%), by Technology 2025 & 2033
- Figure 22: Latin America Smart Packaging Industry Revenue (Million), by End-user Vertical 2025 & 2033
- Figure 23: Latin America Smart Packaging Industry Revenue Share (%), by End-user Vertical 2025 & 2033
- Figure 24: Latin America Smart Packaging Industry Revenue (Million), by Country 2025 & 2033
- Figure 25: Latin America Smart Packaging Industry Revenue Share (%), by Country 2025 & 2033
- Figure 26: Middle East and Africa Smart Packaging Industry Revenue (Million), by Technology 2025 & 2033
- Figure 27: Middle East and Africa Smart Packaging Industry Revenue Share (%), by Technology 2025 & 2033
- Figure 28: Middle East and Africa Smart Packaging Industry Revenue (Million), by End-user Vertical 2025 & 2033
- Figure 29: Middle East and Africa Smart Packaging Industry Revenue Share (%), by End-user Vertical 2025 & 2033
- Figure 30: Middle East and Africa Smart Packaging Industry Revenue (Million), by Country 2025 & 2033
- Figure 31: Middle East and Africa Smart Packaging Industry Revenue Share (%), by Country 2025 & 2033
List of Tables
- Table 1: Global Smart Packaging Industry Revenue Million Forecast, by Technology 2020 & 2033
- Table 2: Global Smart Packaging Industry Revenue Million Forecast, by End-user Vertical 2020 & 2033
- Table 3: Global Smart Packaging Industry Revenue Million Forecast, by Region 2020 & 2033
- Table 4: Global Smart Packaging Industry Revenue Million Forecast, by Technology 2020 & 2033
- Table 5: Global Smart Packaging Industry Revenue Million Forecast, by End-user Vertical 2020 & 2033
- Table 6: Global Smart Packaging Industry Revenue Million Forecast, by Country 2020 & 2033
- Table 7: United States Smart Packaging Industry Revenue (Million) Forecast, by Application 2020 & 2033
- Table 8: Canada Smart Packaging Industry Revenue (Million) Forecast, by Application 2020 & 2033
- Table 9: Global Smart Packaging Industry Revenue Million Forecast, by Technology 2020 & 2033
- Table 10: Global Smart Packaging Industry Revenue Million Forecast, by End-user Vertical 2020 & 2033
- Table 11: Global Smart Packaging Industry Revenue Million Forecast, by Country 2020 & 2033
- Table 12: Germany Smart Packaging Industry Revenue (Million) Forecast, by Application 2020 & 2033
- Table 13: United Kingdom Smart Packaging Industry Revenue (Million) Forecast, by Application 2020 & 2033
- Table 14: France Smart Packaging Industry Revenue (Million) Forecast, by Application 2020 & 2033
- Table 15: Rest of Europe Smart Packaging Industry Revenue (Million) Forecast, by Application 2020 & 2033
- Table 16: Global Smart Packaging Industry Revenue Million Forecast, by Technology 2020 & 2033
- Table 17: Global Smart Packaging Industry Revenue Million Forecast, by End-user Vertical 2020 & 2033
- Table 18: Global Smart Packaging Industry Revenue Million Forecast, by Country 2020 & 2033
- Table 19: China Smart Packaging Industry Revenue (Million) Forecast, by Application 2020 & 2033
- Table 20: Japan Smart Packaging Industry Revenue (Million) Forecast, by Application 2020 & 2033
- Table 21: India Smart Packaging Industry Revenue (Million) Forecast, by Application 2020 & 2033
- Table 22: Rest of Asia Pacific Smart Packaging Industry Revenue (Million) Forecast, by Application 2020 & 2033
- Table 23: Global Smart Packaging Industry Revenue Million Forecast, by Technology 2020 & 2033
- Table 24: Global Smart Packaging Industry Revenue Million Forecast, by End-user Vertical 2020 & 2033
- Table 25: Global Smart Packaging Industry Revenue Million Forecast, by Country 2020 & 2033
- Table 26: Global Smart Packaging Industry Revenue Million Forecast, by Technology 2020 & 2033
- Table 27: Global Smart Packaging Industry Revenue Million Forecast, by End-user Vertical 2020 & 2033
- Table 28: Global Smart Packaging Industry Revenue Million Forecast, by Country 2020 & 2033
Frequently Asked Questions
1. What is the projected Compound Annual Growth Rate (CAGR) of the Smart Packaging Industry?
The projected CAGR is approximately 7.12%.
2. Which companies are prominent players in the Smart Packaging Industry?
Key companies in the market include Stora Enso, BASF SE, 3M Company, Ball corporation, International Paper Compan, Amcor PLC, Avery Dennison Corporation, Huhtamaki OYJ, Zebra Technologies Corporation, Sealed Air Corporation.
3. What are the main segments of the Smart Packaging Industry?
The market segments include Technology, End-user Vertical.
4. Can you provide details about the market size?
The market size is estimated to be USD 22.67 Million as of 2022.
5. What are some drivers contributing to market growth?
Advancement in Technology in Food Packaging for Quality Inspection; Rising Awareness Regarding Food Safety; Development in the Printing Industry Due to Various Applications of Smart Packaging.
6. What are the notable trends driving market growth?
Active Packaging to Hold Major Share in the Market.
7. Are there any restraints impacting market growth?
High Costs Due to Initial Requirement.
8. Can you provide examples of recent developments in the market?
March 2023: Amcor, a company that creates and manufactures environment-friendly packaging solutions, announced a joint research project agreement with NfiniteNanotechnology Inc. to validate the application of Nfinite's nanocoating technology to improve packaging that can be recycled and composted.
9. What pricing options are available for accessing the report?
Pricing options include single-user, multi-user, and enterprise licenses priced at USD 4750, USD 5250, and USD 8750 respectively.
10. Is the market size provided in terms of value or volume?
The market size is provided in terms of value, measured in Million.
11. Are there any specific market keywords associated with the report?
Yes, the market keyword associated with the report is "Smart Packaging Industry," which aids in identifying and referencing the specific market segment covered.
12. How do I determine which pricing option suits my needs best?
The pricing options vary based on user requirements and access needs. Individual users may opt for single-user licenses, while businesses requiring broader access may choose multi-user or enterprise licenses for cost-effective access to the report.
13. Are there any additional resources or data provided in the Smart Packaging Industry report?
While the report offers comprehensive insights, it's advisable to review the specific contents or supplementary materials provided to ascertain if additional resources or data are available.
14. How can I stay updated on further developments or reports in the Smart Packaging Industry?
To stay informed about further developments, trends, and reports in the Smart Packaging Industry, consider subscribing to industry newsletters, following relevant companies and organizations, or regularly checking reputable industry news sources and publications.
Methodology
Step 1 - Identification of Relevant Samples Size from Population Database


Step 2 - Approaches for Defining Global Market Size (Value, Volume* & Price*)

Note*: In applicable scenarios
Step 3 - Data Sources
Primary Research
- Web Analytics
- Survey Reports
- Research Institute
- Latest Research Reports
- Opinion Leaders
Secondary Research
- Annual Reports
- White Paper
- Latest Press Release
- Industry Association
- Paid Database
- Investor Presentations

Step 4 - Data Triangulation
Involves using different sources of information in order to increase the validity of a study
These sources are likely to be stakeholders in a program - participants, other researchers, program staff, other community members, and so on.
Then we put all data in single framework & apply various statistical tools to find out the dynamic on the market.
During the analysis stage, feedback from the stakeholder groups would be compared to determine areas of agreement as well as areas of divergence

